FREQUENCY TRANSLATION WITHOUT MULTIPLICATION
Frequency translation is often called for in digital signal processing algorithms. There are simple schemes for inducing frequency translation by 1/2 and 1/4 of the signal sequence sample rate. Let's take a look at these mixing schemes.
13.1.1 Frequency Translation by fs/2
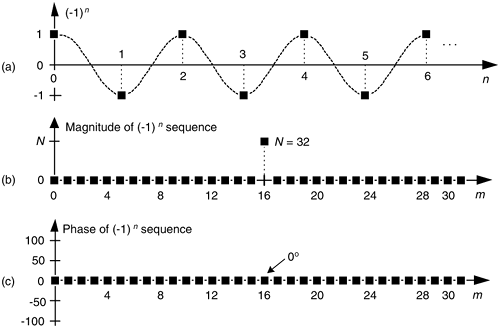
First we'll consider a technique for frequency translating an input sequence by fs/2 by merely multiplying a sequence by (–1)n = 1,–1,1,–1, ..., etc., where fs is the signal sample rate in Hz. This process may seem a bit mysterious at first, but it can be explained in a straightforward way if we review Figure 13-1(a).There we see that multiplying a time domain signal sequence by the (–1)n mixing sequence is equivalent to multiplying the signal sequence by a sampled cosinusoid where the mixing sequence samples are shown as the dots in Figure 13-1(a). Because the mixing sequence's cosine repeats every two sample values, its frequency is fs/2. Figure 13-1(b) and (c) show the discrete Fourier transform (DFT) magnitude and phase of a 32-sample (–1)n sequence. As such, the right half of those figures represents the negative frequency range.
Figure 13-1. Mixing sequence comprising (–1)n = 1,–1,1,–1, etc: (a) time-domain sequence; (b) frequency-domain magnitudes for 32 samples; (c) frequency-domain phase.
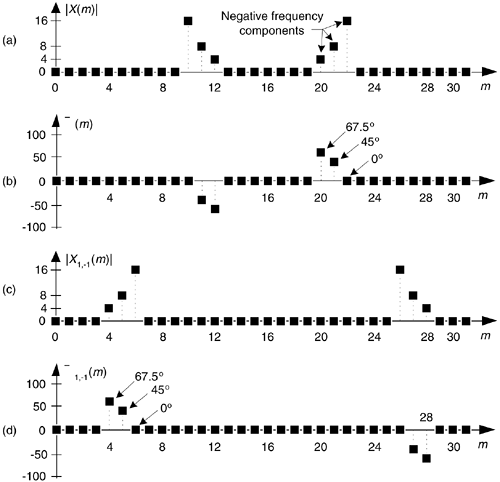
Let's demonstrate this (–1)n mixing by an example. Consider a real x(n) signal sequence having 32 samples of the sum of three sinusoids whose |X(m)| frequency magnitude and f(m) phase spectra are as shown in Figure 13-2(a) and (b). If we multiply that time signal sequence by (–1)n, the resulting x1,–1(n) time sequence will have the magnitude and phase spectra are that shown in Figure 13-2(c) and (d). Multiplying a time signal by our (–1)n, cosine shifts half its spectral energy up by fs/2 and half its spectral energy down by –fs/2. Notice in these non-circular frequency depictions that as we count up, or down, in frequency we wrap around the end points.
Figure 13-2. A signal and its frequency translation by fs/2: (a) original signal magnitude spectrum; (b) original phase; (c) the magnitude spectrum of the translated signal; (d) translated phase.
Here's a terrific opportunity for the DSP novice to convolve the (–1)n spectrum in Figure 13-1 with the X(m) spectrum to obtain the frequency-translated X1,–1(m) signal spectrum. Please do so; that exercise will help you comprehend the nature of discrete sequences and their time and frequency-domain relationships by way of the convolution theorem.
Remember now, we didn't really perform any explicit multiplications—the whole idea here is to avoid multiplications, we merely changed the sign of alternating x(n) samples to get x1,–1(n). One way to look at the X1,–1(m) magnitudes in Figure 13-2(c) is to see that multiplication by the (–1)n mixing sequence flips the positive frequency band of X(m) [X(0) to X(16)] about the fs/4 Hz point, and flips the negative frequency band of X(m) [X(17) to X(31)] about the –fs/4 Hz sample. This process can be used to invert the spectra of real signals when bandpass sampling is used as described in Section 2.4. By the way, in the DSP literature be aware that some clever authors may represent the (–1)n sequence with its equivalent expressions of

13.1.2 Frequency Translation by –fs/4
Two other simple mixing sequences form the real and imaginary parts of a complex –fs/4 oscillator used for frequency down-conversion to obtain a quadrature version (complex and centered at 0 Hz) of a real bandpass signal originally centered at fs/4. The real (in-phase) mixing sequence is cos(pn/2) = 1,0,–1,0, etc. shown in Figure 13-3(a). That mixing sequence's quadrature companion is –sin(pn/2) = 0,–1,0,1, etc. as shown in Figure 13-3(b). The spectral magnitudes of those two sequence are identical as shown in Figure 13-3(c), but their phase spectrum has a 90° shift relationship (what we call quadrature).
Figure 13-3. Quadrature mixing sequences for downconversion by fs/4: (a) in-phase mixing sequence; (b) quadrature phase mixing sequence; (c) the frequency magnitudes of both sequences for N = 32 samples; (d) the phase of the cosine sequence; (e) phase of the sine sequence.

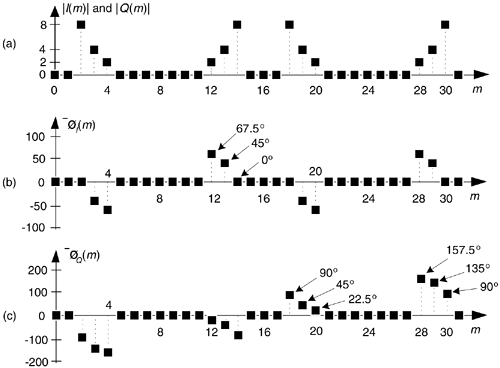
If we multiply the x(n) sequence whose spectrum is that in Figure 13-2(a) and (b) by the in-phase (cosine) mixing sequence, the product will have the I(m) spectrum shown in Figures 13-4(a) and (b). Again, X(m)'s spectral energy is translated up and down in frequency, only this time the translation is by ±fs/4. Multiplying x(n) by the quadrature phase (sine) sequence yields the Q(m) spectrum in Figure 13-4(a) and (c).
Figure 13-4. Spectra after translation down by fs/4: (a) I(m) and Q(m) spectral magnitudes; (b) phase of I(m) ; (c) phase of Q(m).
Because their time sample values are merely 1, –1, and 0, the quadrature mixing sequences are useful because downconversion by fs/4 can be implemented without multiplication. That's why these mixing sequences are of so much interest: downconversion of an input time sequence is accomplished merely with data assignment, or signal routing.
To downconvert a general x(n) = xreal(n) + jximag(n) sequence by fs/4, the value assignments are:
Equation 13-2
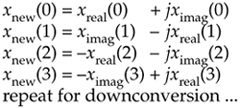
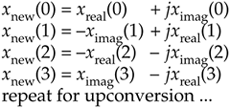
If your implementation is hardwired gates, the above data assignments are performed by means of routing signals (and their negatives). Although we've focused on downconversion so far, it's worth mentioning that upconversion of a general x(n) sequence by fs/4 can be performed with the following data assignments:
Equation 13-3
13.1.3 Filtering and Decimation after fs/4 Down-Conversion
There's an efficient way to perform the complex down-conversion and filtering of a real signal by fs/4 process we considered for the quadrature sampling scheme in Section 8.9. We can use a novel technique to greatly reduce the computational workload of the linear-phase lowpass filters[1–3]. In addition, decimation of the complex down-converted sequence by a factor of two is inherent, with no effort on our part, in this process.
Considering Figure 13-5(a), notice that if an original x(n) sequence was real-only, and its spectrum is centered at fs/4, multiplying x(n) by cos(pn/2) = 1,0,–1,0, for the in-phase path and –sin(pn/2) = 0,–1,0,1, for the quadrature phase path to down-convert x(n)'s spectrum to 0 Hz, yields the new complex sequence xnew(n) = xi(n) + xq(n), or
Equation 13-4
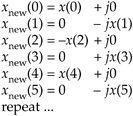
Figure 13-5. Down-conversion by fs/4 and filtering: (a) the process; (b) the data in the in-phase filter; (c) data within the quadrature phase filter.
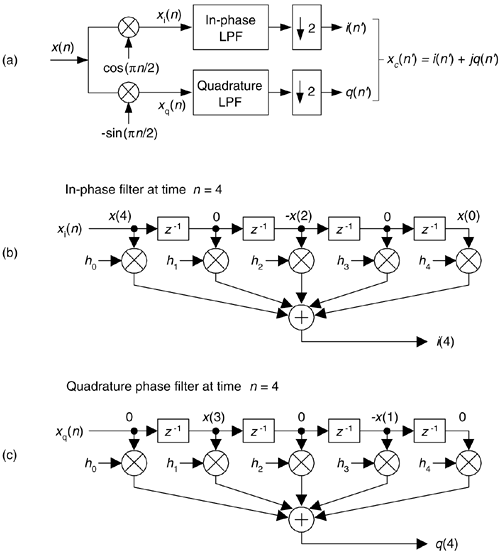
Next, we want to lowpass filter (LPF) both the xi(n) and xq(n) sequences followed by decimation by a factor of two.
Here's the trick. Let's say we're using five-tap FIR filters and at the n = 4 time index; the data residing in the two lowpass filters would be that shown in Figure 13-5(b) and (c). Due to the alternating zero-valued samples in the xi(n) and xq(n) sequences, we see that only five non-zero multiplies are being performed at this time instant. Those computations, at time index n = 4, are shown in the third row of the rightmost column in Table 13-1. Because we're decimating by two, we ignore the time index n = 5 computations. The necessary computations during the next time index (n = 6) are given in the fourth row of Table 13-1, where again only five non-zero multiplies are computed.
A review of Table 13-1 tells us we can multiplex the real-valued x(n) sequence, multiply the multiplexed sequences by the repeating mixing sequence 1,–1, ..., etc., and apply the resulting xi(n) and xq(n) sequences to two filters, as shown in Figure 13-6(a). Those two filters have decimated coefficients in the sense that their coefficients are the alternating h(k) coefficients from the original lowpass filter in Figure 13-5. The two new filters are depicted in Figure 13-6(b), showing the necessary computations at time index n = 4. Using this new process, we've reduced our multiplication workload by a factor of two. The original data multiplexing in Figure 13-6(a) is what implemented our desired decimation by two.
Figure 13-6. Efficient down-conversion, filtering and decimation: (a) process block diagram; (b) the modified filters and data at time n = 4; (c) process when a half-band filter is used.
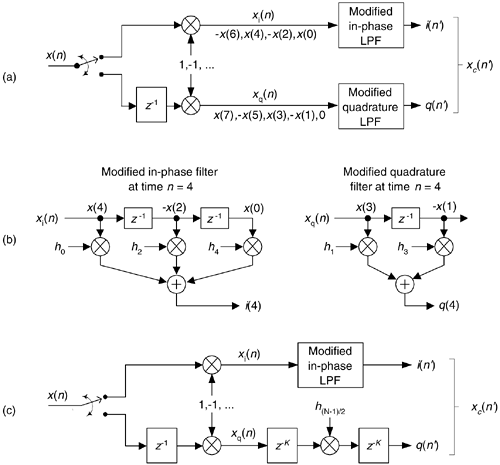
Table 13-1. Filter Data and Necessary Computations after Decimation by Two
|
Time |
Data in the Filters |
Necessary Computations |
||||
|---|---|---|---|---|---|---|
|
n = 0 |
x(0) |
– |
– |
– |
– |
i(0) = x(0)h0 |
|
h0 |
h1 |
h2 |
h3 |
h4 |
||
|
0 |
– |
– |
– |
– |
q(0) = 0 |
|
|
n = 2 |
–x(2) |
0 |
x(0) |
– |
– |
i(2) = x(0)h2 –x(2)h0 |
|
h0 |
h1 |
h2 |
h3 |
h4 |
||
|
0 |
–x(1) |
0 |
– |
– |
q(2) = –x(1)h1 |
|
|
n = 4 |
x(4) |
0 |
–x(2) |
0 |
x(0) |
i(4) = x(0)h4 –x(2)h2 +x(4)h0 |
|
h0 |
h1 |
h2 |
h3 |
h4 |
||
|
0 |
x(3) |
0 |
–x(1) |
0 |
q(4) = –x(1)h3 +x(3)h1 |
|
|
n = 6 |
–x(6) |
0 |
x(4) |
0 |
–x(2) |
i(6) = –x(2)h4 +x(4)h2 –x(6)h0 |
|
h0 |
h1 |
h2 |
h3 |
h4 |
||
|
0 |
–x(5) |
0 |
x(3) |
0 |
q(6) = x(3)h3 –x(5)h1 |
|
|
n = 8 |
x(8) |
0 |
–x(6) |
0 |
x(4) |
i(8) = x(4)h4 –x(6)h2 +x(8)h0 |
|
h0 |
h1 |
h2 |
h3 |
h4 |
||
|
0 |
x(7) |
0 |
–x(5) |
0 |
q(8) = –x(5)h3 +x(7)h1dn7 |
|
Here's another feature of this efficient down-conversion structure. If half-band filters are used in Figure 13-5(a), then only one of the coefficients in the modified quadrature lowpass filter is non-zero. This means we can implement the quadrature-path filtering as K unit delays, a single multiply by the original half-band filter's center coefficient, followed by another K delay as depicted in Figure 13-6(c). For an original N-tap half-band filter, K is the integer part of N/4. If the original half-band filter's h(N–1)/2 center coefficient is 0.5, as is often the case, we can implement its multiply by an arithmetic right shift of the delayed xq(n).
This down-conversion process is indeed slick. Here's another attribute. If the original lowpass filter in Figure 13-5(a) has an odd number of taps, the coefficients of the modified filters in Figure 13-6(b) will be symmetrical and we can use the folded FIR filter scheme (Section 13.7) to reduce the number of multipliers (at the expense of additional adders) by almost another factor of two!
Finally, if we need to invert the output xc(n') spectrum, there are two ways to do so. We can negate the 1,–1, sequence driving the mixer in the quadrature path, or we can swap the order of the single unit delay and the mixer in the quadrature path.
URL http://proquest.safaribooksonline.com/0131089897/ch13lev1sec1
 |
Amazon |  |
