FILTERING ASPECTS OF TIME-DOMAIN AVERAGING
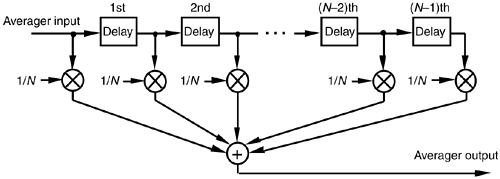
In Section 5.2 we introduced FIR filters with an averaging example, and that's where we first learned that the process of time-domain averaging performs low-pass filtering. In fact, successive time-domain outputs of an N-point averager are identical to the output of an (N–1)-tap FIR filter whose coefficients are all equal to 1/N, as shown in Figure 11-11.
Figure 11-11. An N-point averager depicted as an FIR filter.
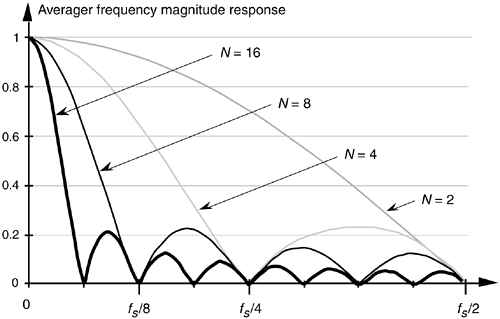
The question we'll answer here is "What is the frequency magnitude response of a generic N-point averager?" We could evaluate Eq. (6-28), with all a(k) = 0, describing the frequency response of a generic N-stage FIR filter. In that expression, we'd have to set all the b(0) through b(N) coefficient values equal to 1/N and calculate HFIR(w)'s magnitude over the normalized radian frequency range of 0  w p. That range corresponds to an actual frequency range of 0 f fs/2 (where fs is the equivalent data sample rate in Hz). A simpler approach is to recall, from Section 5.2, that we can calculate the frequency response of an FIR filter by taking the DFT of the filter's coefficients. In doing so, we'd use an M-point FFT software routine to transform a sequence of N coefficients whose values are all equal to 1/N. Of course, M should be larger than N so that the sin(x)/x shape of the frequency response is noticeable. Following through on this by using a 128-point FFT routine, our N-point averager's frequency magnitude responses, for various values of N, are plotted in Figure 11-12. To make these curves more meaningful, the frequency axis is defined in terms of the sample rate fs in samples/s.
Figure 11-12. N-point averager's frequency magnitude response as a function of N.
| Amazon | ||
