IMPULSE INVARIANCE IIR FILTER DESIGN METHOD
The impulse invariance method of IIR filter design is based upon the notion that we can design a discrete filter whose time-domain impulse response is a sampled version of the impulse response of a continuous analog filter. If that analog filter (often called the prototype filter) has some desired frequency response, then our IIR filter will yield a discrete approximation of that desired response. The impulse response equivalence of this design method is depicted in Figure 6-23, where we use the conventional notation of d to represent an impulse function and hc(t) is the analog filter's impulse response. We use the subscript "c" in Figure 6-23(a) to emphasize the continuous nature of the analog filter. Figure 6-23(b) illustrates the definition of the discrete filter's impulse response: the filter's time-domain output sequence when the input is a single unity-valued sample (impulse) preceded and followed by all zero-valued samples. Our goal is to design a digital filter whose impulse response is a sampled version of the analog filter's continuous impulse response. Implied in the correspondence of the continuous and discrete impulse responses is the property that we can map each pole on the s-plane for the analog filter's Hc(s) transfer function to a pole on the z-plane for the discrete IIR filter's H(z) transfer function. What designers have found is that the impulse invariance method does yield useful IIR filters, as long as the sampling rate is high relative to the bandwidth of the signal to be filtered. In other words, IIR filters designed using the impulse invariance method are susceptible to aliasing problems because practical analog filters cannot be perfectly band-limited. Aliasing will occur in an IIR filter's frequency response as shown in Figure 6-24.
Figure 6-23. Impulse invariance design equivalence of (a) analog filter continuous impulse response; (b) digital filter discrete impulse response.
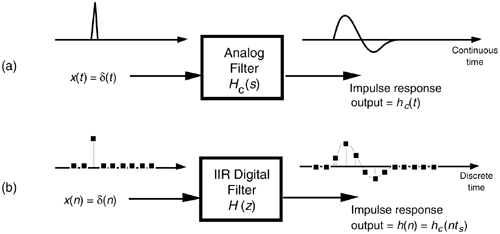
Figure 6-24. Aliasing in the impulse invariance design method: (a) prototype analog filter magnitude response; (b) replicated magnitude responses where HIIR(w) is the discrete Fourier transform of h(n) = hc(nts); (c) potential resultant IIR filter magnitude response with aliasing effects.
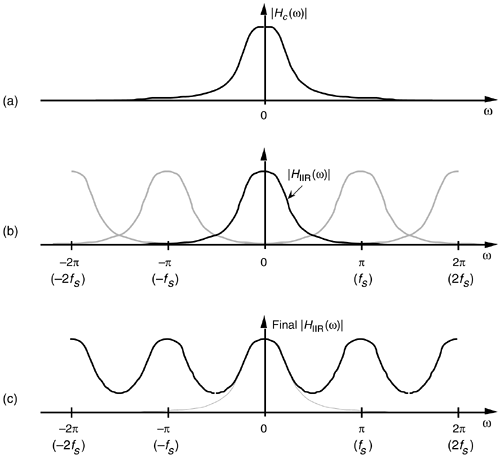
From what we've learned in Chapter 2 about the spectral replicating effects of sampling, if Figure 6-4(a) is the spectrum of the continuous hc(t) impulse response, then the spectrum of the discrete hc(nts) sample sequence is the replicated spectra in Figure 6-24(b).
In Figure 6-24(c) we show the possible effect of aliasing where the dashed curve is a desired HIIR(w) frequency magnitude response. However, the actual frequency magnitude response, indicated by the solid curve, can occur when we use the impulse invariance design method. For this reason, we prefer to make the sample frequency fs as large as possible to minimize the overlap between the primary frequency response curve and its replicated images spaced at multiples of ±fs Hz. To see how aliasing can affect IIR filters designed with this method, let's list the necessary impulse invariance design steps and then go through a filter design example.
There are two different methods for designing IIR filters using impulse invariance. The first method, which we'll call Method 1, requires that an inverse Laplace transform as well as a z-transform be performed[12,13]. The second impulse invariance design technique, Method 2, uses a direct substitution process to avoid the inverse Laplace and z-transformations at the expense of needing partial fraction expansion algebra necessary to handle polynomials[14–17]. Both of these methods seem complicated when described in words, but they're really not as difficult as they sound. Let's compare the two methods by listing the steps required for each of them. The impulse invariance design Method 1 goes like this:
|
Method 1, Step 1: |
Design (or have someone design for you) a prototype analog filter with the desired frequency response.[ |
|
|
|
|
Which is the general form of Eq. (6-10) with N < M, and a(k) and b(k) are constants. |
|
|
Method 1, Step 2: |
Determine the analog filter's continuous time-domain impulse response hc(t) from the Hc(s) Laplace transfer function. I hope this can be done using Laplace tables as opposed to actually evaluating an inverse Laplace transform equation. |
|
Method 1, Step 3: |
Determine the digital filter's sampling frequency fs, and calculate the sample period as ts = 1/fs. The fs sampling rate is chosen based on the absolute frequency, in Hz, of the prototype analog filter. Because of the aliasing problems associated with this impulse invariance design method, later, we'll see why fs should be made as large as practical. |
|
Method 1, Step 4: |
Find the z-transform of the continuous hc(t) to obtain the IIR filter's z-domain transfer function H(z) in the form of a ratio of polynomials in z. |
|
Method 1, Step 5: |
Substitute the value (not the variable) ts for the continuous variable t in the H(z) transfer function obtained in Step 4. In performing this step, we are ensuring, as in Figure 6-23, that the IIR filter's discrete h(n) impulse response is a sampled version of the continuous filter's hc(t) impulse response so that h(n) = hc(nts), for 0 |
|
Method 1, Step 6: |
Our H(z) from Step 5 will now be of the general form |
|
Equation 6-44
|
|
|
Because the process of sampling the continuous impulse response results in a digital filter frequency response that's scaled by a factor of 1/ts, many filter designers find it appropriate to include the ts factor in Eq. (6-44). So we can rewrite Eq. (6-44) as |
|
|
Equation 6-45
|
|
|
Incorporating the value of ts in Eq. (6-45), then, makes the IIR filter time-response scaling independent of the sampling rate, and the discrete filter will have the same gain as the prototype analog filter.[ |
|
|
Method 1, Step 7: |
Because Eq. (6-44) is in the form of Eq. (6-25), by inspection, we can express the filter's time-domain difference equation in the general form of Eq. (6-21) as |
|
Equation 6-46
|
|
|
Choosing to incorporate ts, as in Eq. (6-45), to make the digital filter's gain equal to the prototype analog filter's gain by multiplying the b(k) coefficients by the sample period ts leads to an IIR filter time-domain expression of the form |
|
|
Equation 6-47
|
|
|
Notice how the signs changed for the a(k) coefficients from Eqs. (6-44) and (6-45) to Eqs. (6-46) and (6-47). These sign changes always seem to cause problems for beginners, so watch out. Also, keep in mind that the time-domain expressions in Eq. (6-46) and Eq. (6-47) apply only to the filter structure in Figure 6-18. The a(k) and b(k), or ts · b(k), coefficients, however, can be applied to the improved IIR structure shown in Figure 6-22 to complete our design. |
|
[
] In a low-pass filter design, for example, the filter type (Chebyshev, Butterworth, elliptic), filter order (number of poles), and the cutoff frequency are parameters to be defined in this step.
[
] Some authors have chosen to include the ts factor in the discrete h(n) impulse response in the above Step 4, that is, make h(n) = tshc(nts) [14, 18]. The final result of this, of course, is the same as that obtained by including ts as described in Step 5.
Before we go through an actual example of this design process, let's discuss the other impulse invariance design method.
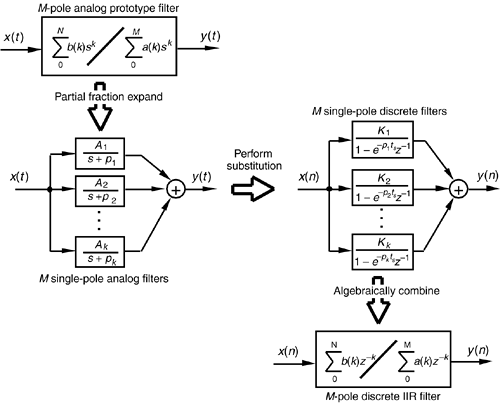
The impulse invariance Design Method 2, also called the standard z-transform method, takes a different approach. It mathematically partitions the prototype analog filter into multiple single-pole continuous filters and then approximates each one of those by a single-pole digital filter. The set of M single-pole digital filters is then algebraically combined to form an M-pole, Mth-ordered IIR filter. This process of breaking the analog filter to discrete filter approximation into manageable pieces is shown in Figure 6-25. The steps necessary to perform an impulse invariance Method 2 design are:
Figure 6-25. Mathematical flow of the impulse invariance design Method 2.
|
Method 2, Step 1: |
Obtain the Laplace transfer function Hc(s) for the prototype analog filter in the form of Eq. (6-43). (Same as Method 1, Step 1.) |
|
Method 2, Step 2: |
Select an appropriate sampling frequency fs and calculate the sample period as ts = 1/fs. (Same as Method 1, Step 3.) |
|
Method 2, Step 3: |
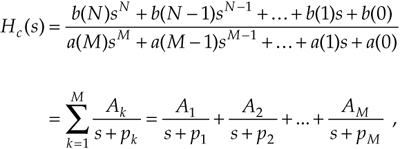
Express the analog filter's Laplace transfer function Hc(s) as the sum of single-pole filters. This requires us to use partial fraction expansion methods to express the ratio of polynomials in Eq. (6-43) in the form of |
|
Equation 6-48
|
|
|
where the individual Ak factors are constants and the kth pole is located at –pk on the s-plane. We'll denote the kth single-pole analog filter as Hk(s), or |
|
|
Equation 6-49
|
|
|
Method 2, Step 4: |
Substitute |
|
Equation 6-50
|
|
|
The final combined discrete filter transfer function H(z) is the sum of the single-poled discrete filters, or |
|
|
Equation 6-51
|
|
|
Keep in mind that the above H(z) is not a function of time. The ts factor in Eq. (6-51) is a constant equal to the discrete-time sample period. |
|
|
Method 2, Step 5: |
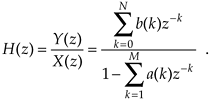
Calculate the z-domain transfer function of the sum of the M single-pole digital filters in the form of a ratio of two polynomials in z. Because the H(z) in Eq. (6-51) will be a series of fractions, we'll have to combine those fractions over a common denominator to get a single ratio of polynomials in the familiar form of |
|
Equation 6-52
|
|
|
Method 2, Step 6: |
Just as in Method 1 Step 6, by inspection, we can express the filter's time-domain equation in the general form of |
|
Equation 6-53
|
|
|
Again, notice the a(k) coefficient sign changes from Eq. (6-52) to Eq. (6-53). As described in Method 1 Steps 6 and 7, if we choose to make the digital filter's gain equal to the prototype analog filter's gain by multiplying the b(k) coefficients by the sample period ts, then the IIR filter's time-domain expression will be in the form |
|
|
Equation 6-54
|
|
|
yielding a final H(z) z-domain transfer function of |
|
|
Equation 6-54'
|
|
|
Finally, we can implement the improved IIR structure shown in Figure 6-22 using the a(k) and b(k) coefficients from Eq. (6-53) or the a(k) and ts.b(k) coefficients from Eq. (6-54). |
|
To provide a more meaningful comparison between the two impulse invariance design methods, let's dive in and go through an IIR filter design example using both methods.
6.4.1 Impulse Invariance Design Method 1 Example
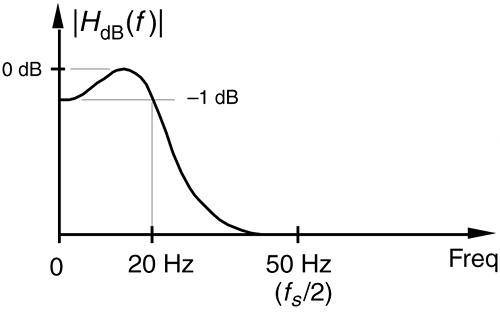
Assume that we need to design an IIR filter that approximates a second-order Chebyshev prototype analog low-pass filter whose passband ripple is 1 dB. Our fs sampling rate is 100 Hz (ts = 0.01), and the filter's 1 dB cutoff frequency is 20 Hz. Our prototype analog filter will have a frequency magnitude response like that shown in Figure 6-26.
Figure 6-26. Frequency magnitude response of the example prototype analog filter.
Given the above filter requirements, assume that the analog prototype filter design effort results in the Hc(s) Laplace transfer function of
Equation 6-55

It's the transfer function in Eq. (6-55) that we intend to approximate with our discrete IIR filter. To find the analog filter's impulse response, we'd like to get Hc(s) into a form that allows us to use Laplace transform tables to find hc(t).
Searching through systems analysis textbooks we find the following Laplace transform pair:
Equation 6-56

Our intent, then, is to modify Eq. (6-55) to get it into the form on the left side of Eq. (6-56). We do this by realizing that the Laplace transform expression in Eq. (6-56) can be rewritten as
Equation 6-57

If we set Eq. (6-55) equal to the right side of Eq. (6-57), we can solve for A, a, and w. Doing that,
Equation 6-58

Solving Eq. (6-58) for A, a, and w, we first find
Equation 6-59

Equation 6-60

so
Equation 6-61

and
Equation 6-62

OK, we can now express Hc(s) in the desired form of the left side of Eq. (6-57) as
Equation 6-63

Using the Laplace transform pair in Eq. (6-56), the time-domain impulse response of the prototype analog filter becomes
Equation 6-64

OK, we're ready to perform Method 1, Step 4, to determine the discrete IIR filter's z-domain transfer function H(z) by performing the z-transform of hc(t). Again, scanning through digital signal processing textbooks or a good math reference book, we find the following z-transform pair where the time-domain expression is in the same form as Eq. (6-64)'s hc(t) impulse response:
Equation 6-65

Remember now, the a and w in Eq. (6-65) are generic and are not related to the a and w values in Eq. (6-59) and Eq. (6-61). Substituting the constants from Eq. (6-64) into the right side of Eq. (6-65), we get the z-transform of the IIR filter as
Equation 6-66

Performing Method 1, Step 5, we substitute the ts value of 0.01 for the continuous variable t in Eq. (6-66), yielding the final H(z) transfer function of
Equation 6-67
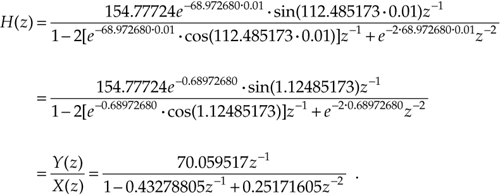
OK, hang in there; we're almost finished. Here are the final steps of Method 1. Because of the transfer function H(z) = Y(z)/X(z), we can cross-multiply the denominators to rewrite the bottom line of Eq. (6-67) as

or
Equation 6-68

By inspection of Eq. (6-68), we can now get the time-domain expression for our IIR filter. Performing Method 1, Steps 6 and 7, we multiply the x(n–1) coefficient by the sample period value of ts = 0.01 to allow for proper scaling as
Equation 6-69

and there we (finally) are. The coefficients from Eq. (6-69) are what we use in implementing the improved IIR structure shown in Figure 6-22 to approximate the original second-order Chebyshev analog low-pass filter.
Let's see if we get the same result if we use the impulse invariance design Method 2 to approximate the example prototype analog filter.
6.4.2 Impulse Invariance Design Method 2 Example
Given the original prototype filter's Laplace transfer function as
Equation 6-70

and the value of ts = 0.01 for the sample period, we're ready to proceed with Method 2's Step 3. To express Hc(s) as the sum of single-pole filters, we'll have to factor the denominator of Eq. (6-70) and use partial fraction expansion methods. For convenience, let's start by replacing the constants in Eq. (6-70) with variables in the form of
Equation 6-71

where b = 137.94536, and c = 17410.145. Next, using Eq. (6-15) with a = 1, we can factor the quadratic denominator of Eq. (6-71) into
Equation 6-72

If we substitute the values for b and c in Eq. (6-72), we'll find that the quantity under the radical sign is negative. This means that the factors in the denominator of Eq. (6-72) are complex. Because we have lots of algebra ahead of us, let's replace the radicals in Eq. (6-72) with the imaginary term jR, where j =  and R = |(b2–4c)/4|, such that
Equation 6-73

OK, partial fraction expansion methods allow us to partition Eq. (6-73) into two separate fractions of the form
Equation 6-74
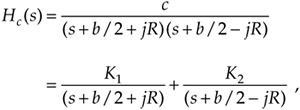
where the K1 constant can be found to be equal to jc/2R and constant K2 is the complex conjugate of K1, or K2 = –jc/2R. (To learn the details of partial fraction expansion methods, the interested reader should investigate standard college algebra or engineering mathematics textbooks.) Thus, Hc(s) can be of the form in Eq. (6-48) or
Equation 6-75

We can see from Eq. (6-75) that our second-order prototype filter has two poles, one located at p1 = –b/2 – jR and the other at p2 = –b/2 + jR. We're now ready to map those two poles from the s-plane to the z-plane as called out in Method 2, Step 4. Making our  substitution for the s + pk terms in Eq. (6-75), we have the following expression for the z-domain single-pole digital filters,
Equation 6-76

Our objective in Method 2, Step 5 is to massage Eq. (6-76) into the form of Eq. (6-52), so that we can determine the IIR filter's feed forward and feedback coefficients. Putting both fractions in Eq. (6-76) over a common denominator gives us
Equation 6-77

Collecting like terms in the numerator and multiplying out the denominator gives us
Equation 6-78

Factoring the exponentials and collecting like terms of powers of z in Eq. (6-78),
Equation 6-79

Continuing to simplify our H(z) expression by factoring out the real part of the exponentials,
Equation 6-80

We now have H(z) in a form with all the like powers of z combined into single terms, and Eq. (6-80) looks something like the desired form of Eq. (6-52). Knowing that the final coefficients of our IIR filter must be real numbers, the question is "What do we do with those imaginary j terms in Eq. (6-80)?" Once again, Euler to the rescue.[ ] Using Euler's equations for sinusoids, we can eliminate the imaginary exponentials and Eq. (6-80) becomes
[
] From Euler, we know that sin(ø) = (ejø – e–jø)/2j, and cos(ø) = (ejø + e–jø)/2.
Equation 6-81
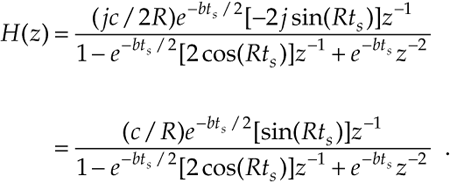
If we plug the values c = 17410.145, b = 137.94536, R = 112.48517, and ts = 0.01 into Eq. (6-81), we get the following IIR filter transfer function:
Equation 6-82

Because the transfer function H(z) = Y(z)/X(z), we can again cross-multiply the denominators to rewrite Eq. (6-82) as

or
Equation 6-83

Now we take the inverse z-transform of Eq. (6-83), by inspection, to get the time-domain expression for our IIR filter as
Equation 6-84

One final step remains. To force the IIR filter gain equal to the prototype analog filter's gain, we multiply the x(n–1) coefficient by the sample period ts as suggested in Method 2, Step 6. In this case, there's only one x(n) coefficient, giving us
Equation 6-85

that compares well with the Method 1 result in Eq. (6-69). (Isn't it comforting to work a problem two different ways and get the same result?)
Figure 6-27 shows, in graphical form, the result of our IIR design example. The s-plane pole locations of the prototype filter and the z-plane poles of the IIR filter are shown in Figure 6-27(a). Because the s-plane poles are to the left of the origin and the z-plane poles are inside the unit circle, both the prototype analog and the discrete IIR filters are stable. We find the prototype filter's s-plane pole locations by evaluating Hc(s) in Eq. (6-75). When s = –b/2 – jR, the denominator of the first term in Eq. (6-75) becomes zero and Hc(s) is infinitely large. That s = –b/2 – jR value is the location of the lower s-plane pole in Figure 6-27(a). When s = –b/2 + jR, the denominator of the second term in Eq. (6-75) becomes zero and s = –b/2 + jR is the location of the second s-plane pole.
Figure 6-27. Impulse invariance design example filter characteristics: (a) s-plane pole locations of prototype analog filter and z-plane pole locations of discrete IIR filter; (b) frequency magnitude response of the discrete IIR filter.
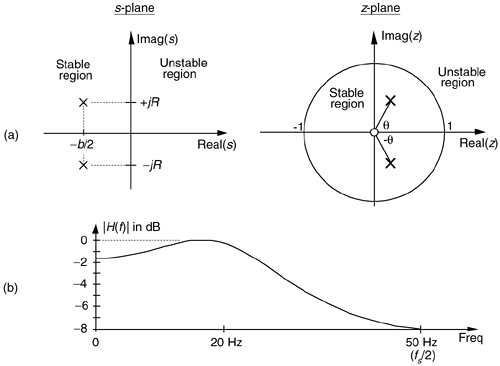
The IIR filter's z-plane pole locations are found from Eq. (6-76). If we multiply the numerators and denominators of Eq. (6-76) by z,
Equation 6-86

In Eq. (6-86), when z is set equal to  the denominator of the first term in Eq. (6-86) becomes zero and H(z) becomes infinitely large. The value of z of
Equation 6-87

defines the location of the lower z-plane pole in Figure 6-27(a). Specifically, this lower pole is located at a distance of  = 0.5017 from the origin, at an angle of q = –Rts radians, or –64.45°. Being conjugate poles, the upper z-plane pole is located the same distance from the origin at an angle of q = Rts radians, or +64.45°. Figure 6-27(b) illustrates the frequency magnitude response of the IIR filter in Hz.
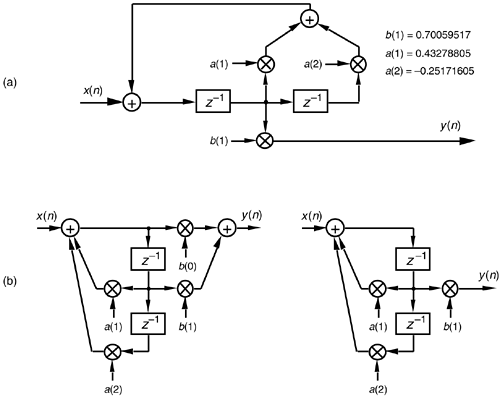
Two different implementations of our IIR filter are shown in Figure 6-28. Figure 6-28(a) is an implementation of our second-order IIR filter based on the general IIR structure given in Figure 6-22, and Figure 6-28(b) shows the second-order IIR filter implementation based on the alternate structure from Figure 6-21(b). Knowing that the b(0) coefficient on the left side of Figure 6-28(b) is zero, we arrive at the simplified structure on the right side of Figure 6-28(b). Looking carefully at Figure 6-28(a) and the right side of Figure 6-28(b), we can see that they are equivalent.
Figure 6-28. Implementations of the impulse invariance design example filter.
Although both impulse invariance design methods are covered in the literature, we might ask, "Which one is preferred?" There's no definite answer to that question because it depends on the Hc(s) of the prototype analog filter. Although our Method 2 example above required more algebra than Method 1, if the prototype filter's s-domain poles were located only on the real axis, Method 2 would have been much simpler because there would be no complex variables to manipulate. In general, Method 2 is more popular for two reasons: (1) the inverse Laplace and z-transformations, although straightforward in our Method 1 example, can be very difficult for higher order filters, and (2) unlike Method 1, Method 2 can be coded in a software routine or a computer spreadsheet.
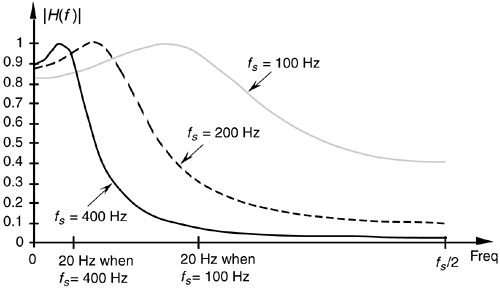
Upon examining the frequency magnitude response in Figure 6-27(b), we can see that this second-order IIR filter's roll-off is not particularly steep. This is, admittedly, a simple low-order filter, but its attenuation slope is so gradual that it doesn't appear to be of much use as a low-pass filter.[ ] We can also see that the filter's passband ripple is greater than the desired value of 1 dB in Figure 6-26. What we'll find is that it's not the low order of the filter that contributes to its poor performance, but the sampling rate used. That second-order IIR filter response is repeated as the shaded curve in Figure 6-29. If we increased the sampling rate to 200 Hz, we'd get the frequency response shown by the dashed curve in Figure 6-29. Increasing the sampling rate to 400 Hz results in the much improved frequency response indicated by the solid line in the figure. Sampling rate changes do not affect our filter order or implementation structure. Remember, if we change the sampling rate, only the sample period ts changes in our design equations, resulting in a different set of filter coefficients for each new sampling rate. So we can see that the smaller we make ts (larger fs) the better the resulting filter when either impulse invariance design method is used because the replicated spectral overlap indicated in Figure 6-24(b) is reduced due to the larger fs sampling rate. The bottom line here is that impulse invariance IIR filter design techniques are most appropriate for narrowband filters; that is, low-pass filters whose cutoff frequencies are much smaller than the sampling rate.
[
] A piece of advice: whenever you encounter any frequency representation (be it a digital filter magnitude response or a signal spectrum) that has nonzero values at +fs/2, be suspicious—be very suspicious—that aliasing is taking place.
Figure 6-29. IIR filter frequency magnitude response, on a linear scale, at three separate sampling rates. Notice how the filter's absolute cutoff frequency of 20 Hz shifts relative to the different fs sampling rates.
The second analytical technique for analog filter approximation, the bilinear transform method, alleviates the impulse invariance method's aliasing problems at the expense of what's called frequency warping. Specifically, there's a nonlinear distortion between the prototype analog filter's frequency scale and the frequency scale of the approximating IIR filter designed using the bilinear transform. Let's see why.
URL http://proquest.safaribooksonline.com/0131089897/ch06lev1sec4
 |
Amazon |  |

 n
n  .
.



 location on the z-plane is how we approximate the impulse response of each single-pole analog filter by a single-pole digital filter. (The reader can find the derivation of this

