Importing Data to Create Organization Charts
Many organizations maintain human resources information in formats that aren't visual. With the Organization Chart Wizard template, you can create an organization chart by importing employee information already stored in corporate data sources such as databases and data files. If the organizational structure changes, you can simply update the chart rather than having to re-create ita huge timesaver, especially for large organizations. You can import organization data from Microsoft Office Excel spreadsheets (.xlsx), text files (.txt), Microsoft Office Exchange Server directories, Microsoft Office Access databases (.accdb), or any ODBC-compliant (Open Data Base Connectivity) database application.
Important
For the Organization Chart Wizard template to work, the source data must be properly formatted and include, at minimum, data identifying unique employee names and the managers to whom they report. In an Excel spreadsheet, columns of information represent data fields that can be imported to create an organization chart. For example, a human resources spreadsheet might include columns listing each person's name, manager, department, title, e-mail address, phone number, and office number.
With the Organization Chart Wizard template, you first specify the data source you want to use to import the data, and then you determine which columns contain the information for the organization chart. In a typical chart, Visio uses an Employee Name field and a Reports to field (the manager's name) to specify the reporting structure. That means that every employee name in the data source must be associated with the name of the manager to whom the employee reports (except the person at the very top of the organization). For example, if Jon Morris (employee) reports to Don Funk (manager), the data source must include both of those pieces of information so that Visio can structure the organization chart correctly.
Next, you select the data fields you want to appear in the organization chart and identify the additional fields you want to simply import as shape data (formerly custom properties) and store with each shape. Shape data is a category of information that is stored with each shape and that correspond to data. For example, a Manager shape might include a Telephone category, and the telephone number would be the shape data. Shape data for a shape might include Name, Manager, Department, Title, E-mail Address, Phone Number, and Office Number. However, your organization chart might display only each employee's name and title. The additional shape data can be viewed through the Shape Data window in Visio, but it doesn't appear in the organization chart unless you want it to.
Tip
Depending on the size and number of shapes in your organization charts, you might need to periodically zoom in to the drawing page to see the shapes and text more clearly.
In this exercise, you import data from an Excel spreadsheet to generate an organization chart for Wide World Importers. In addition to importing the Name and Reports To fields, you import data identifying the title, telephone number, and e-mail address for each employee.
Tip
For help creating organization charts, type organization chart in the Type A Question For Help box on the right side of the menu bar.
USE the Employees.xlsx file located in DocumentsMicrosoft PressVisio 2007 SBS �6_OrgCharts.
|
1. |
Start Visio. In the Template Categories list, click Business. Under Other Templates, double-click Organization Chart Wizard. 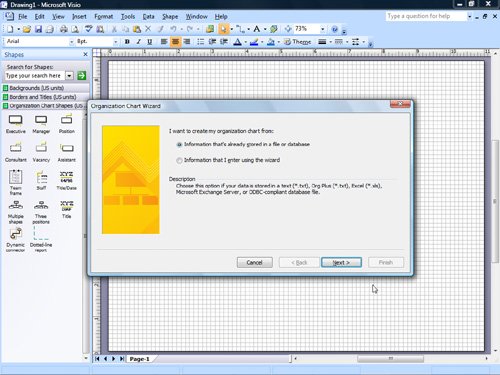
|
|
2. |
On the first page of the Organization Chart Wizard, make sure the Information that's already stored in a file or database option is selected, and then click Next. |
|
3. |
Make sure the A text, Org Plus (*.txt) or Excel file option is selected, and then click Next. |
|
4. |
Click Browse, navigate to the 06_OrgCharts folder, and then double-click Employees.xlsx. |
|
5. |
Click Next. |
|
6. |
In the Name box, make sure Name is displayed, and in the Reports to box, make sure Manager is displayed. Click Next. 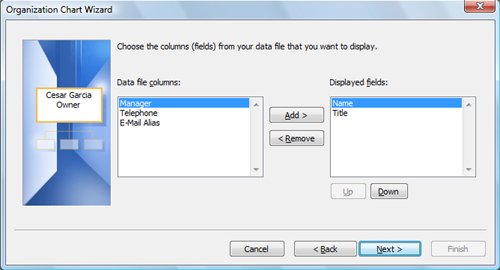
|
|
7. |
Make sure the Displayed fields list displays Name and Title. Click Next. |
|
8. |
In the Data file columns box, click Telephone, and then click the Add button to move Telephone to the Shape Data fields box. 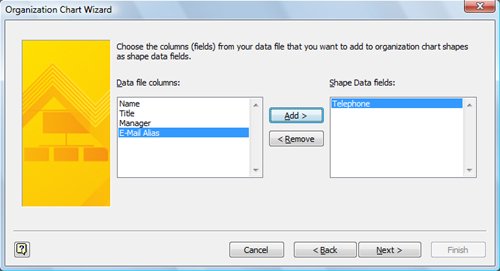
|
|
9. |
Repeat the previous step to add E-Mail Alias to the Shape Data fields box. Click Next. |
|
10. |
Make sure the I want the wizard to automatically break my organization chart across pages option is selected, and then click Finish. 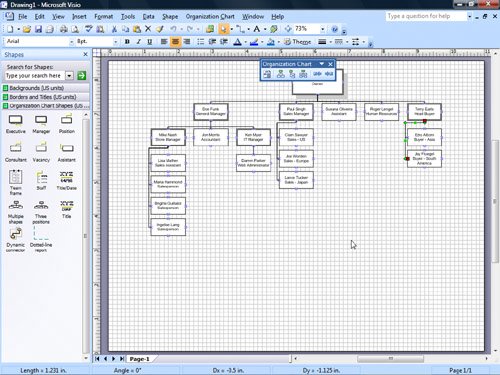
|
|
11. |
From the Organization Chart Shapes stencil, drag a Consultant shape onto the Jay Fluegel shape. Tip At this point in the exercise, you might need to periodically zoom in to the drawing page to see the shapes and text more clearly. |
|
12. |
In the Connecting Shapes dialog box, select the Don't show this message again option, and then click OK. 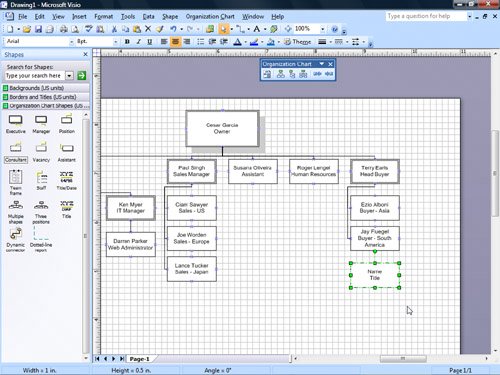
Tip To create your own organization charts from scratch or revise existing ones, simply drag shapes on top of one another as you did in the previous step. Visio positions and connects the shapes to create the organization hierarchy for you. |
|
13. |
With the shape selected, press |
|
14. |
Type Paula Bento, press Tip You can also add up to 50 employee shapes to your organization chart at once by using the Multiple shapes shape on the Organization Chart Shapes stencil. Just drag it on top of the shape that represents the manager to whom all the employees report, and then in the dialog box, select the number of and type of shapes you want to add. |
|
15. |
Click the pasteboard or a blank area of the drawing page to close the text block and deselect the shape. 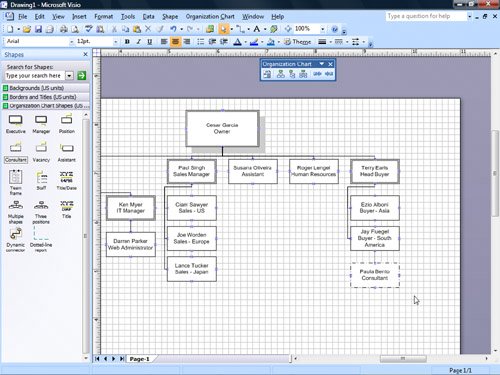
|
|
16. |
On the File menu, click Close, and then click No when Visio asks you if you want to save the changes to the drawing. |
 to open the shape's text block.
 , and then type Consultant.
Quick Reference
Getting Started with Visio 2007
- Getting Started with Visio 2007
- Starting Diagrams by Using Templates
- Working Within the Visio Environment
- Customizing the Visio Environment
- Getting Visio and Diagram Help
- Key Points
Adding Shapes to Diagrams
- Adding Shapes to Diagrams
- Working with 1-D and 2-D Shapes
- Adding Text to Shapes and the Drawing Page
- Moving, Sizing, Rotating, and Copying Shapes
- Working with Groups
- Finding Shapes for Diagrams
- Inserting Pictures into Diagrams
- Key Points
Formatting Shapes and Diagrams
- Formatting Shapes and Diagrams
- Formatting Individual Shapes
- Adding Decorative Elements to Diagrams
- Applying Themes to Entire Diagrams
- Key Points
Connecting Shapes
- Connecting Shapes
- Connecting Shapes in Flowcharts
- Modifying Shape Connections
- Changing the Layout of Connected Shapes
- Key Points
Creating Project Schedules
- Creating Project Schedules
- Creating Timelines to View Projects at a Glance
- Exporting Timelines to Create Gantt Charts
- Tracking Project Details with Gantt Charts
- Key Points
Creating Organization Charts
- Creating Organization Charts
- Importing Data to Create Organization Charts
- Storing and Displaying Employee Information in Organization Charts
- Customizing the Layout of Organization Charts
- Key Points
Laying Out Office Spaces
- Laying Out Office Spaces
- Creating Scaled Office Spaces
- Adding Door, Window, and Furniture Shapes to Office Layouts
- Organizing Shapes in Office Layouts by Using Layers
- Key Points
Creating Network Diagrams
- Creating Network Diagrams
- Connecting Shapes in Network Diagrams
- Storing Information with Network Shapes
- Creating Network Reports
- Key Points
Glossary
About the Authors
Choose the Right Book for You
EAN: 2147483647
Pages: 81
