Color Images
Because photoelements can gather only brightness information of a pixel, special techniques are necessary to obtain color images. As mentioned above, a color image can be described by a multiplane image, in which each plane represents a single color, for example, red, blue, and green. On the camera side, two principles for obtaining color images are possible:
- If the CCD sensor uses a high number of color filters, as shown in Figure 2.30(left side), the color planes can be generated sequentially. This leads to a very complex sensor as well as to special timing requirements of the reading sequence.
Figure 2.30. Possibilities for Color CCD Sensors
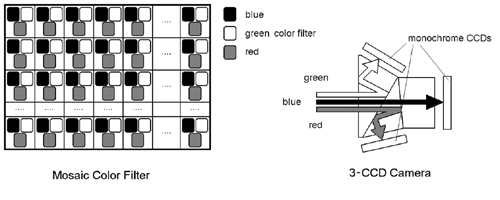
- In high end cameras , the light beam is split into three components : a red, a blue, and a green beam, which affect monochrome CCD sensors (right side of Figure 2.30). The three color planes are generated simultaneously and merged to a color image by the camera electronics.
Color Models
Because the planes of a color image are split into red, blue, and green, it is natural to define these colors as the basic elements of a color image. You will find out later that this specific color model leads to some disadvantages, especially if a computer has to distinguish between colors.
By the way, humans perceive color differently, and sometimes it is necessary to use color models, which make use of other properties like intensity , saturation , hue , or luminance . We first describe the RGB color model and then discuss these other description techniques.
The RGB Color Model
Figure 2.31 shows the RGB color space, using a cube created by three axes representing pure red, green, and blue color. A main property of this color space is that the sum of all three basic colors, using maximum intensity, is white. Gray-scale values follow the line from black (the origin of the coordinate system) to white.
Figure 2.31. RGB Color Cube
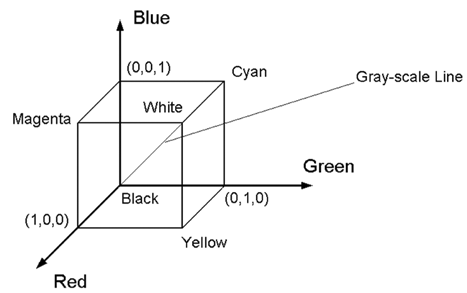
Full intensity of a single color is defined with the value 1. Therefore, if a value of (1, 1, 1) should be white, the RGB color model is obviously based on additive color mixing.
If a color image has to be converted into a gray-scale image, the following equations can be used. One possibility is the simple average of the color values, using R , G , B for the color values and GS for the gray-scale value:
Equation 2.6

Another equation, which takes into account the luminance perception of the human eye, is
Equation 2.7

The CMY (CMYK) Color Model
Also shown in Figure 2.31 are the basic colors for a subtractive model: cyan, magenta , and yellow, which are the complements of the colors red, blue, and green. It is easy to go from RGB to CMY with these simple equations:
Equation 2.8

or
Equation 2.9

and back to RGB with:
Equation 2.10

or
Equation 2.11

If a color image has to be printed, black ( K ) as a fourth color is added to the model to achieve a purer black than the simple combination of the other three colors, resulting in the CMYK model. Transformation from CMY to CMYK is done by
Equation 2.12
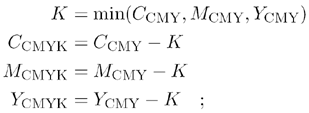
and from CMYK to CMY
Equation 2.13

The HSI Color Model
As mentioned above, it might be useful to use a different color system, based on more natural properties like hue, saturation, and color intensity. Figure 2.32 shows that this color space can be represented by a solid shown in the right side of the figure. Any color point on the solid surface represents a fully saturated color.
Figure 2.32. HSI Color Triangle and Color Solid
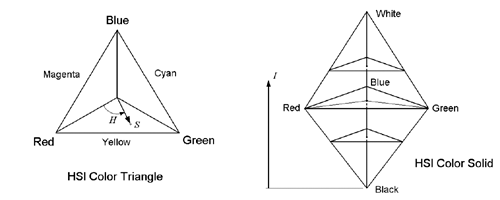
The color hue is defined as the angle starting from the red axis; intensity is represented by the distance from the black point. The following formulas can be used to convert values from RGB to HSI:
Equation 2.14

Equation 2.15

Equation 2.16

LabVIEW often uses the luminance value instead of intensity, leading to an HSL model. The luminance is calculated by
Equation 2.17

which corresponds to Eq. (2.7) and replaces Eq. (2.14).
Exercise 2.4: Color Space Transformation.
These fundamentals are perfect for the creation of a color space transformation calculator, shown in Figure 2.33. You can adjust the sliders according to the red, green, and blue values of the desired color. The frame around these sliders is a color box that changes its color according to the RGB components.
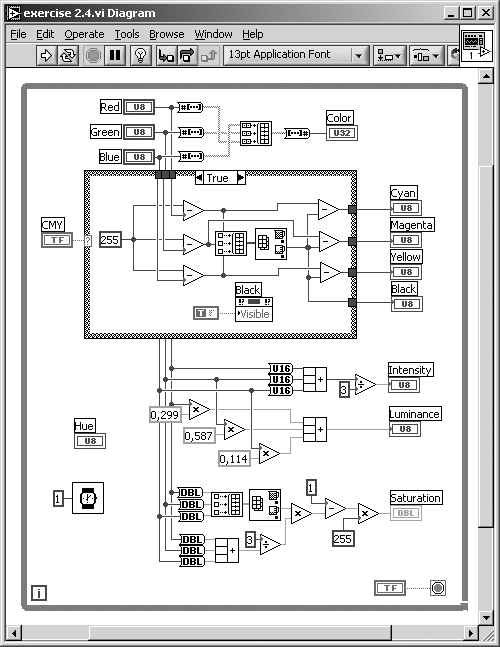
The first (easy) task is to calculate the CMY or the CMYK values, respectively. The HSI/HSL values are more difficult, according to Eq. (2.14) to (2.17). Note that the unsigned 8-bit values have to be converted into 16-bit values if results that may exceed the value 255 are calculated (see Figure 2.34). I left the calculation of the hue value for your training.
Figure 2.33. Front Panel of the VI Created in Exercise 2.4
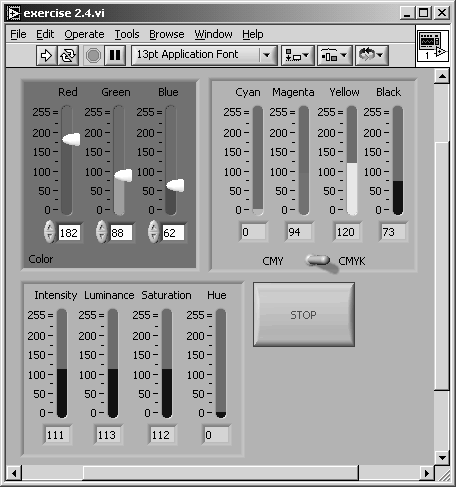
Figure 2.34. Diagram of the VI Created in Exercise 2.4
The YIQ Color Model
This model is used in commercial video broadcasting. Its main advantage is that the Y component contains all information of the monochrome video signal. This is important because monochrome TV receivers should be able to display suitable data, also from a color video signal. The conversion from RGB to YIQ is done with this equation:
Equation 2.18

and the conversion from YIQ to RGB:
Equation 2.19

Moreover, this model takes advantage of the human sensitivity to luminance changes, which is much higher than to changes in hue or saturation.
Color Video Standards
As mentioned above, YIQ is a color model used by video standards. In general, the following types of color video signals are possible:
- Component video offers the best quality because each basic signal (e.g., Y, I, and Q) is sent as a separate video signal, which behavior of course requires more bandwidth.
- Composite video : Here, color and luminance signals are mixed into a single carrier wave C ; for example, according to
Equation 2.20

where w C is the frequency of the color subcarrier (a typical composite video signal is FBAS).
- S-video (or separated video) uses two channels, one for luminance and another for a composite color signal (another name for this signal is Y/C).
YIQ, for example, is used in the U.S. NTSC video standard. The European PAL standard uses a similar model called YUV, where U and V are simply generated by
Equation 2.21

Sometimes, U is also called C r (redness) and V is called C b (blueness), forming the model YC b C r . Table 2.4 gives an overview of the two relevant color video standards, NTSC and PAL.
Table 2.4. Comparison of PAL and NTSC Color Video Standards
|
Standard: |
PAL (Europe) |
NTSC (U.S.) |
|---|---|---|
|
Monochrome video standard: |
CCIR |
RS 170 |
|
Color model: |
YUV (YC b C r ) |
YIQ |
Color in Digital Video
Digital video transfer and recording offer a number of advantages, such as random access, repeated recording, and no need for sync pulses ; on the other hand, it requires a lot more bandwidth. Almost all digital video standards use component video and the YUV color model. Table 2.5 shows properties of some standards.
Table 2.5. Standards for Digital Video
|
Standard: |
CCIR 601 |
CCIR 601 |
CIF |
QCIF |
|---|---|---|---|---|
|
525/60 |
625/50 |
|||
|
NTSC |
PAL/SECAM |
|||
|
Luminance resolution: |
720 x 485 |
720 x 576 |
352 x 288 |
176 x 144 |
|
Color resolution: |
360 x 485 |
360 x 576 |
176 x 144 |
88 x 72 |
|
Color subsampling: |
4:2:2 |
4:2:2 |
4:2:0 |
4:2:0 |
|
Fields/sec: |
60 |
50 |
30 |
30 |
|
Interlacing: |
Yes |
Yes |
No |
No |
The line "color subsampling" in Table 2.5 shows some cryptic expressions like 4:2:2; they indicate that the color (or chrominance ) information can be decimated to reduce the need for bandwidth. For example, 4:4:4 would mean that each pixel will contain the Y (luminance) value as well as the U and V (chrominance) values. Because of the lower sensitivity of the human eye to color, it is in most cases not necessary to sample the color information with the same resolution as the luminance information.
Figure 2.35. Color Subsampling in Digital Video
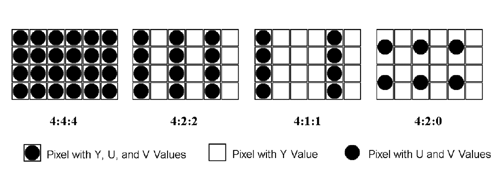
The expression 4:2:2 means that the chrominance signals U and V are horizontally subsampled by a factor of 2 (see Figure 2.35). In the same way, 4:1:1 indicates horizontal subsampling by a factor of 4. The expression 4:2:0 is more difficult; here, subsampling is decimated in both the horizontal and vertical dimensions by a factor of 2. Figure 2.35 illustrates that the color pixel is actually placed between the rows and columns of the brightness pixels.
Other Image Sources |
Introduction and Definitions
- Introduction
- Some Definitions
- Introduction to IMAQ Vision Builder
- NI Vision Builder for Automated Inspection
Image Acquisition
- Image Acquisition
- Charge-Coupled Devices
- Line-Scan Cameras
- CMOS Image Sensors
- Video Standards
- Color Images
- Other Image Sources
Image Distribution
- Image Distribution
- Frame Grabbing
- Camera Interfaces and Protocols
- Compression Techniques
- Image Standards
- Digital Imaging and Communication in Medicine (DICOM)
Image Processing
Image Analysis
- Image Analysis
- Pixel Value Analysis
- Quantitative Analysis
- Shape Matching
- Pattern Matching
- Reading Instrument Displays
- Character Recognition
- Image Focus Quality
- Application Examples
About the CD-ROM
EAN: 2147483647
Pages: 55
