QUADRATURE SIGNALS IN THE FREQUENCY DOMAIN
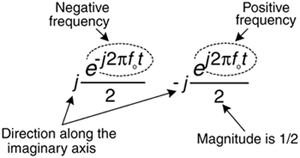
Now that we know much about the time-domain nature of quadrature signals, we're ready to look at their frequency-domain descriptions. We'll illustrate the full three-dimensional aspects of the frequency domain so none of the phase relationships of our quadrature signals will be hidden from view. Figure 8-9 tells us the rules for representing complex exponentials in the frequency domain.
Figure 8-9. Frequency-domain interpretation of complex exponentials.

We'll represent a single complex exponential as a narrow impulse located at the frequency specified in the exponent. In addition, we'll show the phase relationships between those complex exponentials along the real and imaginary frequency-domain axes. To illustrate those phase relationships, a complex frequency domain representation is necessary. With all this said, take a look at Figure 8-10.
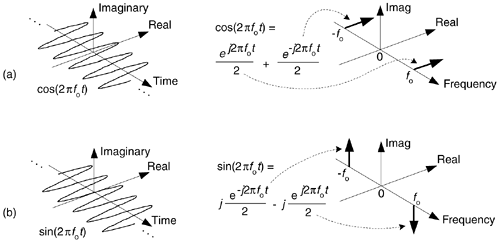
Figure 8-10. Complex time and frequency domain representations: (a) cosine wave; (b) a sinewave.

See how a real cosine wave and a real sinewave are depicted in our complex frequency domain representation on the right side of Figure 8-10. Those bold arrows on the right of Figure 8-10 are not rotating phasors, but are frequency-domain impulse symbols indicating a single spectral line for a single complex exponential such as  . The directions in which the spectral impulses are pointing merely indicate the relative phases of the spectral components. The amplitude of those spectral impulses are 1/2. Notice how the spectrum of cos(2pfot) is real-only. That's because cos(2pfot) is an even function in time, its value at negative time t is equal to its value at positive time t, or

The sin(2pfot) function, on the other hand, has an imaginary-only spectrum because it's an odd function. An odd function's value at negative time t is equal to the negative of its value at positive time t, or
Equation 8-16

Why are we bothering with this 3-dimensional frequency-domain representation? Because it's the tool we'll use to understand the generation (modulation) and detection (demodulation) of quadrature signals in digital (and some analog) communications systems, and that's one of the goals of this chapter. Before we go there, however, let's validate this frequency-domain representation with a little example.
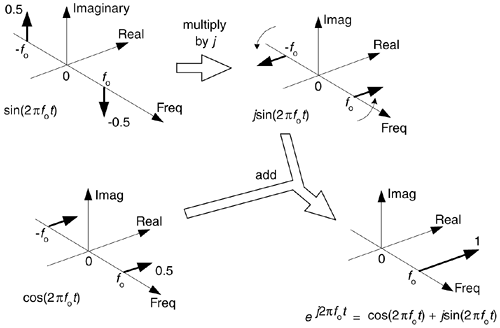
Figure 8-11 is a straightforward example of how we use the complex frequency domain. There we begin with a real sinewave, multiply it by j, and then add it to a real cosine wave of the same frequency. The result is the single complex exponential  , illustrating graphically Euler's identity that we stated mathematically in Eq. (8-7).
Figure 8-11. Complex frequency-domain view of Euler's:  = cos(2pfot) + jsin(2pfot).

On the frequency axis, the notion of negative frequency is seen as those spectral impulses located at –2pfo radians/sec on the frequency axis. This figure shows the big payoff: when we use complex notation, generic complex exponentials like ej2pft and e–j2pft are the fundamental constituents of the real sinusoids sin(2pft) or cos(2pft). That's because both sin(2pft) and cos(2pft) are made up of ej2pft and e–j2pft components. If you were to take the discrete Fourier transform (DFT) of discrete time-domain samples of a sin(2pfot) sinewave, a cos(2pfot) cosine wave, or a  complex sinusoid and plot the complex results, you'd get exactly the narrow frequency-domain impulses in Figure 8-11.
If you understand the notation and operations in Figure 8-11, pat yourself on the back, because you now know a great deal about the nature and mathematics of quadrature signals.
URL http://proquest.safaribooksonline.com/0131089897/ch08lev1sec5
 |
Amazon |  |
