Sample Telesales Dashboard
This sample dashboard was designed to monitor real-time operations so that a telesales supervisor can take necessary actions without delay. This isn't a dashboard that's likely to be looked at once a day, but one that will be kept available and examined throughout the day. It doesn't display as many measures as the examples you've seen so far in this chapter, because too many measures can be overwhelming when the dashboard is used to monitor real-time operations that require quick responses. Only the following six measures are included:
- Call wait time
- Call duration
- Abandoned calls (that is, callers who got tired of waiting and hung up)
- Call volume
- Order volume
- Sales representative utilization (representatives online compared to the number available)
That's itand that's plenty for a dashboard of this type.
Imagine that you're responsible for a team of around 25 telesales representatives and are using the dashboard in Figure 8-12 to keep on top of their activities throughout the day.
The primary metrics that you must vigilantly monitor are the length of time customers are waiting to connect with a sales representative, the length of time sales representatives are spending on calls, and the number of customers who are getting discouraged and hanging up while waiting to get through. Because of their importance, these three metrics are located in the upper-left corner of the dashboard and are extremely easy to read.
When problems arise, such as the lengthy hold times and excessively lengthy calls shown in this example, you must quickly determine the cause before taking action. This is when you would switch your focus to the performance of the individual sales representatives, which you can see on the right side of the dashboard. Individuals are ranked by performance, with those performing poorly at the top and a red rectangle highlighting those who are performing outside the acceptable range.
Figure 8-12. A sample telesales dashboard.
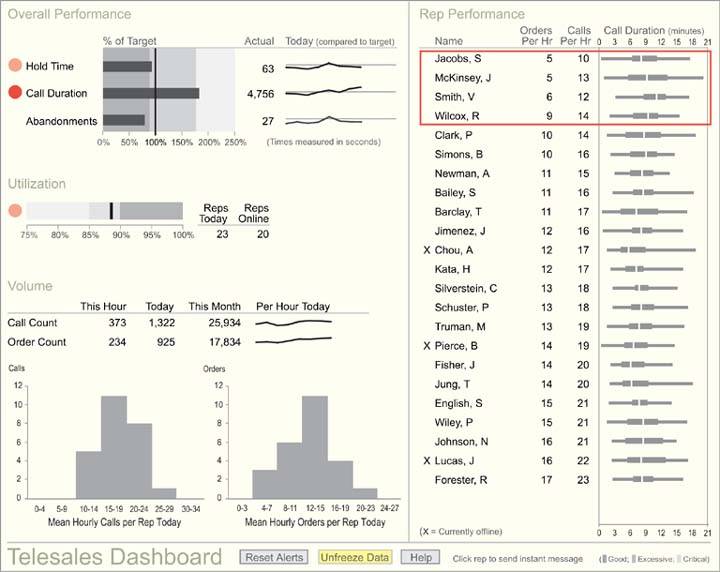
As a dashboard for monitoring real-time operations, the data would probably change with updates every few seconds. This can be distracting when you're trying to focus on a problem, however, so a "Freeze Data/Unfreeze Data" button has been provided to temporarily put a halt to updates. When updates are frozen, the button shines yellow to remind you of this fact. If the display remains frozen for too long, the button begins to blink with a brighter yellow until clicked to once again allow updates. When alerts first appear (the red circles), they blink to attract attention and perhaps even emit an audio signal to alert you if you aren't watching the screen. To stop these signals, you click the red alert. To remind you that you've blocked the alerts from providing urgent signals, the "Reset Alerts" button turns yellow, and after a while begins to blink. Once clicked, all alerts can once again signal urgent conditions if necessary.
Clarifying the Vision
- Clarifying the Vision
- All That Glitters Is Not Gold
- Even Dashboards Have a History
- Dispelling the Confusion
- A Timely Opportunity
Variations in Dashboard Uses and Data
Thirteen Common Mistakes in Dashboard Design
- Thirteen Common Mistakes in Dashboard Design
- Exceeding the Boundaries of a Single Screen
- Supplying Inadequate Context for the Data
- Displaying Excessive Detail or Precision
- Choosing a Deficient Measure
- Choosing Inappropriate Display Media
- Introducing Meaningless Variety
- Using Poorly Designed Display Media
- Encoding Quantitative Data Inaccurately
- Arranging the Data Poorly
- Highlighting Important Data Ineffectively or Not at All
- Cluttering the Display with Useless Decoration
- Misusing or Overusing Color
- Designing an Unattractive Visual Display
Tapping into the Power of Visual Perception
- Tapping into the Power of Visual Perception
- Understanding the Limits of Short-Term Memory
- Visually Encoding Data for Rapid Perception
- Gestalt Principles of Visual Perception
- Applying the Principles of Visual Perception to Dashboard Design
Eloquence Through Simplicity
- Eloquence Through Simplicity
- Characteristics of a Well-Designed Dashboard
- Key Goals in the Visual Design Process
Effective Dashboard Display Media
- Effective Dashboard Display Media
- Select the Best Display Medium
- An Ideal Library of Dashboard Display Media
- Summary
Designing Dashboards for Usability
- Designing Dashboards for Usability
- Organize the Information to Support Its Meaning and Use
- Maintain Consistency for Quick and Accurate Interpretation
- Make the Viewing Experience Aesthetically Pleasing
- Design for Use as a Launch Pad
- Test Your Design for Usability
Putting It All Together
EAN: 2147483647
Pages: 80
