Analysis of the Editor Optimization Requirement
|
Performance improvement is an iterative process that is typically broken down into four phases. |
- Collecting performance data (profiling)
- Analyzing the collected data (possibly prototyping)
- Implementing the improvements
- Testing the implementation
Typically, you collect performance data with the help of a profiling tool. If no tool is available, you can collect data about the time spent in methods and functions of interest by using the performance counter or the internal timer provided by .NET. But be careful. Inserting timing measures can itself change the timing of the application. For example, if the data is written to a file while the program is running, the result might be not be correct because of the time consumed by the slow I/O calls.
Performance analysis is usually done via a top-down approach. First we look at the system level, then at the application level, and last at micro-architecture level. The top-down approach enables us to eliminate bottlenecks or inefficiencies in the analysis that might mask underlying problems in the lower layers.
We use a profiling tool for our initial performance analysis of the photo editor application. We use the tool to collect information about the system's overall performance (including all layers). After the initial performance analysis is finished, we develop a test program that enables us to prototype and to evaluate various optimization possibilities.
We highly recommend the use of profiling tools for the initial system analysis. Profiling tools enable developers to identify bottlenecks in systems very quickly. As with all development, the 80/20 rule is applicable to system optimization: You will spend 20 percent of the total time implementing 80 percent of the improvements. Therefore, it is advisable to look into the "big" improvement possibilities first before getting bogged down in details of minor improvements.
10.2.1 Profiling the Photo Editor Application
As mentioned before, profiling is the task of collecting performance data of a software system. In the example shown here, we use the Quantify tool from Rational to uncover bottlenecks and to analyze the performance of the application.
The first step is to record overall reports of common use cases in which performance problems are experienced. The use case we use to record the data is the contrast calculation that is applied to an image:
A user changes the contrast using the Contrast control and applies the result to the entire image using the Apply button.
This scenario is run with an instrumented version of the application that is run from within the profiler application. (Instrumented means that the profiler does the magic of recording and timing all method calls.) Figure 10.1 shows the collected data for this use case. The figure shows the collection of all the method calls that were made, including the number of calls to the method and some additional timing measures.
Figure 10.1. Profiling Result for the Photo Editor Application
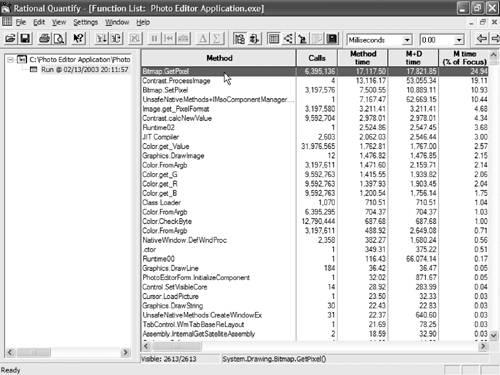
To identify problem areas, we sort the list by the time spent in each method (shown in the Method Time column). The first column shows the name of the method that was executed; the second column lists how often it was called, and the third column shows the accumulated time that was spent in the method. The column M+D Time shows the time spent in the described method and all its descendants.
The profiling result shows that the most time is spent in the method GetPixel() of the Bitmap class. This is not surprising because the method, in the case of the contrast calculation, is called twice for each pixel in the image. (In addition, this method is called twice for each calculation of the intermediate result shown in the preview pane.)
We can drill down the list of methods to inspect the profiling data for any method in different views. Figure 10.2 shows the Contrast plugin's ProcessImage method.
Figure 10.2. Profiling the Invoked ProcessImage Method
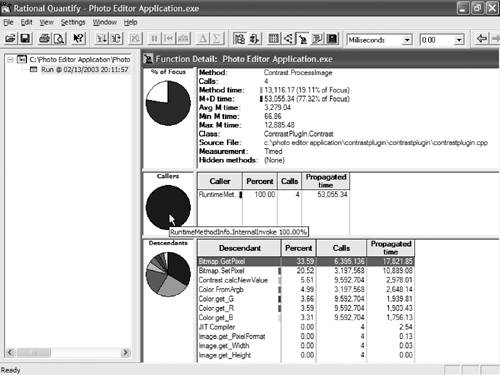
This pie chart view shows a method and all the calls to other methods. In the example, the ProcessImage method calls the GetPixel and SetPixel methods of GDI+. The calls to get and set the pixel take by far the most time and are good candidates for optimization.
10.2.2 Optimization Possibilities and Prototyping
Based on the profiling results, it seems feasible to change the implementation of the plugin to use pointer arithmetic to get and set the pixel values of the image instead of using the GDI+-provided get and set methods.
With this performance optimization, we want to improve the application's overall performance, and in addition we would like to optimize the GUI response time. This means that the application GUI should not block when a lengthy calculation is being applied on an image. Instead, the GUI should still respond to the user, with the restriction that no new calculation on the image can be started before the current calculation is finished. In other words, all image calculations are handled sequentially, but other GUI operations (such as switching tab controls) can be performed.
Introducing .NET
- Introducing .NET
- The Need for .NET
- The .NET Framework
- The C# Language
- Debugging and the IDE
- References for Further Reading
Introducing Software Engineering
- Introducing Software Engineering
- Introducing Software Engineering Practices
- Choosing a Software Development Model
- Commonly Used Software Development Models
- Conclusion
- References for Further Reading
A .NET Prototype
- Getting Started
- Evaluating .NET for Windows Client Applications
- Our First .NET Application
- Prototyping
- Implementing the SmartNotes Application
- Visual Studio.NET: Platform of Choice
- References for Further Reading
Project Planning
- Project Planning
- The Project Vision and Business Case
- The Initial Use Case Model
- Project Requirements
- Initial Project Planning
- Initial Risk Analysis
- Initial Requirements Analysis and Design
- Conclusion
- References for Further Reading
The Photo Editor Application
- The Photo Editor Application
- The Refined Project Vision and Business Case
- Refined Requirements for Online Photo Shop
- Analysis of the Photo Editor Requirements
- Design of the Photo Editor Application
- The Detailed Project Schedule
- Implementation of the Photo Editor Application
- Unit Tests
- Conclusion
- References for Further Reading
GDI+ Graphics Extensions
- GDI+ Graphics Extensions
- Requirements for the GDI+ Extensions
- Analysis of the GDI+ Extensions Requirements
- Design of the GDI+ Extensions
- Project Management Issues
- GDI+ Programming
- Drawing GDI+ Primitives
- Unit Tests
- Conclusion
- References for Further Reading
Advanced GDI+ Operations
- Advanced GDI+ Operations
- Advanced GDI+ Extensions
- Analysis of the Advanced GDI+ Extensions Requirements
- Design of the Advanced GDI+ Extensions
- Project Management Issues
- Using Pens and Brushes in GDI+
- Implementation of Regions, Pens, and Brushes
- Unit Tests
- Conclusion
Dynamic Loading of Components
- Dynamic Loading of Components
- Requirements for Image Postprocessing Components
- Analysis of the Image Postprocessing Requirements
- Design of the Image-Processing Components Using Late Binding
- Project Management Issues
- Implementing Dynamically Loadable Image Postprocessing Plugins
- Unit Tests
- Conclusion
- References for Further Reading
Accessing System Resources
- Accessing System Resources
- Refining Requirements for 3D Text Display
- Three-Dimensional Rendering Technologies
- Analyzing User Interface Needs
- Using OpenGL.NET
- Adding 3D Text to the Photo Editor Application
- Conclusion: Dont Reinvent the Wheel
- References for Further Reading
Performance Optimization, Multithreading, and Profiling
- Performance Optimization, Multithreading, and Profiling
- Requirements for Performance Optimization
- Analysis of the Editor Optimization Requirement
- Design of the Optimizations
- Project Management Issues
- Multithreading and Optimization Implementation
- Unit Tests
- Conclusion
- References for Further Reading
Building the Web Application with ASP.NET
- Building the Web Application with ASP.NET
- Online Store Requirements
- Analyzing Interfaces and Activities
- Breakdown of the Code Modules
- Implementation of Online Photo Shop
- Conclusion
Security and Database Access
- Security and Database Access
- Secure Checkout
- Integrating Externally Supplied Software
- E-mail, Password, Credit Card: Creating a Customer Profile
- Secure Web Applications
- Database Access with ADO.NET
- Putting It All Together
- No Longer under Construction
- References for Further Reading
Product Release
EAN: 2147483647
Pages: 123
