Risk Analysis
Overview
"If you do not actively attack risks, they will actively attack you."
— Tom Gilb
| Key Point |
A latent defect is an existing defect that has not yet caused a failure because the exact set of conditions has never been met. A masked defect is an existing defect that hasn't yet caused a failure, because another defect has prevented that part of the code from being executed. |
There's no way we can ever guarantee that a software system will be "perfect," because failures may come from many unexpected directions. A latent defect in a system that has run well for many years may cause the system to fail unexpectedly. Hardware may fail or defects may remain undetected for years, then suddenly become unmasked. These effects may be amplified as changes to interfaces and protocols in one part of the system begin to interfere with legacy software in another part. Multiplying numbers of users may stress the system, or changes in the business model may cause them to use it in ways that were never originally foreseen. A changing operating environment may also pose risks that can undermine a sound software design, creating implementation and operational problems.
In his article "Chaos Into Success," Jim Johnson reported that only 26% of projects met the criteria for success - completed on time, on budget, and with all of the features and functions originally specified. Unfortunately, the disaster stories behind these statistics are often more difficult to digest than the numbers themselves. In an article in IEEE Computer magazine, Nancy Leveson and Clark Turner reported that a computerized radiation therapy machine called Therac-25 caused six known incidents of accidental overdose between June 1985 and January 1987, which resulted in deaths and serious injuries. According to Space Events Diary, corrupted software may have been the cause of the failure of the upper stage on a Titan 4B spacecraft on April 30, 1999. The malfunction caused the upper stage of the rocket to misfire and place its payload (a communications satellite) in the wrong orbit. A review of newspapers, magazines, and Web sites will show that these are only a few of the documented incidents caused by defective software. Thousands of undocumented incidents occur every day and affect nearly every aspect of our lives.
| Key Point |
A GUI with 10 fields that can be entered in any order results in a set of 3,628,800 combinations that could potentially be tested. |
Most software testing managers and engineers realize that it's impossible to test everything in even the most trivial of systems. The features and attributes of a simple application may result in millions of permutations that could potentially be developed into test cases. Obviously, it's not possible to create millions of test cases; and even if a large number of test cases are created, they generally still represent only a tiny fraction of the possible combinations. Even if you had created thousands of test cases, and through a concerted effort doubled that number, millions of other combinations may still exist and your "doubled" test set would still represent only a tiny fraction of the potential combinations, as illustrated in Figure 2-1. In most cases, "what" you test in a system is much more important than "how much" you test.
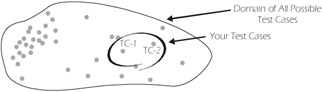
Figure 2-1: Domain of All Possible Test Cases (TC) in a Software System
Tight time schedules and shortages of trained testers serve to exacerbate this problem even further. In many companies, the testers begin work on whatever components or parts of the system they encounter first, or perhaps they work on those parts that they're most familiar with. Unfortunately, both of these approaches typically result in the eventual delivery of a system in which some of the most critical components are untested, inadequately tested, or at the very least, tested later in the lifecycle. Even if problems are found later in the lifecycle, there may be inadequate time to fix them, thereby adding to the risk of the software. Changing priorities, feature creep, and loss of resources can also reduce the ability of the test team to perform a reasonably comprehensive test.
What Is Risk?
| Note |
For more information on Risk Management, refer to the following books: Software Risk Management by Barry W. Boehm Software Engineering Risk Analysis by Robert Charette Risk Management for Software Projects by Down, Coleman, and Absolon IEEE Tutorial on Software Risk Management by Barry Boehm A Manager's Guide to Software Engineering by Roger S. Pressman |
Webster's dictionary defines risk as "the chance of injury, damage, or loss; a dangerous chance; a hazard." In other words, risk involves the probability or likelihood of an event occurring and the negative consequences or impact of that event. For the purposes of this book, we will use the words likelihood and impact as the two components of risk.
Everyone subconsciously performs risk analysis hundreds of times a day. If you were living or working in downtown Manhattan and were late for a meeting, for example, you might decide to take a risk and dash across a busy street. Consciously, you might not even think much about it, but subconsciously, you're probably thinking, "What is the likelihood that I'll be hit by a yellow cab and if I'm hit by the cab, what is the impact (no pun intended)?" Obviously, the impact could be catastrophic to you personally, so you would only dart across the street if you were reasonably confident that you wouldn't be hit by a cab. This is just one example of how risk analysis impacts our daily lives. The good news is that all of these daily decisions that you've made have helped prepare you, as a tester, for analyzing software risk. Still, having said this and after visiting hundreds of companies as management consultants over the years, we've found that very few companies make any attempt at conducting even a semi-formal software risk analysis. A risk analysis is one of the most important activities that can occur on any software development project, especially if schedules are tight and/or resources are scarce.
| Key Point |
Risk Management is the process of controlling risk and monitoring the effectiveness of the control mechanisms. Risk Analysis is the process of identifying, estimating, and evaluating risk. |
There is an entire body of information about and many professionals who specialize in risk management, which is composed of risk analysis, avoidance, and control. However, the primary focus of this chapter is on risk analysis and, to a lesser degree, risk avoidance and control. Even though the risk analysis techniques explained in this book are focused on software testing, they can also be useful tools in other areas of the development project, especially if no other risk analysis has been undertaken. If another group, such as developers or users, has already conducted a risk analysis, you may be able to use their results to help plan and prioritize your tests.
| Key Point |
Risk Analysis can be separated into two key activities:
|
IEEE Standard for Software Test Documentation (IEEE Std. 829-1998) identifies a section in the test plan template called Risks and Contingencies. We've taken this a step further by separating risk analysis into two key activities: software risk analysis and the analysis of planning risks and contingencies.
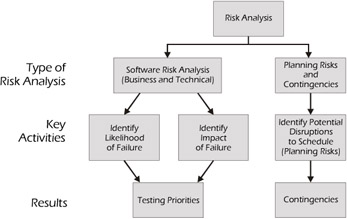
Figure 2-2: Risk Analysis Activities
This separation of activities provides a clear distinction between the risk associated with the failure of a feature or attribute of the system and the risk associated with the implementation of the test plan.
Software Risk Analysis
The purpose of a software risk analysis is to determine what to test, the testing priority, and the depth of testing. In some cases, it may also include determining what not to test. A risk analysis can help testers identify high-risk applications that should be tested more thoroughly, and potentially error-prone components within specific applications that should be tested more rigorously than other components. The results of the risk analysis can be used during the test planning phase to determine the testing priorities for the software under test.
| Key Point |
The purpose of a software risk analysis is to determine what to test, the testing priority, and the depth of testing. |
Who Should Do the Analysis?
You might argue that it would be logical to have the users or customers perform a software risk analysis - and you would be right. Or, you might argue that if the users don't do the risk analysis, the developers should do it - and you would be right again. Developers who are responsible for software maintenance, for example, can derive great benefits from doing a risk analysis. So why did we include this topic in a software testing book? Because users and developers rarely perform a risk analysis or, at least, fail to do one in sufficient detail to help the tester. So even if you think it's not your job, you can't do your job well if a risk analysis isn't done first.
| Key Point |
Ideally, the risk analysis should be done by an interdisciplinary team of experts. |
Ideally, the risk analysis should be done by a team of experts from various groups within the organization. Likely candidates may include developers, testers, users, customers, marketers, and other interested, willing, and able contributors.
When Should It Be Done?
A risk analysis should be done as early as possible in the software lifecycle. A first cut at a risk analysis can usually be done as soon as the high-level requirements are known. The risk analysis doesn't have to be completely re-done for every release, but should be revisited based on the changes that are being implemented. Also, keep in mind that the results of the analysis may have to be reviewed occasionally during the course of a project since the requirements, resources, and other factors may change.
How Should It Be Done?
We have outlined the ten-step process (illustrated in Figure 2-3) that we use for conducting a software risk analysis. Depending on the structure of your organization, you may have encountered one or more variations of this process. Some organizations may combine several steps into one, while others may include additional steps. However, the overall objective remains the same - to determine what to test, the testing priority, and the depth of testing.
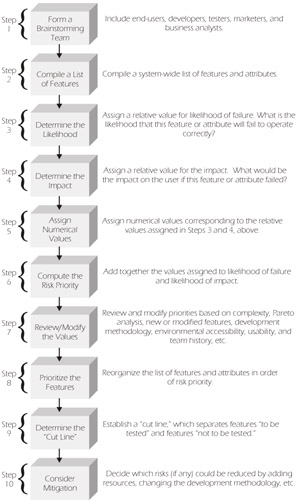
Figure 2-3: Software Risk Analysis Process Overview
| Note |
Each of these steps will be explained in detail on the following pages. |
Step 1: Form a Brainstorming Team
The first step in performing a risk analysis is to form a brainstorming team. Typically, you should include users (or pseudo-users such as business analysts), developers, testers, marketers, customer service representatives, support personnel, and anyone else that has knowledge of the business and/or product, and is willing and able to participate. Too many teams fail because not enough or the wrong people participate.

In their excellent book Exploring Requirements: Quality Before Design, Donald Gause and Gerald Weinberg lay out guidelines for conducting a brainstorming session. We've only included an outline of their suggestions here. For a more complete description, we recommend you obtain a copy of their book.
The purpose of Part One of a brainstorm session is to increase the number of ideas that the group generates. As a general rule of thumb:
- Do not allow criticism or debate.
- Let your imagination soar.
- Shoot for quantity.
- Mutate and combine ideas.
The purpose of Part Two of the brainstorming session is to reduce the list of ideas to a workable size. As a general rule of thumb, the methods for doing this include:
- Voting with campaign speeches
- Blending ideas
- Applying criteria
- Using scoring or ranking systems
The software risk analysis process that we've outlined will take care of Part Two of Gause and Weinberg's guidelines, but we've included them here in case you want to apply brainstorming techniques elsewhere (e.g., inventories: refer to Chapter 5).
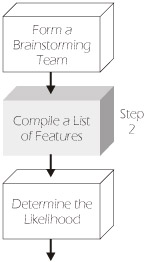
Step 2: Compile a List of Features
The brainstorming team should gather any available documentation such as requirements specifications (if they exist), functional specifications, change requests, defect reports, design documents, etc. Once these documents have been collected, the team should compile an inventory of features (initially at a high level), attributes, or business functions for the entire system. Later, as time allows, the list can be made more complete and detailed. If a given development effort or release is being done on only a subset of the system or on a sub-system, the analysis can be focused just on that area. However, in addition to the included features, all interfaces should be identified and listed because they may also need to be tested.
In our classes, we often use an Automated Teller Machine (ATM) as an example for demonstrating how a risk analysis works, since almost everyone is familiar with ATMs. An ATM application has a variety of features. Some of the features that our students typically identify include withdraw cash, deposit cash, check account balance, transfer funds, purchase stamps, and make a loan payment. In most cases, global attributes are also identified and considered in the risk analysis. Some of these global attributes include accessibility, availability, compatibility, maintainability, performance, reliability, scalability, security, and usability, which are applicable to most systems.
| Key Point |
Examples of attributes to consider may include:
|
Step 3: Determine the Likelihood
The next step in the risk analysis process is to assign an indicator for the relative likelihood of failure. We typically assign H for a relatively high likelihood of failure, M for medium, and L for low. When the brainstorming team assigns a value of H, M, or L for each feature, they should be answering the question, "Based on our current knowledge of the system, what is the likelihood that this feature or attribute will fail or fail to operate correctly?" Usually, the likelihood indicators are caused by systemic characteristics (e.g., complexity, number of interfaces, etc.) of the system, which makes developers and other technically oriented members of the team useful during this part of the risk analysis. For example, most students quickly assign a likelihood value of H for the withdraw cash feature. When asked why, they invariably point out that in order to withdraw cash, the system must go through various software interfaces, software/hardware interfaces, and human activities (load the cash). Other values typically identified for the likelihood of failure of selected ATM features and attributes are listed in Table 2-1.
|
ATM Software |
Likelihood |
|
|---|---|---|
|
Features |
Attributes |
|
|
Withdraw cash |
High |
|
|
Deposit cash |
Medium |
|
|
Check account balance |
Low |
|
|
Transfer funds |
Medium |
|
|
Purchase stamps |
High |
|
|
Make a loan payment |
Low |
|
|
Usability |
Medium |
|
|
Performance |
Low |
|
|
Security |
Medium |
|

| Key Point |
Based on our current knowledge of the system, what is the likelihood that this feature or attribute will fail or fail to operate correctly? |
It's very important that the brainstorming team begin by assigning an initial value for the (relative) likelihood of a failure for each feature or attribute. Even though some team members may not agree on the initial value, it's important to get something committed to paper as soon as possible to stimulate the thought process. It's not important for the team to be precise in their rankings or in total agreement at this point in the risk analysis process. In fact, the entire process up to this point is fairly subjective, based on the experience and knowledge level of each of the team members.
Suppose that four members of your team think that a feature has a high likelihood of failure, one thinks it's medium, and one thinks it's low. You should assign a likelihood of high or medium and move on. It's critical that the team doesn't become bogged down early in the process. Later they'll discover that they're not trying to prioritize every feature 1 through n, but are simply trying to put each feature into a few "buckets" or broad categories. Later, if time allows, the team can go back and modify the first likelihood analysis by using one or more of the likelihood indicators outlined in Step 7.
Step 4: Determine the Impact
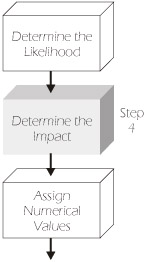
Once again the brainstorming team should use the same high, medium, and low rating system that they used for the likelihood of failure. Here, the team should ask themselves the question, "What would be the impact on the user if this feature or attribute failed to operate correctly?" Our students typically assign a value of H for withdraw cash, since most users of ATMs would consider the apparatus worthless without this feature. The impact of failure for other features and attributes in our ATM example is highlighted in Table 2-2. Although you may be tempted to also consider the impact of a failed function on the development of the rest of the system (i.e., the critical path) at this point, you should resist doing this as part of the software risk analysis. You should focus only on the features and attributes that directly impact the user, not necessarily the testing effort. Concerns regarding the impact on the testing schedule will be addressed in a later section of this chapter, Planning Risks and Contingencies.
|
ATM Software |
Likelihood |
Impact |
|
|---|---|---|---|
|
Features |
Attributes |
||
|
Withdraw cash |
High |
High |
|
|
Deposit cash |
Medium |
High |
|
|
Check account balance |
Low |
Medium |
|
|
Transfer funds |
Medium |
Medium |
|
|
Purchase stamps |
High |
Low |
|
|
Make a loan payment |
Low |
Medium |
|
|
Usability |
Medium |
High |
|
|
Performance |
Low |
Medium |
|
|
Security |
Medium |
High |
|
| Key Point |
What would be the impact on the user if this feature or attribute failed to operate correctly? |
The users are particularly important for this part of the risk analysis because the impact is usually driven by business issues rather than by the systemic nature of the system. One word of caution: many users will insist that every feature has a high failure impact. This is especially true if the system is large enough that you need several users who each possess different areas of expertise. Obviously, it doesn't help in prioritizing risks if virtually every feature is ranked the same (i.e., high). If you experience this phenomenon, you might want to limit each user to assigning a specific number of Hs, Ms, and Ls.
| Key Point |
The users are particularly important in assigning values for impact, since the impact is usually driven by business issues rather than by the systemic nature of the system. |
Testers who have worked in the industry for a substantial amount of time are often very good at determining the impact of failures. In fact, we have found that at many companies, experienced testers have the broadest knowledge of how the systems relate to the business. Especially in larger systems, many users may only be experts in one particular area of functionality, while experienced testers often have a much broader view. It is this broad view that is most useful in determining the relative impact of failure.
Step 5: Assign Numerical Values
In this step of the risk analysis, the brainstorming team should assign numerical values for H, M, and L for both likelihood and impact. While these values can be any sequence of descending numbers, for the sake of simplicity, we usually assign a value of 3 for H, 2 for M, and 1 for L. Some people like to get a greater "spread" by assigning 10 for H, 3 for M, and 1 for L, or various other schemes. Weighting scales will vary from organization to organization depending on how they perceive the relative risk. Once a scale has been selected, you must use that same scale throughout the entire risk analysis.

If your system is safety-critical (i.e., people's lives may be endangered by the malfunction of the system), it's important that those features that can cause death or loss of limb are always assigned a high priority. You can accomplish this in a variety of ways such as "flagging" those safety-critical features or by assigning a special high value to their impact. Suppose, for example, that you were working on a nuclear control system and there was a function called the "nuclear shut-off switch." In reality, this switch probably doesn't exist, but hopefully you get the idea that this would be a very risky function indeed! You would always want to ensure that this function was given a high priority even if the overall risk was low due to an exceptionally low likelihood of failure.
| Key Point |
If your system is safety-critical, it's important that those features that can cause death or loss of limb are always assigned a high priority for test even if the overall risk was low due to an exceptionally low likelihood of failure. |
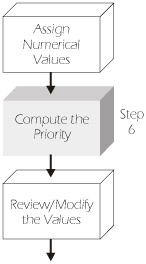
Step 6: Compute the Risk Priority
Next, the values assigned to the likelihood of failure and the impact of failure should be added together. If a value of 3 is used for H, 2 for M, and 1 for L, then five risk priority levels are possible (i.e., 6, 5, 4, 3, 2) as illustrated in Figure 2-4. The overall risk priority is a relative value for the potential impact of failure of a feature or attribute of the software weighted by the likelihood of it failing.
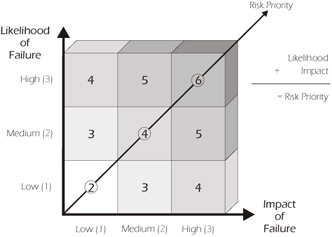
Figure 2-4: Risk Priority
Notice that the feature withdraw cash, which has a relatively high likelihood of failure (value 3) and a relatively high impact of failure (value 3), has a risk priority of 6 (i.e., 3+3=6) in Table 2-3. The deposit cash feature has a priority of 5, and so forth. This isn't the only possible method for determining risk priority, however. Even though we prefer to add the values for likelihood of failure and impact of failure together, some organizations choose to multiply these values together, which has the effect of amplifying the risky areas.
|
ATM Software |
Likelihood |
Impact |
Priority |
|
|---|---|---|---|---|
|
Features |
Attributes |
|||
|
Withdraw cash |
High |
High |
6 |
|
|
Deposit cash |
Medium |
High |
5 |
|
|
Check account balance |
Low |
Medium |
3 |
|
|
Transfer funds |
Medium |
Medium |
4 |
|
|
Purchase stamps |
High |
Low |
4 |
|
|
Make a loan payment |
Low |
Medium |
3 |
|
|
Usability |
Medium |
High |
5 |
|
|
Performance |
Low |
Medium |
3 |
|
|
Security |
Medium |
High |
5 |
|
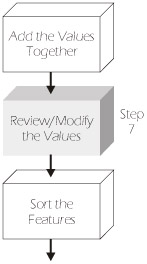
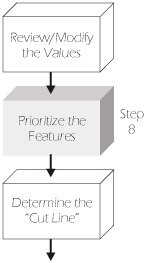
Step 7: Review/Modify the Values
In Step 3 of the risk analysis process, a value was assigned to the likelihood of failure for each feature or attribute based upon the experience and perception of the brainstorming team. After the team has initially reached a consensus on the likelihood of failure for each feature or attribute based upon their brainstorming session, it's possible that these values may be modified based on additional information or analyses that may be available. Some examples of likelihood-of-failure indicators include team history, complexity, usability, new or modified features, features developed using new technology, defect history, and those features that are difficult to test due to constraints in the (test) environment.
| Team History |
Experience of the developers can affect testing priorities. |
For example, most of us know that certain developers or development teams produce better code than others. If you have knowledge about the relative skill or experience of the teams developing the system, it might be prudent to plan to test the code of the less experienced teams more than the code developed by the more experienced teams. So, if a new team is assigned to work on the check account balance feature, for example, the brainstorming team may agree to raise the initial "low" likelihood rating of that feature (refer to Table 2-3) to medium or even high. This, of course, will eventually have the effect of raising the risk priority of that feature.
A word of caution is needed here. Although understanding the relative skill or effectiveness of various development teams would be useful in planning the testing priorities, collecting metrics about the relative effectiveness of developers or teams can bring unwanted political problems to the table and can ultimately undermine your relationship with the developers. Developers (like testers, or anyone else for that matter) don't like to feel that they are being measured. So your best intentions may do more harm than good. Since we have no knowledge of the culture of your organization, we offer no advice here, but if you choose to collect metrics about individual or team efficiency, please proceed cautiously.
| Complexity |
This is one of the most commonly used likelihood-of-failure indicators. |
Another indicator of the likelihood of failure is the relative complexity of the components or features of the system. Tom McCabe, who has done a substantial amount of work on software complexity, has devised a metric known as cyclomatic complexity that is based on the number of decisions in a program. He, along with others, has shown that those parts of the system with high cyclomatic complexity are more prone to defects than those with a lower value. For our purposes, we would assign those features a higher likelihood of failure. Tools are available to assist in this analysis. Of course if the system has not yet been coded, complexity cannot be measured because there's nothing yet to measure.
| Key Point |
|
Some organizations use the complexity measures as the sole input into the assignment of the likelihood value (probably because it's fairly simple to do). We recommend that you assign the initial value during the brainstorming session and use the complexity analysis as a way to modify these initial values.
Increasing the "user-friendliness" of a system (or part of a system) generally increases the complexity of the software and ultimately increases the likelihood of failure. This problem is amplified because it may also be difficult to replicate the end-user environment or even know who the end-user is. One of the problems with the statement "The user is always right" is defining "Who is the user?" Companies that make and sell commercial software dedicate a lot of resources, thought, and money to this issue. All users aren't the same and they have different needs. Some users want to have a powerful system devoid of annoying prompts such as "Do you really want to delete this file?" Other users are a little more timid and, after deleting their newly written version of War and Peace, would welcome a question that requires confirmation.
| Usability |
Increasing the "user-friendliness" of a system can increase the complexity of the software. |
Usability labs attempt to simulate these users' requirements and the conditions under which they'll be using a particular feature of the system. If you have a usability lab, it can be useful for determining those features that have a high likelihood of failure due to the user-friendliness of the system. Refer to Chapter 4 for more information on usability labs.
| New or Modified Features |
This is one of the most commonly used likelihood-of-failure indicators. |
Parts of the system that are new (e.g., enhancements) or those modules that have experienced changes are usually more prone to defects than those modules that remain unchanged. Ironically, features that have had just a one- or two-line code change often have a higher rate of error introduction per line changed than modules with more extensive changes (probably because they have less rigorous regression testing). You would have to analyze your own defects versus changed lines of code in order to determine if this is true on your software. A useful metric is the number of bugs introduced per fix or the number of bugs introduced per changed line of code, as shown in Figure 2-5.
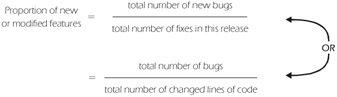
Figure 2-5: Formulae for Measuring the Ratio of Bugs to Fixes
This is often used as a measure of the effectiveness of maintenance programming.
Unfortunately, fixing problems may not necessarily make your software more reliable. On the contrary, serious new problems may arise. According to an article by Alan Joch, after changing three lines of code in a signaling program containing millions of lines of code in 1991, the local telephone systems in California and along the Eastern seaboard came to a halt. One company that we visited learned that they had introduced more bugs (and in some cases with greater severity) than they had fixed in a project for three releases in a row! It seems that more than just their software was broken.
In the course of conducting project reviews at many companies, we've frequently encountered the situation where certain functions or features were written (or rewritten) using some new or unfamiliar technology. For example, the organization may have gone from COBOL to C++, introduced object-oriented design techniques, developed a new database structure, or introduced a new development/testing methodology such as Extreme Programming. Obviously, as testers we are concerned about these changes and want to focus additional testing on those affected features (i.e., raise the likelihood value). This is especially true if the change was sudden or not supported by adequate training.
| Key Point |
Features developed using new technology, methods, techniques, or languages may require extra testing. |
As an aside, we have also noted that many companies introduce multiple technology changes on the same project at the same time (often due to a new VP or CIO coming onboard). If this is the case, the tester should beware! Conventional wisdom for implementing change is to limit the number of new processes introduced on a given project. Refer to Chapter 11 for more information on process improvement.
In some systems, it's difficult to replicate the production environment in the laboratory, which can increase the software risk for certain features or attributes, or for the entire project. For example, it may be difficult to replicate the loads experienced on a Web application or have as many clients as would normally operate in a client/server environment. It's probably not feasible to launch the space shuttle just to test some new code. Similarly, if you were working on a weather prediction system, you couldn't just conjure up a hurricane to assist you in the testing effort.
| Environmental Accessibility |
The realism of the test environment may affect testing priorities. |
Those features that are difficult to test due to environmental accessibility have a higher likelihood of failure and should receive a higher priority for testing to allow for the additional time that may be required to create simulators, conduct beta testing, etc. These features are also candidates for mitigation (refer to Step 10 of the Risk Analysis Process).
| Pareto Principle (80-20 Rule) |
According to Software Risk Management by Barry W. Boehm, "Many software phenomena follow a Pareto distribution: 80% of the contribution comes from 20% of the contributors." One example: 20% of the modules contribute 80% of the errors (not necessarily the same ones). |
One type of analysis that we strongly recommend is the analysis of the trends and patterns of defects. If defects from previous releases or earlier levels of test and/or inspections are documented, they can be analyzed to determine particular areas of the system that have a "clumping" of bugs. Testers routinely call this type of analysis a "Pareto analysis," although it may not rigorously meet the definition assigned by statisticians. Anyone who has ever been a maintenance programmer knows that they are repeatedly called in to fix the same feature or module. In almost every case, areas of a system that have proven to be buggy in the past, will very likely continue to be buggy in the future and should be assigned a higher likelihood of failure. This clumping of bugs often occurs because certain parts of the system may be unusually complex, or written from a poor specification, etc.
There are many factors that affect the likelihood of failure such as usability, new features, complexity, etc., and many people would like to choose one of these as the sole method of determining likelihood of failure. However, the preferable approach is to allow the brainstorming team to assign these values as described in Step 4 and then use these other techniques, like complexity, to validate or modify their choices. For example, if your brainstorming team has found that the withdraw cash feature has a low (L) likelihood of failure, but the developer tells you that the underlying code has a very high complexity, you might want to change the "L" to an "M" or even an "H." Similarly, you can apply the same logic using Pareto analysis, inventory of changes, or one of the other likelihood-of-failure indicators.
Step 8: Prioritize the Features
In this step of the risk analysis process, the brainstorming team should reorganize their list of features and attributes in order of risk priority. Table 2-4 shows the features and attributes of an ATM application in order of risk priority. Since the withdraw cash feature has the highest risk priority, it appears first in the list. Although the impact of releasing the software with poor performance is medium, the likelihood of failure is low. Consequently, performance is assigned a relatively low risk priority of 3 and therefore appears last in the list. Consider entering the risk data into a software tool that is "sort-friendly" to assist in the prioritization.
|
ATM Software |
Likelihood |
Impact |
Priority |
|
|---|---|---|---|---|
|
Features |
Attributes |
|||
|
Withdraw cash |
High |
High |
6 |
|
|
Deposit cash |
Medium |
High |
5 |
|
|
Usability |
Medium |
High |
5 |
|
|
Security |
Medium |
High |
5 |
|
|
Transfer funds |
Medium |
Medium |
4 |
|
|
Purchase stamps |
High |
Low |
4 |
|
|
Make a loan payment |
Low |
Medium |
3 |
|
|
Check account balance |
Low |
Medium |
3 |
|
|
Performance |
Low |
Medium |
3 |
|
The sorted list of priorities provides a clear view of which risks need the most attention. As you may have noticed, one deficiency of this technique for prioritization is that it doesn't take into account the testing dependencies. For example, even though the check account balance value is assigned a relatively low priority, it will very likely be tested early on since the system must check the account value prior to withdrawing cash. We urge you to ignore these dependencies until after the first draft of the software risk analysis is complete.
| Key Point |
The sorted list of priorities provides a clear view of which risks need the most attention. |
Step 9: Determine the "Cut Line"
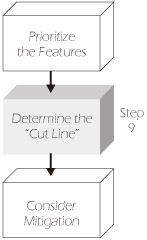
After the priorities have been sorted, a "cut line" may be established to indicate the line below which features will not be tested (if any) or tested less. In order to determine where the cut line should go, it's necessary to estimate the amount of testing that is possible with the available time and resources. Refer to Chapter 7 for more information on estimating time and resources. The dotted line in Table 2-5 represents the cut line that the brainstorming team established for the ATM project. The check account balance feature and the make a loan payment feature will not be tested on this release due to the relatively low risk and limited availability of time and resources.
|
ATM Software |
Likelihood |
Impact |
Priority |
||
|---|---|---|---|---|---|
|
Features |
Attributes |
||||
|
Withdraw cash |
High |
High |
6 |
To Be Tested |
|
|
Deposit cash |
Medium |
High |
5 |
||
|
Usability |
Medium |
High |
5 |
||
|
Transfer funds |
Medium |
Medium |
4 |
||
|
Purchase stamps |
High |
Low |
4 |
||
|
|
Security |
Low |
High |
4 |
|
|
Make a loan payment |
Low |
Medium |
3 |
Not to Be Tested (or tested less) |
|
|
Check account balance |
Low |
Medium |
3 |
||
|
Performance |
Low |
Medium |
3 |
||

Of course, as time goes by and estimates are "honed," the cut line may have to be moved up or down (or the amount of testing of lower-risk features or attributes may be reduced). If the system is very risky and it's unacceptable to have features go untested, additional time and/or resources must be allocated. Wishful thinking doesn't work here. An important job of the test manager is to present the information and decide what can and can't be done with the resources that are available. The software risk analysis is a wonderful tool to use with upper management to gain buy-in for schedules, budgets, and allocation of resources.
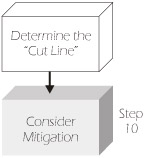
Step 10: Consider Mitigation
Some companies like to add a column to their software risk analysis called mitigation. If the withdraw cash feature is rated a 6 (i.e., high likelihood and high impact) the test or development group may decide to consider a way to lower or mitigate the risk. For example, the mitigation might be that all of the code and design associated with the withdraw cash feature will undergo rigorous code and design inspections. Or, maybe a prototype of the deposit cash feature will be built early in order to allow users to provide early feedback on the usability of this feature. This may be accomplished with a "paper" prototype or by using a more formal prototype in a usability lab. Another mitigation might be to add an extra layer of test such as beta testing (refer to Chapter 4). Table 2-6 includes a column for mitigated priorities. Notice that only the withdraw cash feature, deposit funds feature, and usability attribute were mitigated for this particular project. Some projects may warrant the inclusion of a mitigation column, while others don't - the choice is yours and may vary depending on the project. Notice that the mitigation activities may require action by developers, users, testers, or others, which is another reason why the risk analysis team should include people from these groups. Whether implicitly or explicitly, you should somehow account for mitigation during the creation of your test plan.
|
ATM Software |
Likelihood |
Impact |
Priority |
Mitigation |
|
|---|---|---|---|---|---|
|
Features |
Attributes |
||||
|
Withdraw cash |
High |
High |
6 |
Code inspection |
|
|
Deposit cash |
Medium |
High |
5 |
Early prototype |
|
|
Usability |
Medium |
High |
5 |
Early user feedback |
|
|
Security |
Medium |
High |
5 |
||
|
Transfer funds |
Medium |
Medium |
4 |
||
|
Purchase stamps |
High |
Low |
4 |
||
|
Make a loan payment |
Low |
Medium |
3 |
||
|
Check account balance |
Low |
Medium |
3 |
||
|
Performance |
Low |
Medium |
3 |
||
| Key Point |
Risk mitigation helps reduce the likelihood of a failure, but does not affect the impact. |
At this point, you should have completed the first draft of your software risk analysis. This means that you've already accomplished something that most test groups fail to do. The software risk analysis will have to be revisited occasionally in order to update it as changes in requirements, scope, design, schedule, and other factors occur. When you move to the next version of software, you can use the current risk analysis as the basis for the new analysis. Without a doubt, you'll find that on subsequent releases the risk will naturally be higher for those components undergoing change. Although this isn't a hard and fast rule, subsequent revisions to support new releases often require greater changes to the likelihood column than the impact column unless major functionality changes have been introduced.
Planning Risks and Contingencies
Now, let's go on the other side of risk management and take a look at planning risks, which are unscheduled events or late activities that occur which may jeopardize the testing schedule. The purpose of this risk analysis is to determine the best contingencies in the event that one of the planning risks occurs. This is important because the scope and nature of a project almost always change as the project progresses. Most test managers find that during the planning phases, the users and developers are much more likely to sit down and make rational decisions on what to do if one of the planning risks occurs. If the decision is made in "the heat of battle" near the end of the project, emotions and politics are much more likely to be the primary drivers of the decision-making process.
| Key Point |
Planning risks are unscheduled events or late activities that may jeopardize the testing schedule. Some common planning risks include:
|
Most of us have taken part in projects where the schedule is at best ambitious and at worst impossible. Once an implementation date has been set, it's often considered sacred. Customers may have been promised a product on a certain date, management's credibility is on the line, corporate reputation is at stake, or competitors may be breathing down your neck. At the same time, as an organization, you may have stretched your resources to the limit. Planning risks are anything that adversely affects the planned testing effort. Perhaps the start of the project is slightly delayed, or a major software vendor releases a new version of the operating system that the application will run on. It's not our purpose here to address the many reasons why we so often find ourselves in this unenviable spot. Rather, we would like to talk about what can be done about it. Case Study 2-1 describes a common scenario in many organizations along with some possible contingencies.
Case Study 2-1: Suppose Jane Doe resigned and your ambitious schedule suddenly became impossible. What would you do?
The Deliverable Is the Date
Consider the following scenario. Your VP has promised the next release of your product on a certain date. The date seems very aggressive to you in light of the available resources and the need to release a high-quality product (after the last release failed spectacularly). Then, the unthinkable happens. Jane Doe takes a job with your competitor, leaving a huge gap in your company's knowledge base (or a key component is late, or the requirements change, or some other planning risk occurs). What was once an ambitious schedule now appears to be impossible. What are your choices or contingencies?
- Alter the schedule í which marketing says can't be done...
- Reduce the scope í but we promised our customers...
- Reduce quality, which usually means reduce testing or allow more defects in the final product í but our last release failed!!!
- Add resources (including overtime) í but there are none to add and everyone is already working around the clock...
- Punt...
Unfortunately, all of the choices listed above seem bad and, all too often, management decides that they're all unacceptable. If management does not make proactive decisions during the planning stage, the technical staff will often end up making the choices by default. Initially, more resources may be added in the form of overtime. If this doesn't solve the problem, the team will begin to take shortcuts -- eliminating a document here, a review there, or eliminating an entire set of tests. Of course, the quality suffers.
If the project is still in jeopardy, functionality that is not absolutely essential will be rescheduled for a later release or the date may be slipped. Eventually, the new target date may be met when a watered-down system of poor quality is delivered to the customer late, by a very frustrated development team. Sound familiar?
Identifying planning risks and contingencies helps you make intelligent, informed decisions. Almost every project team can identify the planning risks that cause concern: late requirements, test environment problems, late delivery of software, etc. Our goal is to decide in advance what to do if one of these planning risks comes true. In our opinion, the only possible contingencies that exist are:
- reduce the scope
- delay implementation
- add resources
- reduce quality processes
| Key Point |
The major focus of the section Planning Risks and Contingencies in the IEEE Standard 829-1998 is on planning risks (as opposed to software risks). Although not universally used, planning risks and contingencies are more commonly used than software risk analysis. |
However, you may encounter many different "flavors" of these four contingencies, depending on your organization and the details of the project. For example, "add resources" might mean overtime for the prime staff or it could mean bringing in additional testers. Case Study 2-2 lists some examples of planning risks and contingencies.
Case Study 2-2: Sample Planning Risk and Contingencies
Sample Planning Risk
The user introduces a major requirements change late in the software lifecycle.
Sample Contingency #1
Ask the user group to contribute more users to the testing effort (i.e., add more resources).
Sample Contingency #2
Decide not to implement a low-priority feature until a later release (e.g., reduce the scope).
Sample Contingency #3
Decide not to test (or at least to test less) some of the low-risk features identified in the course of the software risk analysis (i.e., reduce quality processes).
Case Study 2-3: Sample Planning Risk and Contingencies
Sample Planning Risk
The size of the project keeps growing í this is a double whammy. Not only do testing resources need to grow because of the increased size of the project, but productivity rates for software development and testing typically decrease as the size of the project increases.
Sample Contingency #1
Add resources (e.g., outsource, add users, add developers, authorize overtime).
Sample Contingency #2
Reduce the scope of the project. Choose a strategy of incremental delivery to the customer.
Sample Contingency #3
Reduce testing of some of the lower-risk modules (i.e., reduce quality processes).
Sample Contingency #4
Delay implementation.
As you can see, all of the contingencies in Case Studies 2-2 and 2-3 involve compromise. But without planning risks and contingencies, the developers and testers are forced to make these choices on the fly. The software risk analysis and the analysis of the planning risks and contingencies work together. Recall our Automated Teller Machine (ATM) example from the previous section. The risk analysis process helped us identify the software risks, which, in turn, helped us focus and prioritize our testing effort in order to reduce those risks.
The planning risks help us to do the "What if…" and develop contingencies. For example, what if Jane Doe really does leave and her departure causes the software to be delivered to the test group late? One of the contingencies was to reduce quality (this usually means less testing). If this contingency befalls us, we would probably want to go back to the software risk analysis and consider reducing the testing of the least critical components (i.e., moving the cut line up). Refer to Step 9 of the Software Risk Process for information on the cut line.
It should be apparent at this point that planning risks, software risks, features/attributes to be tested, features/attributes not to be tested, and indeed the entire testing strategy are built around the concept of using risk to prioritize the testing effort.
Project Assumptions
Some project plans and even some test plans have a section called Assumptions. In many cases, these assumptions will become planning risks if they turn out to be false. Suppose, for example, management assumes that the very experienced Team X will be developing the transfer funds feature for your ATM software. If this feature is outsourced to another company with an unknown track record instead, the likelihood of failure may increase or decrease, depending on the skills of this outside resource. Consider the following as another example. If you assume there will be 10 testers, but in reality there are only 5 available, this is a planning risk even though it may have been originally recorded as an assumption.
While there are many different ways to perform a risk analysis, this chapter has identified two distinct types of risk analysis that have worked well for our clients, students, and colleagues over the years. Software risk analysis helps you decide what features and attributes should be tested and helps you assign priorities to these items. Planning risk analysis helps you decide what to do in the event that an unplanned problem arises. Effective risk analysis is a joint effort of developers, testers, subject-matter experts, marketers, and other willing and able participants. Unfortunately, in many companies, risk analysis is not done in any formal sense. After reading this chapter, we hope that you'll have a clear understanding of how to perform or improve risk analysis within your organization and understand its benefits to you and your organization.
| Key Point |
Planning risk analysis helps you decide what to do in the event that an unplanned problem arises. |
Preface
- An Overview of the Testing Process
- Risk Analysis
- Master Test Planning
- Detailed Test Planning
- Analysis and Design
- Test Implementation
- Test Execution
- The Test Organization
- The Software Tester
- The Test Manager
- Improving the Testing Process
- Some Final Thoughts…
- Appendix A Glossary of Terms
- Appendix B Testing Survey
- Appendix C IEEE Templates
- Appendix D Sample Master Test Plan
- Appendix E Simplified Unit Test Plan
- Appendix F Process Diagrams
EAN: 2147483647
Pages: 114
