Data Correlation
Overview
This chapter covers another very important issue—correlating attack-related data. So far we’ve covered intrusion detection and intrusion prevention as it is normally performed. Intrusion-detection analysts and intrusion-prevention systems check the output of network- and host-based intrusion-detection tools, they evaluate system audit and firewall logs, they analyze the data from packet-capturing tools, and so on, making decisions concerning not only what has actually occurred, but also about the degree of threat that various attacks pose. Analyzing output in this manner is almost invariably worthwhile, yet many organizations need more—they need to put the data into a larger context. As the saying goes, the whole is greater than the sum of the parts.
Increasingly, data about attacks and potential attacks are being subjected to a greater degree of analysis than simply being summarily inspected. It is, for example, increasingly commonplace to have all such data gleaned from sensors and host-based intrusion-detection or intrusion-prevention tools transferred to a central repository where all these data can be accessed by logging into a single host. This not only results in more convenient access to data, but it also increases the likelihood that relationships between data are discovered. An analyst may find that a particular apparent IP source address has scanned several hundred hosts within a particular network. The analyst may initially not pay much attention to the fact that these hosts have been scanned; after all, unauthorized vulnerability scanning is (lamentably) common. Perhaps automatic mechanisms will also shun the particular IP address in question. But consider the potential implications if the analyst soon afterward discovers that the same IP address has also launched what appears to be a successful attack against a firewall in another network belonging to the same organization. The combination of events, vulnerability scans targeting the organization’s IP address space, and a possible compromise of a device designed to provide perimeter security, all from the same apparent IP source address, should now prompt urgent intervention, perhaps in terms of blocking all inbound traffic from that IP address at all external gateways to that organization’s networks. And although they are still not widely available, databases that integrate in-band data (data captured by monitoring and intrusion- detection tools) and out-of-band data (data not related to monitoring and intrusion-detection tools, but rather consisting of results of background investigations, arrest histories, and so forth) are starting to be more widely used in intrusion detection, especially by military and law enforcement agencies.
In this chapter, we’ll look at how analysts generally correlate the attack data they obtain and then move on to advanced data fusion and correlation methods. Following that, we’ll look at statistical correlation, Baysian inference, and real-time versus after-the-fact correlation. Finally we’ll look at a real-life case study.
The Basics of Data Correlation
It is easy to get data correlation confused with other, somewhat similar terms. We’ll start by defining and comparing data correlation, data aggregation, and event reconstruction.
Data Correlation Definitions
Data correlation means associating sets of events detected through various means and applying knowledge to determine whether they are related, and if so, in what manner and to what degree. This kind of correlation requires comparing observations based on different types of parameters, such as source and destination IP addresses, an identifiable network route, commands entered by a suspected attacker, and the time when activity began or ended. Data sources can be intrusion-detection sensors, logs, databases (such as threat databases), and so forth, as shown in Table 12-1.
|
Type of Data Source |
Major Advantages |
Major Disadvantages |
|---|---|---|
|
System logging |
Indicates what actually happened on targeted system |
Can be tampered with or turned off altogether; differences in formats can be confusing |
|
Firewall logging |
Generally provides a complete picture of inbound and outbound traffic at the point in the network where the firewall is placed |
Overwhelming volume of data; differences in formats can be confusing; limitation in dealing with encrypted traffic; packet fragment reassembly issues |
|
Packet dumps |
Provides a detailed analysis of traffic going over the network |
Overwhelming volume of data (unless dumps are for short time periods); analysis is tedious |
|
Network-monitoring tool output |
Can provide easy-to-comprehend picture of the state of the network; particularly valuable in spotting denial-of-service attacks |
Financial expense (because most of these tools are commercial) |
|
Target-monitoring output |
Target-monitoring tools run in the background; changes in files and directories are often indications of attacks |
False alarms; financial expense of commercial versions of tools |
|
SNMP traps |
Easy to set up and administer; provides remote near-real-time alerting; usefulness of certain kinds of traps (failed logins) |
Many versions of SNMP are riddled with vulnerabilities; can flood network |
|
IDS output |
Usually reasonably convenient to access, and easy to understand |
Quality of output (hit rate, false-alarm rate) varies considerably from one IDS to another; limitation in dealing with encrypted traffic; limited throughput rate (in many IDSs) |
|
Databases containing data about attacks |
Can provide considerable amount of relevant data; allows data mining |
Financial cost of setting up and maintaining database; privacy issues |
|
Web postings |
Search engines can make a wide range of information about incidents available; attackers who evade intrusion detection may reveal information about their attacks on the web |
The accuracy and validity of information posted on the web, especially information concerning attacks, is at face value dubious—false information abounds |
The knowledge that is needed to correlate the events includes knowledge possessed by analysts as well as information in databases and other data repositories. Data correlation, at least to some degree, occurs implicitly whenever humans are involved in intrusion detection. Those who analyze intrusion-detection data develop new knowledge about types and sources of attacks, and they apply this knowledge as new events occur. For example, an analyst might recognize that an attacker is repeatedly attempting to exploit a vulnerability in the traceroute utility in Linux systems to obtain a root shell. This person might also notice that a large amount of this activity appears to originate from a limited number of Internet addresses, all of which end in .nl. The analyst has, at least to some degree, already correlated intrusion-detection data (although the sophistication of the correlation is fairly crude) and is certain to continue to do so as events unfold in time. The working hypothesis that a group of individuals from the Netherlands is attacking Linux systems in an attempt to exploit a vulnerability in traceroute is the byproduct of the analyst having correlated several observations.
Data correlation is not the same as data aggregation. Data aggregation refers to the process of acquiring more and more data. Amassing as much data as possible is normally prerequisite to performing effective data correlation. Data correlation is, however, for all practical purposes synonymous with the concept of data fusion, a term used frequently (but not exclusively) in military circles to describe the correlation of data in time (and space, if necessary) and the assignment of importance weights to the output. The output of IDSs and possibly IPSs designed to fuse data can include identification about one or more individuals believed to have perpetrated attacks, where the attacks originated, the nature of the attacks, the frequency with which the attacks occurred, the degree of impact (including damage), and many other variables.
Data correlation is also not equivalent to event reconstruction. Event reconstruction means piecing data together to determine exactly what event or events occurred in what order (or perhaps even at what precise time). The most basic type of event reconstruction in intrusion detection and prevention is reconstruction of session data, in which data from session packets are gleaned to determine all the particular commands entered and data transmitted from the start to the end of the session. Tools such as NetIntercept by Sandstorm (www.sandstorm.com) are built to provide event reconstruction by reassembling packets into streams. Provided that a special ssh client that enables NetIntercept to obtain private keys is running on hosts for which event reconstruction is desired, this tool is even capable of decrypting SSH sessions to allow you to read session content.
The Value of Data Correlation
From a practical point of view, data correlation is potentially valuable in several respects. First, it can validate data. To some degree, all data acquired from intrusion-detection tools and other sources should initially be viewed with a healthy degree of suspicion, anyway. Having an additional source of information about a particular event or parameter in a packet is particularly useful when considerable uncertainty concerning the origin, accuracy, scope, and so forth, of data exists. The validity of all source IP addresses in a conventional IPv4 packet is, for example, always initially questionable, given the widespread availability of tools that launch IP spoofing and similar kinds of masquerading attacks. (Fortunately, the IPSec protocol offers an Authentication Header (AH), providing what amounts to “sealed contents” of IP packet headers. If anyone tampers with any value, such as the source IP address, the computed cryptochecksum or hash value does not agree with the sealed value, causing the receiving host to drop the packet.) Comparing the origin time of a particular packet, however, with entries such as process-accounting log entries in Unix systems, which list commands entered by users, the time, the amount of CPU utilization, and more, can facilitate verifying whether the packet actually originated from the machine in question.
Second, data correlation can aid in determining the origin, magnitude, and degree of threat of an incident or suspected incident. In the same way that a detective pieces together evidence at the scene of a crime, correlation of intrusion-detection data can lead to a thorough understanding of an incident and its impact. This understanding helps in identifying and deploying optimal response strategies that contain damage and ultimately eradicate the cause of an incident.
A few currently available tools such as TruThreat Risk Correlation (www.arcsight .com) perform not only data aggregation, but also event correlation for risk assessment. TruThreat Risk Correlation, for example, collects security-related events from a variety of sources (including IDSs and firewalls) and then correlates them with other data, such as the results of vulnerability scans. Correlation of all these data produces a risk index figure that helps guide intervention efforts. Using one or more of this class of tools can make the potentially overwhelming task of integrating data from a variety of sources much more manageable.
Unfortunately, tools of this nature are currently not widely used. At a bare minimum, though, it is important to avoid relying on the output of a single sensor or intrusion-detection tool. A combination of public domain and commercial signature-based and anomaly-detection tools, such as Snort (www.snort.org) and Symantec’s ManHunt (http:// enterprisesecurity.symantec.com/content/productlink.cfm), with a high-end packet- capture program (such as tcpdump or windump) or device is highly desirable. Note that some intrusion-detection tools (such as NetIntercept from Sandstorm) not only provide output indicating that certain events of interest have occurred, but also allow inspection of individual packet data, thereby precluding the need for a separate packet-capturing program or device. Being able to reconstruct entire events is critical. Something about the output of sensor or audit-log data may suggest a deeper level of analysis is needed, analysis that helps confirm or refute whether incidents have occurred. Sensor output and audit logs thus really provide only an initial glimpse of events that may have transpired.
In intrusion prevention, data correlation deployed at the sensor provides a level of accuracy for prevention decisions that does not exist with signature-based approaches. Correlating sequences of events within the context of an application’s behavior greatly reduces the potential for false positives. When an application starts logging keystrokes, for example, a signature-based tool typically generates an alert that keystrokes are being captured. However, Instant Messenger, a debugger, or a pcAnywhere–type of application that captures keystrokes may be running—an event not necessarily indicative of a security breach. (Note, though, that if an unapproved application is logging keystrokes and sending them to other hosts on the Internet, the implications are entirely different.)
Intrusion-prevention correlation within a central server enables security to be more adaptive. By correlating the events on distributed agents, intrusion-prevention policies can be dynamically updated to prevent propagation of malicious code, thus preventing widespread damage to numerous resources as well as allowing deeper insight into the nature of distributed attacks, such as distributed port scans and distributed denial- of-service attacks. An example is an intrusion-prevention tool, Cyber-Defender (www .cyber-defender.com), which runs on individual hosts. If it cannot recognize the behavior of a program that tries to run on a host, it initiates a transfer of this program to the Cyber-Defender Alert Server, which performs analysis and correlation on the program based on changes to files, network activity, and the Registry of Windows systems. If the threat level associated with the suspicious program is high, the Cyber-Defender Alert Server updates a threat pattern file and then sends it to clients.
Advanced Approaches to DataCorrelationandFusion
Although most data correlation performed by analysts is currently rather ad hoc, more advanced ways of dealing with data correlation exist. Identifying features in raw data that match a template is one of the potentially most useful of these ways.
A template is nothing more than a particular pattern used in pattern recognition. A template could, for example, be a characteristic pattern of attack by an individual attacker or group, or a set of IP addresses in a certain order, representing the trail or path used by one or more attackers who leapfrog from system to system to make attacks more difficult to trace. Rudimentary forms of templating are, in fact, already being used in leading edge IDSs. Other systems incorporate rule-based knowledge systems or use neural networks to perform data fusion or correlation.
Data Fusion
Tim Bass, a leading thinker in the area of intrusion-detection data correlation and fusion, views data correlation in terms of different levels of abstraction (see Figure 12-1).
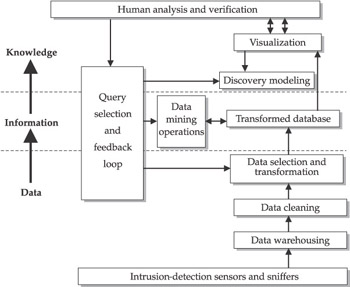
Figure 12-1: Bass’ depiction of intrusion-detection data fusion
The lowest form of abstraction, level-zero refinement, is raw data collected from devices such as packet-capture tools. These data include variables such as indicated IP source and destination addresses, timestamps, time-to-live values, and other low-level data. These data are neither validated nor put in a common framework by which they can be compared and analyzed.
The next higher form of abstraction, level-one object refinement, is when data are placed in some type of context. Data are cleaned, meaning they are calibrated and filtered. Next-time correlation, determining whether data have been created or sent at the same time, is performed to determine the streams of data that have temporal commonality. For instance, TCP packets coming from a variety of apparent IP source addresses may have all been received by a single host within a period of a few seconds. A level-one object refinement might indicate that the activity is all related. Additionally, different weights can be assigned to various events, such that some will be considered more important than others (for example, because the outcomes they represent constitute a much higher threat to business interests).
The highest level of object refinement is knowledge fusion—deriving inferences, explanations, taxonomies, and even threats to critical infrastructures based on events that have occurred. The source of the attack and the motivation for launching the attack are just two of the many important possible by-products of knowledge fusion.
Bass feels that knowledge fusion is still in its infancy. Today’s intrusion-detection tools lack this capability, but Bass predicts that future systems will have this ability.
Alert Fusion
Alfonso Valdes and K. Skinner have developed a model of performing intrusion-detection data correlation for the purpose of fusing alerts, which means sending a single alert rather than multiple ones if very similar intrusion-detection-related events occur. Valdes and Skinner’s model is based upon the features of events related to incidents, weighted by values based on expectation of similarity. To trigger a fused alert, these features must reach a minimum criterion for similarity, such as a set of specific ports being targeted, in different observations. Other bases of similarity for producing fused rather than separate alerts are dimensions such as similarity of incidents reported by heterogeneous sensors, and correlated attack steps. Although this model is currently of more interest to theoreticians than practitioners, it is potentially useful to organizations that perform intrusion detection, because being overwhelmed with alerts generated by IDSs almost invariably results in operational chaos. Being able to fuse alerts—sending a single alert for a series of highly similar events, for example—is thus advantageous.
By now you may be wondering what all this means. In simple terms, automated intrusion-detection data correlation is becoming increasingly necessary as the diversity and complexity of attacks increases, but for the most part, correlation analysis is currently being done in a rather limited and haphazard manner. Tools that deliver event-correlation functionality are increasingly being used, but perhaps not as frequently as the magnitude of the problem would seem to dictate. Approaches such as template-based data correlation, Bass’s approach, and Valdes and Skinner’s model give us a picture of just how systematically data correlation can be performed, but humans cannot really do so without the aid of an appropriate algorithm and considerable computational power. Unfortunately, algorithms of the nature that Bass and Valdes and Skinner have derived are not yet available to the public. Until such algorithms become widely available, those who are involved in intrusion detection should at least become aware of the need for data correlation and also of methods that are currently available. Fortunately, other alternatives are available. Statistical correlation methods, the next topic of this chapter, provide a very promising direction.
Understanding and Using StatisticalCorrelation
The traditional correlation of events in intrusion-detection data is often called rule-based event correlation because one or more identifiable conditions (such as repeated sequences of events that can be traced back to a small number of hosts or possibly even a single host) are the basis for event correlation. Not all event correlation is rule-based, however; statistical event correlation is a viable alternative.
Statistics-based event correlation uses statistical methods to discover mathematical relationships between variables that can then be used to identify patterns and origins of events. A major advantage of using the statistical approach is that it is based on metrics—something that is not only conducive to objectivity, but which also lends itself to clarity and precision when intrusion-related events are being analyzed and discussed. Given that statistical packages such as SPSS (Statistical Package for the Social Sciences, www.spss.com) are widely available, statistical approaches provide an excellent approach to correlating intrusion-detection data. Accordingly, we’ll cover several topics related to statistical correlation, including what it is, what a correlation coefficient represents, how statistical inference is used in connection with correlation methods, and how to compute a Pearson product-moment correlation.
The Basics of Statistical Correlation
One of the most widely used statistical methods is statistical correlation, which involves taking measurements on two or more variables, then determining the statistical extent of the relationship between the variables.
A variable is a symbol for a quantity that may take on different values. For example, the number of vulnerability scans launched by a particular host is a variable. The number of web connections by a host is another. If we counted the number of vulnerability scans on a particular day and also counted the number of web connections by the same host on the same day, and then repeated this process day after day for perhaps 20 days, we would obtain the data necessary to correlate these two variables.
A correlation indicates the degree of relationship between the variables. The result of correlation analysis is a value that ranges between –1.00 and +1.00. A negative correlation means that the value of one variable increases as the value of the other decreases. So if, in the example of correlating the number of vulnerability scans and web connections, we find that on days in which there are more vulnerability scans there are fewer web connections from the host in question, there would be a negative correlation between the variables, as shown in Figure 12-2. In this figure, each dot represents an observation or measurement in which a value of both variables (X and Y) is obtained. The value of –1.00 represents a perfect negative correlation—one in which the value of the increase in one variable and the decrease in the value of the other is 100 percent accounted for by a linear relationship between the two variables. A perfect correlation is, of course, extremely unlikely—perfect predictability between variables is rare, in part because of measurement error, and also for a number of reasons well beyond the scope of this chapter.
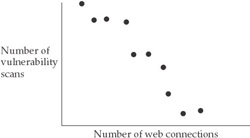
Figure 12-2: Hypothetical example of a negative correlation
A positive correlation means that that the value of one variable increases as the value of the other increases, or conversely that the value of one variable decreases as the value of the other decreases). For example, it is reasonable to expect a positive correlation between the number of log entries in a given system and the number of attacks launched against that system (see Figure 12-3). The value of +1.00 represents a perfect positive correlation, one in which the size of the increase (or decrease) in the value of one variable in a relationship to the change in value of the other is 100 percent predictable.
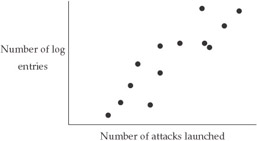
Figure 12-3: Hypothetical example of a positive correlation
A value of 0 represents a complete lack of relationship between variables. Another way of saying this is that the variables are randomly related to each other. It would, for example, be reasonable to expect a zero correlation between the memory size of a host and the number of attacks launched against this host (see Figure 12-4).
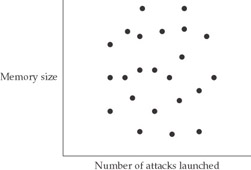
Figure 12-4: Hypothetical example of a zero correlation
Correlation Coefficient
The number that is calculated in a correlation analysis is called the correlation coefficient (r), and it represents the degree to which the relationship between variables is linear or predictable. Squaring this value produces r2, the coefficient of determination, which measures the proportion of common variation in the variables in question. The higher the coefficient of determination, the more of the variation that can be accounted for.
In order to analyze the correlation between variables, it is essential to determine the magnitude of the correlation. If a correlation coefficient is +0.5, the coefficient of determination is +0.5 * +0.5, or +0.25, meaning that 25 percent of the variance can be accounted for. If a correlation coefficient is –0.7, the coefficient of determination is –0.7 * –0.7, or 49 percent. This value means that we can account for slightly less than half of the variance in the data. So for intrusion-detection-related events, the higher the coefficient of determination, the more basis an intrusion-detection analyst would have for concluding that the variables in question are related.
Statistical Inference
The magnitude of the coefficient of determination alone is not really enough to warrant drawing conclusions, however. Statistical inference, applying statistical methods to test which of two hypotheses is correct, is necessary if systematic methods are to govern the interpretation of computed correlation coefficients. One hypothesis, the null hypothesis, states that the results are simply the product of chance, a random occurrence. The second is that the results are trustworthy—that the same pattern of results would be obtained if another set of measurements of the variables in question were performed.
The likelihood that one’s results are due to chance alone greatly diminishes as the size (positive or negative) of the correlation coefficient increases and as the number of observations (measurements) increases. Correlation coefficients produced by chance alone for any given number of measurements are computed, and obtained correlation coefficients are then compared to the “chance alone” values. If the obtained values deviate sufficiently from the “chance alone” values, the null hypothesis is rejected, and the results are said to be statistically significant. In most cases, a likelihood of 5 percent or less that obtained results are due to chance alone is considered sufficient for results to be statistically significant.
Pearson Product Moment Correlation
The most commonly used type of correlation method is the Pearson product-moment correlation (often abbreviated as the Pearson r). Pearson correlation requires that two variables have been measured on at least interval scales of measurement, meaning that each unit on the scale represents the same magnitude for the characteristic being measured across the entire range of variables. The value of r indicates the degree to which values of the two variables are “proportional” or “linear” to each other.
The formula for computing r is as follows:
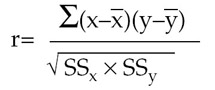
X stands for each value of one variable, X, and Y stands for each value of the other variable. X is the statistical mean (average) of the X values; Y is the statistical mean of the Y values. The formula indicates that the sum of each value of X minus X times each value of Y minus Y be divided by the square root of SSx (which is computed by taking each value of X minus the mean and then squaring the difference, and finally summing each squared difference) multiplied by SSy. Consider the following set of values for variables X and Y:
|
X |
Y |
|
2 |
3 |
|
4 |
6 |
|
6 |
7 |
|
12 |
12 |
Given these values, we can calculate the following results:
X is 24 / 4 = 6; Y is 28/4 = 7
The sum of:
(X – X) (Y – Y) = (2 – 6)(3 – 7) + (4 – 6)(6 – 7) + (6 – 6)(7 – 7) + (12 – 6)(12 – 7) =
16 + 2 + 0 + 30 = 48
SSx = 22 + 42 + 62 + 122 = 200
SSy = 32 + 62 + 72 122 = 238
SSx x SSy = 200 x 238 = 47600
The square root of 47600 = 218
r = 48 / 218 = +0.22
Statistical Correlation
Statistical correlation is potentially a very powerful method of analyzing the relationship between variables. From an intrusion-detection and intrusion-prevention analysis perspective, one of the greatest advantages is that statistical correlation allows investigators to summarize a great deal of data that might otherwise seem overwhelming. Statistical correlation is, in fact, ideally suited for dealing with large amounts of data. Additionally, this method enables those who use it to discover relationships that can be singled out for further statistical analysis using methods such as cluster analysis (see http://obelia.jde.aca.mmu.ac.uk/ and then click on M.Sc. Multivariate Statistics and then CA). Furthermore, statistical correlation is conducive to prediction, provided that obtained correlation coefficients are not equal to 0 or close to 0. If you know the correlation between the number of vulnerability scans and number of FTP-related attacks and are given a known number of vulnerability scans for a given unit of time, you could predict the number of FTP-related attacks. The higher the absolute value of the correlation coefficient, the stronger the prediction.
Like anything else, however, statistical correlation has several distinct downsides. The first and most important is that statistical correlation does not indicate whether or not one variable is causally related to another variable. That is, it does not tell you whether or not one variable directly affects the value of another. A common mistake of novice statisticians is inferring causation from correlation. Even variables that have a correlation of +1.00 or –1.00 may not be causally related.
Additionally, statistical correlation does not work very well when the range of one or more of the variables to be correlated is limited. If every value of variable X is either 4 or 5, for example, the range of X is so limited that it will be difficult to obtain a value of a correlation coefficient that is much different from 0. A meaningful correlation minimally requires that a fairly wide range of values for one variable be compared to a fairly wide range of values for another variable.
Baysian Inference
Another powerful statistical method that can be applied to data correlation in intrusion detection is Baysian inference. This type of inference is based on Bayes’ theorem, a theorem that allows computation of the probability of one event, given that another has occurred. This is the formula:
P(A | B) = P(B | A) P(A)/P(B | A) P(A)+P(B | A) P(A)
P(A | B) is the probability of event A, given that event B has occurred.
P(B | A) is the probability of event B, given that event A has occurred.
P(A) is the probability of event A.
P(B | A) is the probability of event B, given that event A has not occurred
P(A) is the probability that event A has not occurred.
Among other things, Baysian inference provides a nice way to calculate the probability that a given host is compromised given that a host to which it connects is or is not compromised, something that most IDSs do not do very well. To start this kind of analysis, one must know of at least one “bad” node—a host that is compromised and is used for making connections to other hosts. The probability of any other host being compromised is much higher if it has one or more connections to and from the bad node than if it does not.
Using Bayes’ theorem, A is the event in which a host has been compromised, and B represents “symptoms” (remote connections with a bad node). Only 1 percent of all hosts in this hypothetical situation are known to be compromised. The probability that a host is compromised, given that it has one or more connections with a compromised host is .60. So if P (A) = .01 and P (A) = .99, and if P(B | A) = .60 and P(B | A) = .40, then:
P (A | B) = (.60)(.01)/(.60)(.01)+(.40)(.99)
or a fairly low probability that the host with connections to and from the bad node has been compromised.
Variations of Bayes’ theorem can also be applied sequentially to a series of events. Thus, if another connection from a bad node is observed, the recently computed probability of compromise can be used in computing the new conditional probability, which will now increase over the previous value.
The popularity of Bayes’ theorem within computer science, operations research, the social sciences, and other arenas very much attests to its usefulness. Although Bayes’ theorem is currently not used too frequently in correlating intrusion-detection data, this is likely to change in the future, especially considering that network encryption is growing in popularity, to the point where many network-based IDSs are having a difficult time analyzing the traffic that goes over the network. Bayes’ theorem allows intrusion-detection analysts to predict and correlate events and conditions without having information from the data portion of packets. All one needs is current known or estimated probabilities, such as the probability that a given host is compromised, as well as identification of connections between hosts.
The major limitation of Bayes’ theorem is that those who use it often do not really know much about the initial probability that one event will occur given that another occurs. Critics point out that the determination of an initial probability often deteriorates to pure or partial guessing, which can render the meaning of the output of Bayes’ theorem dubious.
Real Time Versus After the Fact Correlation
Real-time correlation means that the output of sensors, packet-capture devices, and other sources of data are correlated as the data are being captured. The term real-time is really a misnomer, as machine cycles are required to process whatever information is to be correlated. Real-time correlation requires the availability of a data-correlation program that has a low turnaround time between data acquisition and output, as well as sufficiently high-end hardware to support the required processing speed. As mentioned previously, few intrusion-detection data-correlation programs are currently available. Imagine, therefore, how few near-real-time programs with this functionality are available.
The alternative is after-the-fact correlation, meaning that a noticeable time delay occurs before the results of data correlation are available. After-the-fact correlation is in many ways better than real-time correlation in that it can allow a more systematic and thorough evaluation of a broader range of information. The main limitation of after-the-fact correlation is that it is inadequate in urgent situations, where having some information, no matter how crude, is better than having none. But it generally takes time to perform a thorough data correlation, giving the overall edge to after-the-fact correlation if thoroughness is what is most important.
In intrusion prevention, however, the meaning of real-time versus after-the-fact correlation changes considerably. The data required to determine whether or not each pending system call, function within an application, file or Registry access attempt, attempted system modification, and so on, is potentially detrimental need to be continuously available in real time. If such data are not available in real time, systems with intrusion-prevention capabilities could be compromised before an intrusion-prevention engine is finished its analysis. Suppose that someone enters a command in a Unix or Linux system that results in a recursive deletion of the file system without a prompt that gives the user an opportunity to halt the execution of this command:
rm -rf *
In this case, the intrusion-prevention engine must be able to nearly instantaneously determine that the results of executing this command would be catastrophic and stop the command from being executed. Time is of the essence. But because currently available commercial intrusion-prevention tools are so often host-based, they are neither designed nor equipped to also instantaneously collect data from sources throughout the network and correlate whatever system event is about to occur with the data gleaned in real time. This is a truly impossible feat for an individual host intended to serve other functions, such file- and application-serving.
Instead hosts usually receive periodic, non-real-time (but nevertheless timely) updates about adverse events—vulnerability scans, attacks, worms, and so forth—often from a master server that performs data correlation and then passes intrusion-prevention policy changes on to each host. The particular policy on each host determines what kinds of operations and functions are and are not allowed. The Cisco Security Agent (formerly Okena StormWatch) intrusion-prevention tool (http://www.cisco.com/univercd/cc/ td/doc/product/vpn/ciscosec/csa/21/),works almost exactly in this manner, providing a good case in point. At the same time, however, policy management, particularly tailoring policies to meet the particular security needs of individual hosts, can be a major downside with intrusion-detection technology.
Case Study
Several years ago, an organization was alerted by Snort that a probe directed at the portmapper of a particular Solaris host had been launched. The entry looked like this:
[**] [1:1959:1] RPC portmap request NFS UDP [**]
[Classification: Decode of an RPC Query] [Priority: 2]
08/14-04:12:43.991442 192.168.0.0:46637 -> 10.0.0.1:111
UDP TTL:250 TOS:0x0 ID:38580 IpLen:20 DgmLen:84 DF
Len: 56
As you will discover in greater detail in Chapter 10, Snort is not a bad intrusion-detection tool (especially considering that it is so lightweight and also is in the public domain), but unfortunately this tool is somewhat prone to producing false alarms (as also discussed in Chapter 10). The intrusion-detection analysts looked for other sources of data to determine what had occurred and when.
Combing through the logs of their Firewall-1 firewall, they found something similar to the following entry (although the source and destination IP addresses here have been changed to private addresses—real addresses have not been used because of the possibility that someone who learns of such addresses attacking these hosts or making false conclusions about what has transpired with them):
Aug 14 04:12:43 2003 f_kern_tcp a_nil_area t_netprobe p_major scrip: 192.168.0.1 dstip: 10.0.0.1 protocolname: udp srcburb: 1 srcport: 46637 dstport: 111
As they examined the firewall logs more closely, they realized that contrary to their expectations, NFS-related traffic was getting through from the outside to hosts within their internal network. Knowing that NFS (Network File System) is one of the most vulnerability-prone services, they became concerned that one of the main Unix servers within their internal network may have been compromised. Fortunately, after talking to the primary system administrator for the host in question, they found that this host was running a logging tool, NFSwatch (available from http://ftp.cerias.purdue.edu/ pub/tools/unix/netutils/nfswatch/). The system administrator retrieved the NFSwatch output for the host by entering this command:
# ./nfswatch -server -all
The output looked like this:
 all hosts Thus Aug 14 20:27:40 2003 Elapsed time: 00:04:01
 Interval packets: 898 (network) 766 (to host) 0 (dropped)
 Total packets: 21228 (network) 13450 (to host) 0 (dropped)
 Monitoring packets from interface eth0
 int pct total int pct total
 ND Read 0 0% 0 TCP Packets 450 56% 13678
 ND Write 0 0% 0 UDP Packets 448 43% 1051
 NFS Read 172 20% 271 ICMP Packets 0 0% 0
 NFS Write 1 0% 2 Routing Control 0 0% 36
 NFS Mount 0 0% 5 Address Resolution 2 0% 76
 YP/NIS/NIS+ 0 0% 0 Reverse Addr Resol 0 0% 0
 RPCAuthorization 166 20%306 Ethernet/FDDI Bdcst 4 0% 179
 Other RPC Packets 25 3% 74 Other Packets 2 0% 131
 2 file systems
 File Sys int pct total File Sys int pct total
 waccess(32,17) 0 0% 14
 host(32,26) 161 100% 250
After looking over the results of this host-based monitoring tool carefully, they realized that the host about which they were concerned was probably not compromised. The overwhelming preponderance of the packets this machine had received were RPC authorization packets, none of which were associated with any known attacks that were occurring at that time. No NFS write packets had been detected, meaning that it was unlikely that someone had mounted a file system and then changed critical files (especially system files).
In this situation, no source of intrusion-detection data was sufficient. The analysts' interest in the event in question was triggered by a Snort alert, confirmed by a log entry in a firewall, and analyzed more fully using data available from a host-based monitoring tool.
Summary
Data correlation is potentially an extremely important issue for many organizations. Simply amassing intrusion-detection data and accepting it at face value is in many cases insufficient, in that it does not go far enough in helping those involved in an incident understand exactly what is occurring, the associated level of threat, and the appropriate intervening action or actions needed. Correlating data, on the other hand, adds meaning and significance to intrusion detection, to the point that if data correlation is done correctly, it leads to deeper levels of understanding and also facilitates the process of responding to incidents that occur.
Currently in most operational settings, data correlation occurs (usually in the form of individuals using knowledge that they have gained when they evaluate new intrusion-detection data), but it is usually rather primitive. Some individuals rise far above the norm, but these individuals are few and far between. And even the most skillful analyst faces massive memory and other cognitive limitations that do not apply to today’s computing systems. Automated data correlation provides a much better alternative, but as discussed previously, too few organizations deploy tools that deliver such a capability. Statistical correlation and Baysian methods, in addition to other statistical and mathematical techniques, are also available, but they, too, are underutilized.
What the intrusion-detection and intrusion-prevention arena sorely needs is a next generation of systems capable not only of identifying incidents, but also of correlating events through analysis engines that tie in not only with sensors, but more importantly with large databases of known and suspected incidents. Experts such as Waltz and Llinas have prescribed functionality for systems that will perform advanced data correlation and fusion (see Chapter 17), but except in the military and a few other arenas, too little progress in developing such systems has been evident. As is said throughout this book, intrusion detection is making great headway, but in many respects it is still in its infancy—and intrusion prevention is an even newer technology than intrusion detection. Truly, we have a long way to go.
Part I - Intrusion Detection: Primer
- Understanding Intrusion Detection
- Crash Course in the Internet Protocol Suite
- Unauthorized Activity I
- Unauthorized Activity II
- Tcpdump
Part II - Architecture
Part III - Implementation and Deployment
Part IV - Security and IDS Management
EAN: 2147483647
Pages: 163
