Importance of Terminating Clock Lines
High-speed applications demand low skew between clock signals as received . Clock repeater chips produce low skew between the outputs as transmitted . To obtain the former from the latter, we must do more than simply provide equal length traces on all clock nets . We must use traces of equal delay (remember that outer layer, or microstrip, traces go a little faster than inner layer, or stripline , traces), we must use the same termination strategy on each trace, and we must place the same loads at the end of each line. To the extent that we have achieved these three objectives, the trace delays will be properly balanced.
Figure 12.18 indicates how trace delay can vary with termination type and capacitive load, even for short traces. This figure charts the effective line delay (to the 75% V IH threshold) versus line length for various combinations of termination style and capacitive loading. In the figure, the assumed signal risetime is 1.00 ns, the assumed trace impedance is 50 W , and the assumed trace delay is 180 ps/inch (FR-4 stripline at 25 °C).
Figure 12.18. Lacking a series-terminating resistor, the effective trace delay (to 75% V CC ) varies in a nonlinear fashion with load capacitance and line length.
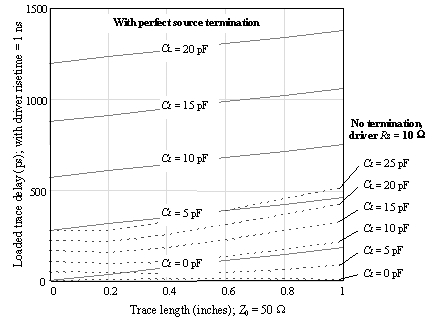
Results for a series- terminated line are shown with solid lines. With zero loading, the lowest solid line shows an ideal delay of 180 ps/inch. As each increment of 5 pF is added to the line, the delay goes up by about 300 ps (this is approximately RC , where R = 50 W and C is the load capacitance). This example illustrates the linear relationship between line length, loading, and delay that applies to series-terminated structures. Notice that with the series termination, the additional delay contributed by a particular capacitive load varies in proportion to the amount of capacitance but not with the line length.
Results for a short, unterminated line are shown with dotted lines. The source impedance of the driver is assumed to be 10 W , and the far end of the line is loaded only with the capacitance of the receiver. Note that these are nonlinear curves. The nonlinearity renders most rule-of-thumb delay equations quite useless. The nonlinearity derives from minor amounts of overshoot or undershoot at the end of the unterminated line, which shift the precise time at which the output signal crosses the clock threshold. This nonlinear effect dominates the delay performance of short unterminated lines. (In this example I have confined the line length to no more than 1 in., at which point ringing is still quite small ”even then it has a noticeable impact on signal delay.)
In any unterminated configuration, a shorter line shows less variation with capacitive loading than a longer line. That is because a capacitive load, if located near the driver, is directly charged by the rather low source impedance of the driver. When removed from the driver, even if only by only a small fraction of a risetime, the interposed series inductance of the trace raises the driving-point impedance seen by the capacitor, thus exaggerating the capacitor 's effect on delay.
Figure 12.19 plots the received waveforms for both cases under investigation. The top graph depicts an unterminated configuration. The bottom graph depicts a series-terminated configuration. Each plot is repeated for various values of line length, ranging from zero to one inch. The load capacitance for all plots is fixed at 5 pf.
Figure 12.19. An unterminated transmission line exhibits a nonlinear relation between line length and delay.
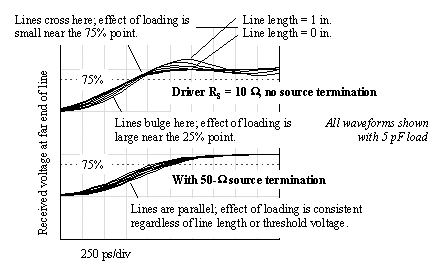
In the unterminated case, as the line is lengthened it acquires increasing degrees of overshoot. Examining the point at which each curve crosses the 75% threshold, each contribution of delay caused by an increase in line length is partially offset by an advance in the threshold crossing caused by overshoot. This effect is displayed in Figure 12.18 for the 5-pF load (unterminated case) as an almost flat curve showing little discernable increase in delay as the line length changes from zero to one inch. This behavior is bizarre. The effective delay of this 1-in. trace appears to be zero (with a 10- W driver, 1-ns risetime, and 5-pF load, as measured at the 75% V IH threshold).
The 25% threshold crossing reveals a much different picture. Near the 25% threshold the curves in Figure 12.19 bulge, displaying a greater-than-expected amount of variation with line length. Apparently, the absence of a series termination creates a volatile and nonlinear relationship between the line length, load capacitance, and delay.
If you are serious about controlling clock skew, you will carefully balance your clock distribution tree. Use the same clock drivers everywhere. Source-terminate every driver, and use the same length line with the same impedance and the same loading on each trace. Balance the loading on each line, even if you have to add dummy capacitors to one branch to balance out loads on the other branches. Pay close attention to the specifications for input-to-output delay on the drivers (not just the output-to-output skew), and check your results with a high-quality probe and high-bandwidth oscilloscope.
Tight control of clock skew can be accomplished only with a complete awareness of all the relevant circuit parameters. Merely balancing the trace lengths is not enough.
POINT TO REMEMBER
- For low skew, use the same clock drivers everywhere, source-terminate every driver, and use the same length line with the same impedance and the same loading on every trace.
Fundamentals
- Impedance of Linear, Time-Invariant, Lumped-Element Circuits
- Power Ratios
- Rules of Scaling
- The Concept of Resonance
- Extra for Experts: Maximal Linear System Response to a Digital Input
Transmission Line Parameters
- Transmission Line Parameters
- Telegraphers Equations
- Derivation of Telegraphers Equations
- Ideal Transmission Line
- DC Resistance
- DC Conductance
- Skin Effect
- Skin-Effect Inductance
- Modeling Internal Impedance
- Concentric-Ring Skin-Effect Model
- Proximity Effect
- Surface Roughness
- Dielectric Effects
- Impedance in Series with the Return Path
- Slow-Wave Mode On-Chip
Performance Regions
- Performance Regions
- Signal Propagation Model
- Hierarchy of Regions
- Necessary Mathematics: Input Impedance and Transfer Function
- Lumped-Element Region
- RC Region
- LC Region (Constant-Loss Region)
- Skin-Effect Region
- Dielectric Loss Region
- Waveguide Dispersion Region
- Summary of Breakpoints Between Regions
- Equivalence Principle for Transmission Media
- Scaling Copper Transmission Media
- Scaling Multimode Fiber-Optic Cables
- Linear Equalization: Long Backplane Trace Example
- Adaptive Equalization: Accelerant Networks Transceiver
Frequency-Domain Modeling
- Frequency-Domain Modeling
- Going Nonlinear
- Approximations to the Fourier Transform
- Discrete Time Mapping
- Other Limitations of the FFT
- Normalizing the Output of an FFT Routine
- Useful Fourier Transform-Pairs
- Effect of Inadequate Sampling Rate
- Implementation of Frequency-Domain Simulation
- Embellishments
- Checking the Output of Your FFT Routine
Pcb (printed-circuit board) Traces
- Pcb (printed-circuit board) Traces
- Pcb Signal Propagation
- Limits to Attainable Distance
- Pcb Noise and Interference
- Pcb Connectors
- Modeling Vias
- The Future of On-Chip Interconnections
Differential Signaling
- Differential Signaling
- Single-Ended Circuits
- Two-Wire Circuits
- Differential Signaling
- Differential and Common-Mode Voltages and Currents
- Differential and Common-Mode Velocity
- Common-Mode Balance
- Common-Mode Range
- Differential to Common-Mode Conversion
- Differential Impedance
- Pcb Configurations
- Pcb Applications
- Intercabinet Applications
- LVDS Signaling
Generic Building-Cabling Standards
- Generic Building-Cabling Standards
- Generic Cabling Architecture
- SNR Budgeting
- Glossary of Cabling Terms
- Preferred Cable Combinations
- FAQ: Building-Cabling Practices
- Crossover Wiring
- Plenum-Rated Cables
- Laying Cables in an Uncooled Attic Space
- FAQ: Older Cable Types
100-Ohm Balanced Twisted-Pair Cabling
- 100-Ohm Balanced Twisted-Pair Cabling
- UTP Signal Propagation
- UTP Transmission Example: 10BASE-T
- UTP Noise and Interference
- UTP Connectors
- Issues with Screening
- Category-3 UTP at Elevated Temperature
150-Ohm STP-A Cabling
- 150-Ohm STP-A Cabling
- 150- W STP-A Signal Propagation
- 150- W STP-A Noise and Interference
- 150- W STP-A: Skew
- 150- W STP-A: Radiation and Safety
- 150- W STP-A: Comparison with UTP
- 150- W STP-A Connectors
Coaxial Cabling
- Coaxial Cabling
- Coaxial Signal Propagation
- Coaxial Cable Noise and Interference
- Coaxial Cable Connectors
Fiber-Optic Cabling
- Fiber-Optic Cabling
- Making Glass Fiber
- Finished Core Specifications
- Cabling the Fiber
- Wavelengths of Operation
- Multimode Glass Fiber-Optic Cabling
- Single-Mode Fiber-Optic Cabling
Clock Distribution
- Clock Distribution
- Extra Fries, Please
- Arithmetic of Clock Skew
- Clock Repeaters
- Stripline vs. Microstrip Delay
- Importance of Terminating Clock Lines
- Effect of Clock Receiver Thresholds
- Effect of Split Termination
- Intentional Delay Adjustments
- Driving Multiple Loads with Source Termination
- Daisy-Chain Clock Distribution
- The Jitters
- Power Supply Filtering for Clock Sources, Repeaters, and PLL Circuits
- Intentional Clock Modulation
- Reduced-Voltage Signaling
- Controlling Crosstalk on Clock Lines
- Reducing Emissions
Time-Domain Simulation Tools and Methods
- Ringing in a New Era
- Signal Integrity Simulation Process
- The Underlying Simulation Engine
- IBIS (I/O Buffer Information Specification)
- IBIS: History and Future Direction
- IBIS: Issues with Interpolation
- IBIS: Issues with SSO Noise
- Nature of EMC Work
- Power and Ground Resonance
Points to Remember
Appendix A. Building a Signal Integrity Department
Appendix B. Calculation of Loss Slope
Appendix C. Two-Port Analysis
- Appendix C. Two-Port Analysis
- Simple Cases Involving Transmission Lines
- Fully Configured Transmission Line
- Complicated Configurations
Appendix D. Accuracy of Pi Model
Appendix E. erf( )
Notes
EAN: N/A
Pages: 163
