Linear Equalization: Long Backplane Trace Example
Linear Equalization Long Backplane Trace Example
Figure 3.43 depicts the propagation function for four 50- W striplines with different lengths. The longest trace (1.5 m) corresponds to the maximal configuration you might encounter in a large backplane if you include long daughter card traces at each end.
Figure 3.43. The propagation function for a long pcb trace varies strongly with trace length.
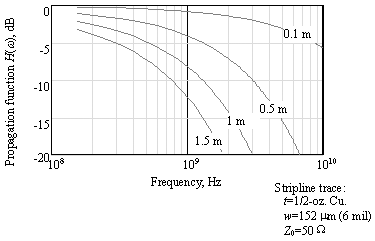
The propagation functions in this collection exhibit low-pass filter traits that are characteristic of a combination of skin and dielectric loss effects: The longer the trace, the lower the 3dB attenuation frequency.
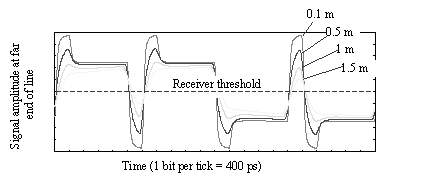
Figure 3.44 illustrates the signal as received at the far end of each trace. The signal pattern used to generate this figure is 1111101111100000100000, transmitted at a bit rate of 2.5 Gb/s (400-ps bit intervals). The assumed transmit rise/fall time is 20% of a bit interval. This particular pattern (a maximal run length of ones interrupted by a single zero, and vice versa) is a good worst-case eye-opening test for many systems whose transfer function declines monotonically like the curves shown in Figure 3.43.
Figure 3.44. The received signal amplitude varies as a function of line length.
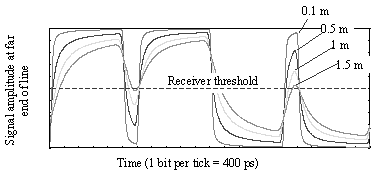
The shortest trace (0.1 m) conveys the signal with almost perfect fidelity. As the trace is lengthened, the quick transition (101) is attenuated by successively greater amounts until, at 1.5 meters , this transition fails to adequately cross the receiver threshold. The attenuation is caused by dispersion of the rising and falling edges of the signal ”in a quick 101 pattern the signal does not have adequate time to completely cross the threshold before it must reverse course.
Note that a sine wave purely composed of the alternating 101010.... pattern would of course cross the threshold admirably in both directions. A long run of ones, however, followed by one quick pop in the downward direction (or the inverse of this pattern), presents the greatest difficulty.
Figure 3.45 details the exact amplitudes of the received signal at several points. The peak-to-peak amplitude of a large (slow-speed, or long run-length) transition is marked as a 1 . The peak-to-peak amplitude of a quick 010 transition is marked as a 2 . The magnitude by which the peak of the 010 sequence manages to top the receiver threshold is given as
Equation 3.151

Figure 3.45. The dispersion penalty is a function of the ratio of the largest to the smallest transition amplitudes ( a 1 / a 2 ).
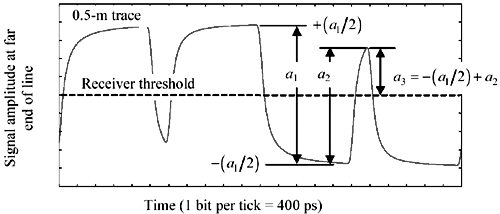
Equation [3.151] is derived by noting that the signal amplitude beginning at “( a 1 /2) is increased by amount a 2 at its peak. The ratio in dB by which the quick transition a 3 fails to attain the same peak value as the slow transition + (a 1 /2) is called the dispersion penalty p d1 :
Equation 3.152

The dispersion penalty may be expressed in terms of the ratio r of the amplitudes of the low- and high-frequency transitions:
Equation 3.153

|
where |
a 1 equals the amplitude of the largest (slow-speed, or long run-length) transition, |
|
a 2 equals the amplitude of the smallest transition (usually a quick transition like 010), |
|
|
r is the ratio a 2 / a 1 , and |
|
|
p d1 is the noise-tolerance penalty suffered at the receiver in exchange for having to deal with signal dispersion above and beyond low-frequency attenuation. |
Figure 3.46 charts the dispersion penalty p d1 as a function of r , with both quantities in units of dB. Due to the form of the dispersion-penalty equation, a received-amplitude ratio of 3dB causes a lot more than 3dB worth of degradation in the received amplitude. A received-amplitude ratio of 6 dB causes total receiver failure.
Figure 3.46. The dispersion penalty is a function of the ratio r of the amplitudes of the highest and lowest -frequency signals on the line.
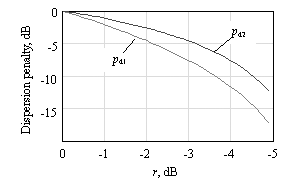
The dispersion penalty p d1 as defined here represents the worst-case received amplitude degradation above and beyond consideration of the attenuation of the lowest frequency (slow-speed, or long run-length) patterns present in the data waveform.
For noncoded random data, amplitude a 1 is taken to be the peak-to-peak received amplitude at DC. For coded data waveforms having zero meaningful DC content (like Manchester coding, or 8B10B coding), amplitude a 1 is taken to be the peak-to-peak received amplitude of the lowest possible frequency long-run-length sequence produced by the code.
The dispersion penalty could alternately be defined as the ratio in dB by which the quick transition amplitude a 3 fails to attain the peak amplitude of a repeating fast transition sequence 101010.... The amplitude of this repeating fast-transition sequence is +( a 2 / 2). In this case the dispersion penalty calculation is modified:
Equation 3.154

This dispersion penalty p d2 represents the worst-case received amplitude degradation above and beyond consideration of the attenuation of the highest frequency (quickest, or shortest run-length) patterns present in the data waveform.
Either penalty calculation can be used, as long as you remember the underlying basis of the definition. The difference between p d1 and p d2 equals precisely 20log( r ).
An improvement in the dispersion penalty can be made in binary systems by a simple fixed-linear equalizer. Any monotonic, slowly changing equalization function that improves the ratio r , either by lowering the amplitude of the low-frequency transitions a 1 or boosting the amplitude of the high-frequency transitions a 2 , will improve performance. The simple equalizer depicted in Figure 3.47 adjusts the transmitted signal magnitude during each bit interval to one of two values: a regular magnitude when repeating a bit, but double-magnitude when changing states. The combination of two magnitudes and two polarities results in a total of four possible transmit amplitudes that must be generated at the transmitter. By this scheme the received amplitude at the quick-transition locations is improved. This simple transmit-based equalization scheme can reliably boost the operating distance of a digital channel by 50% compared to the maximum reliable operating distance of an unequalized system. More elaborate equalization schemes can, if properly implemented, deliver even more impressive benefits.
Figure 3.47. A modest amount of fixed equalization improves the received eye pattern in a skin-effect limited or dielectric-effect limited binary signaling channel.
The ratio r may be estimated , but not determined precisely, from a plot of the transfer function of the digital channel. For example, in Figure 3.43 the signal attenuation for a 0.5-m trace at a frequency of 1.25 GHz (half the data rate) amounts to roughly 5 dB, whereas the attenuation at 1/10th that rate (corresponding to a repeating pattern of 10 zeroes and 10 ones) amounts to roughly 1 dB, a difference of 4 dB. This difference is indicative, but not exactly equal to, the ratio a 2 / a 1 in Figure 3.45. The reason such calculations are not exact is that the transfer function depicts the response to sine wave excitation at each particular frequency, whereas the desired variables a 1 and a 2 result from square wave excitation. Still, the transfer-function response ratio is often quite useful. My rule of thumb is that a system with less than 3 dB of difference in attenuation between the lowest relevant frequency and half the data rate will work reasonable well unequalized. Systems with a difference of more than 6 dB are marginal, and would benefit from fixed linear equalization. Systems with a difference of more than 12 dB generally require adaptive equalization, especially if you expect them to operate reliably at all channel lengths from zero to the maximum.
Fundamentals
- Impedance of Linear, Time-Invariant, Lumped-Element Circuits
- Power Ratios
- Rules of Scaling
- The Concept of Resonance
- Extra for Experts: Maximal Linear System Response to a Digital Input
Transmission Line Parameters
- Transmission Line Parameters
- Telegraphers Equations
- Derivation of Telegraphers Equations
- Ideal Transmission Line
- DC Resistance
- DC Conductance
- Skin Effect
- Skin-Effect Inductance
- Modeling Internal Impedance
- Concentric-Ring Skin-Effect Model
- Proximity Effect
- Surface Roughness
- Dielectric Effects
- Impedance in Series with the Return Path
- Slow-Wave Mode On-Chip
Performance Regions
- Performance Regions
- Signal Propagation Model
- Hierarchy of Regions
- Necessary Mathematics: Input Impedance and Transfer Function
- Lumped-Element Region
- RC Region
- LC Region (Constant-Loss Region)
- Skin-Effect Region
- Dielectric Loss Region
- Waveguide Dispersion Region
- Summary of Breakpoints Between Regions
- Equivalence Principle for Transmission Media
- Scaling Copper Transmission Media
- Scaling Multimode Fiber-Optic Cables
- Linear Equalization: Long Backplane Trace Example
- Adaptive Equalization: Accelerant Networks Transceiver
Frequency-Domain Modeling
- Frequency-Domain Modeling
- Going Nonlinear
- Approximations to the Fourier Transform
- Discrete Time Mapping
- Other Limitations of the FFT
- Normalizing the Output of an FFT Routine
- Useful Fourier Transform-Pairs
- Effect of Inadequate Sampling Rate
- Implementation of Frequency-Domain Simulation
- Embellishments
- Checking the Output of Your FFT Routine
Pcb (printed-circuit board) Traces
- Pcb (printed-circuit board) Traces
- Pcb Signal Propagation
- Limits to Attainable Distance
- Pcb Noise and Interference
- Pcb Connectors
- Modeling Vias
- The Future of On-Chip Interconnections
Differential Signaling
- Differential Signaling
- Single-Ended Circuits
- Two-Wire Circuits
- Differential Signaling
- Differential and Common-Mode Voltages and Currents
- Differential and Common-Mode Velocity
- Common-Mode Balance
- Common-Mode Range
- Differential to Common-Mode Conversion
- Differential Impedance
- Pcb Configurations
- Pcb Applications
- Intercabinet Applications
- LVDS Signaling
Generic Building-Cabling Standards
- Generic Building-Cabling Standards
- Generic Cabling Architecture
- SNR Budgeting
- Glossary of Cabling Terms
- Preferred Cable Combinations
- FAQ: Building-Cabling Practices
- Crossover Wiring
- Plenum-Rated Cables
- Laying Cables in an Uncooled Attic Space
- FAQ: Older Cable Types
100-Ohm Balanced Twisted-Pair Cabling
- 100-Ohm Balanced Twisted-Pair Cabling
- UTP Signal Propagation
- UTP Transmission Example: 10BASE-T
- UTP Noise and Interference
- UTP Connectors
- Issues with Screening
- Category-3 UTP at Elevated Temperature
150-Ohm STP-A Cabling
- 150-Ohm STP-A Cabling
- 150- W STP-A Signal Propagation
- 150- W STP-A Noise and Interference
- 150- W STP-A: Skew
- 150- W STP-A: Radiation and Safety
- 150- W STP-A: Comparison with UTP
- 150- W STP-A Connectors
Coaxial Cabling
- Coaxial Cabling
- Coaxial Signal Propagation
- Coaxial Cable Noise and Interference
- Coaxial Cable Connectors
Fiber-Optic Cabling
- Fiber-Optic Cabling
- Making Glass Fiber
- Finished Core Specifications
- Cabling the Fiber
- Wavelengths of Operation
- Multimode Glass Fiber-Optic Cabling
- Single-Mode Fiber-Optic Cabling
Clock Distribution
- Clock Distribution
- Extra Fries, Please
- Arithmetic of Clock Skew
- Clock Repeaters
- Stripline vs. Microstrip Delay
- Importance of Terminating Clock Lines
- Effect of Clock Receiver Thresholds
- Effect of Split Termination
- Intentional Delay Adjustments
- Driving Multiple Loads with Source Termination
- Daisy-Chain Clock Distribution
- The Jitters
- Power Supply Filtering for Clock Sources, Repeaters, and PLL Circuits
- Intentional Clock Modulation
- Reduced-Voltage Signaling
- Controlling Crosstalk on Clock Lines
- Reducing Emissions
Time-Domain Simulation Tools and Methods
- Ringing in a New Era
- Signal Integrity Simulation Process
- The Underlying Simulation Engine
- IBIS (I/O Buffer Information Specification)
- IBIS: History and Future Direction
- IBIS: Issues with Interpolation
- IBIS: Issues with SSO Noise
- Nature of EMC Work
- Power and Ground Resonance
Points to Remember
Appendix A. Building a Signal Integrity Department
Appendix B. Calculation of Loss Slope
Appendix C. Two-Port Analysis
- Appendix C. Two-Port Analysis
- Simple Cases Involving Transmission Lines
- Fully Configured Transmission Line
- Complicated Configurations
Appendix D. Accuracy of Pi Model
Appendix E. erf( )
Notes
EAN: N/A
Pages: 163
