Coaxial Signal Propagation
Coaxial cable is a single-ended transmission medium, meaning that the signal current flows through the main signal path (the inner conductor) and then returns to its source through a low-impedance, hopefully zero-voltage-drop return path (the outer shield). The dielectric exists to hold the center conductor in the middle of the structure, keeping it from flopping over to one side and shorting against the shield.
A good coaxial cable presents a nearly uniform impedance at all frequencies above the onset of the skin effect. The following equation shows the impedance obtained in the skin-effect region, with signal current flowing only on the facing surfaces of the inner and outer conductors.
Equation 10.1

|
where |
|
|
d 2 is the inside diameter of the shield, m, and |
|
|
d 1 is the effective diameter of the signal conductor, m. |
The onset of the skin effect happens at about 100 KHz in RG-58 and related coaxial cables.
Mechanical perturbations in the cross-sectional geometry of the cable can affect its characteristic impedance. If, however, the perturbations are small and closely spaced compared to the wavelength of the signals used, and if the imperfections are uniformly distributed, the impedance remains unchanged. For example, the surface roughness on the inside face of a braided shield will increase the skin effect loss of the cable, but not the impedance.
Coaxial cables are readily available with characteristic impedances near 50, 75, or 93 ohms. Fifty ohms is most popular for test equipment applications; 75 W is most popular for audio-visual applications.
Electrical specifications for selected Belden coaxial cable types appear in Table 10.2. Coaxial cables are not subject to rigid standardization, as are UTP and some varieties of fiber cables, so you will find many, many types and varieties of coaxial cabling. I've selected only a small number of representative cables for study. Please note that these are cable specifications, not overall channel specifications. Channel specifications (which include connectors and patch cords) are always worse (see Section 7.2, "SNR Budgeting").
What follows is a discussion of how to compute the metallic-transmission model parameters for coaxial cables (See Section 3.1, "Signal Propagation Model"). For most coaxial cables a reasonable value for w is 10 MHz. Parameters Z , v , and R DC generally appear directly in a coaxial cable datasheet. Parameters R and q must be estimated.
R DC is calculated as the sum of the DC resistance per meter of the center conductor and the shield. These parameters are generally listed on the cable datasheet. If there are two shields (triaxial cable), use the DC resistance of only the inner shield.
Equation 10.2

|
where |
DCR CENTER is the resistance of the center conductor, W /m, |
|
DCR SHIELD is the resistance of the center conductor, W /m, and |
|
|
R DC is the overall DC resistance of the cable, W /m, |
If the center conductor is composed of a copper -plated steel core (as is commonly used), you will need to know the plating thickness and the worst-case variation in plating thickness to work out the DC resistance. These parameters are often difficult to obtain from cable manufacturers. In that case you can always resort to your ohmmeter to measure some sample cables.
You should also know that a composite cable composed of a steel core with copper plating (and perhaps also with a third layer of silver plating) undergoes a complicated series of skin-effect transformations. Current is first expunged from the steel at surprisingly low frequencies. This happens because the large magnetic permeability of steel imbues the material with an astonishingly small skin depth. This effect causes a ramp in the AC resistance at low frequencies, followed by a relatively flat plateau where the conductor acts essentially as a hollow copper tube. The tube resistance is fairly flat until one reaches a skin depth comparable with the plating thickness, after which the resistance again resumes rising at a rate proportional to the square root of frequency. The overall effect of a composite structure is to broaden the transition region associated with the onset of the skin effect.
The equation for the AC skin-effect resistance is modified to separately account for the center conductor and shield resistances, where s 1 and d 1 are the conductivity (S/m) and diameter (m) of the center conductor respectively and where s 2 and d 2 are the conductivity and diameter of the shield. First compute the depth of penetration of current (skin depth) for each conductor. The following equation shows the calculation of skin depth as it ordinarily appears [81] .
Equation 10.3

|
where |
n = 1 or 2, representing the center conductor and shield respectively, |
|
d n is the skin depth of the nth conductor, in meters , |
|
|
w is the frequency at which the skin depth is specified, rad/s, |
|
|
m n is the magnetic permeability of the nth conductor in H/m, and |
|
|
s n is the conductivity of the nth conductor, S/m. |
|
|
For any non-magnetic conductor m = 4 p ·10 “7 H/m. |
|
|
The conductivities of selected popular conducting materials appear in Table 10.3. |
|
Table 10.2. Electrical Specifications for Selected Belden Coaxial Cables
|
Item |
8216(RG-174/U) |
84316(RG-316/U) |
8259(RG-58A/U) |
8240(RG-58/U) |
84303(RG-303/U) |
8237(RG-8/U) |
|
|---|---|---|---|---|---|---|---|
|
Attenuation dB/100 m at 20 °C |
MHz |
||||||
|
1 |
6.23 |
3.93 |
1.38 |
.98 |
1.11 |
.52 |
|
|
10 |
10.82 |
8.85 |
4.92 |
3.61 |
3.61 |
1.84 |
|
|
50 |
19.02 |
18.36 |
12.13 |
8.20 |
8.85 |
4.26 |
|
|
100 |
27.5 |
27.2 |
17.7 |
12.5 |
12.8 |
6.2 |
|
|
200 |
41.0 |
39.3 |
26.6 |
18.4 |
18.4 |
9.2 |
|
|
400 |
62.3 |
57.4 |
40.7 |
27.5 |
26.9 |
13.8 |
|
|
700 |
88.5 |
77.7 |
58.0 |
38.4 |
36.1 |
19.3 |
|
|
900 |
101.6 |
89.5 |
69.2 |
44.9 |
41.0 |
22.6 |
|
|
Z ( W ) |
Min |
48 |
48 |
48 |
49.5 |
48 |
48 |
|
Max |
52 |
52 |
52 |
53.5 |
52 |
52 |
|
|
v / c |
Nom. |
.66 |
.695 |
.66 |
.66 |
.695 |
.66 |
Next use the skin depth to calculate the AC resistance of both signal and shield wires at frequency w 1 . The proximity effect for coaxial cables is nonexistent, because all coaxial current distributions are circularly symmetric, so you don't need a proximity correction. The total AC resistance is simply
Equation 10.4

|
where |
d n is the diameter of the nth conductor, |
|
d n is the skin depth of the nth conductor, in meters (see [10.3]), and |
|
|
s n is the conductivity of the nth conductor, S/m. |
|
|
The conductivities of selected popular conducting materials appear in Table 10.3. |
|
If you like, you may substitute into [10.4] the definition of skin depth [10.3]:
Equation 10.5

If both center conductor and shield are made of the same material,
Equation 10.6

Table 10.3. Conductivity of Common Conductor Materials
|
Material |
Conductivity (S/m) |
|---|---|
|
Annealed copper as prepared for ordinary wires |
5.80 ·10 7 |
|
Aluminum as prepared for ordinary wires and foil shields |
3.54 ·10 7 |
|
Solder-tinned copper (surface conductivity) |
1.54 ·10 7 |
|
Silver (pure) |
6.29 ·10 7 |
|
Steel, E.B.B. [1] |
0.96 ·10 7 |
|
Steel, B.B. [1] |
0.84 ·10 7 |
[1] NOTE ”Owing to wide differences in the composition of steel alloys, the relative magnetic permeability for "ordinary" steel ranges from 100 to 10,000 or more. This variation in permeability induces substantial variations in the skin depth of the material.
Solid signal conductors, while an interesting and tractable mathematical situation, almost never occur in practice, because most coaxial cables incorporate stranded and/or plated wire. In the event that the conductors are stranded, various surface-roughness corrections become necessary. In the event that the conductors are plated (for example, tinned with solder or silver-coated), corrections must be applied when the skin depth approaches the thickness of the plating. In a practical cable these corrections quickly become very involved, and I do not recommend that you spend time investigating them. A better approach is to simply compute the solid-conductor approximation as a starting point, put the model together, and then tweak the parameters for a final fit, as discussed below.
Dielectric losses are difficult to model precisely. The dielectric loss tangent for polyethylene (the white plastic insulation used in most coaxial cables) varies depending on temperature and purity. Values quoted range from a low of 0.0002 to a high of 0.002. The dielectric loss tangent for PTFE dielectric is similar to polyethylene, but the material is useful to higher temperatures (and more expensive).
Dielectric losses, dielectric constants, and the conductivity of metals all vary with frequency. If your system will operate at extreme temperatures (either hot or cold), you should thoroughly investigate this effect.
The dielectric material serves merely to hold the center conductor in a fixed position, preventing it from falling towards one side and shorting out against the shield. Any structure that serves this purpose can be used to create a good coaxial cable.
For example, some cables have a band of dielectric material wrapped around the center conductor in a helical pattern, like the threads on a screw, to keep the center conductor in place. If loosely wrapped, this arrangement incorporates a considerable amount of air into the dielectric structure, creating a mixed dielectric (see Section 2.12.2, "Rule of Mixtures"), the effective dielectric constant of which is guaranteed to be less than the base material. The speed of propagation is therefore always faster on a helically wrapped coaxial cable than on a cable with a homogeneous dielectric made of the same material. A very low-density wrap drops the dielectric constant almost to unity.
The reduced dielectric constant of a helically wrapped cable lowers its capacitance per foot , thereby raising the cable impedance. To bring the impedance back down to its target value, the manufacturer then has the option of increasing the center conductor diameter. The resulting structure enjoys a much-reduced high-frequency loss as compared to a version of the same cable with a solid dielectric for two reasons. First, the loss tangent of the dielectric is reduced due to the incorporation of air (see Section 2.12.3, "Calculating the Loss Tangent for a Uniform Dielectric Mixture"). Second, the skin-effect losses are reduced due to the use of the larger center conductor made possible by the lowered dielectric constant. Both advantages accrue to any cable that incorporates air into the dielectric material.
Figure 10.2. Foaming the dielectric (adding air bubbles ) reduces the effective electric permittivity, decreasing delay, increasing speed, and reducing high-frequency losses.
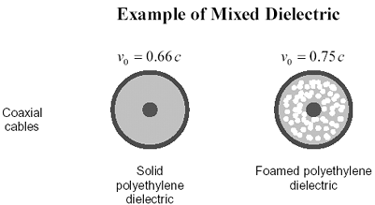
Another way to decrease the effective dielectric constant of a coaxial cable is to inject air bubbles during the extrusion process. This may be done mechanically or using a chemical means to induce foaming of the dielectric. Such materials are called foamed , or cellular , dielectrics. Cables formed from such materials exhibit a faster propagation velocity and less high-frequency loss than their solid-dielectric counterparts.
Any air-mixture process can work, provided that the vesicles of air are small compared to the wavelength of the signals conveyed and are uniformly distributed. Foamed or cellular materials, being mostly air, are less sensitive to variations in temperature than are solid-dielectric materials.
The many possible combinations of stranding, surface plating, types of shielding, and dielectric composition make it almost impossible to accurately predict the performance of a coaxial cable from the basic information provided on a datasheet. Fortunately, the coaxial cable propagation model is fairly adaptable. By optimizing three parameters, you can easily produce a model that mimics the performance of just about any coaxial cable (see Section 8.1.2, "Adapting the Metallic-Transmission Model"). Final (optimized) model parameters for popular Belden cable types appear in Table 10.4.
Table 10.4. Worst-Case Transmission Line Parameters for Selected Belden Coaxial Cables (all values optimized for use over the range 1MHz to 1000MHz)
|
Parameter |
8216 |
84316 |
8259 |
8240 |
84303 |
8237 |
|---|---|---|---|---|---|---|
|
Z ( W ) |
50 |
50 |
50 |
51.5 |
50 |
50 |
|
v /c |
.660 |
.695 |
.66 |
.660 |
.695 |
.66 |
|
R DC ( W /m) |
.353 |
.297 |
.0488 |
.0463 |
.0676 |
.0102 |
|
R ( W /m) |
.932 |
.948 |
.533 |
.395 |
.418 |
.206 |
|
q |
.00205 |
.00099 |
.00210 |
.00112 |
.00066 |
.00005 |
|
w (rad/sec) |
2 p ·10 7 |
2 p ·10 7 |
2 p ·10 7 |
2 p ·10 7 |
2 p ·10 7 |
2 p ·10 7 |
A perfect match is impossible to achieve. If you check the vendors ' specifications for each cable, you will see that they contain some apparent wobbles and bumps in the cable response specifications. No doubt these are the vestigial result of now-long-forgotten battles over compatibility with various cable types as they existed at the time the specification was created. Such is life. People who like to construct even more rigorous cable models for their testing generally either add another 2 dB of fixed, flat loss or extend the simulated maximum cable length by another 10% to 20%.
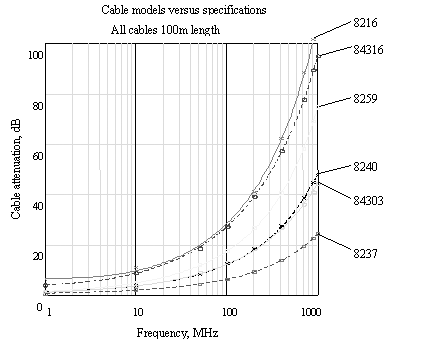
Figure 10.3 compares the loss calculations based on the models in Table 10.4 with published cable specifications. Predicted system step-response waveforms for 100 m of each cable type are provided in Figure 10.4. The step response duration for these cables scales roughly in proportion to the square of cable length.
Figure 10.3. Comparison of attenuation computed by continuous-frequency model to Belden cable specifications.
The main difference between these cables is their raw size. The 8216 (RG-174) and 84315 (RG-316/U) cables are the smallest, with a jacket diameter of only 1/10 inch. These are about the smallest coaxial cables for which you can get standard crimp-on BNC connectors.
The next group of cables have an outside jacket diameter of 2/10 inch. This group includes 8259 (RG-58/U), 8240 (RG-58/U), and 84303 (RG-303/U).
The largest cable is the 8237 (RG-8/U). It is a massive cable, with a 0.405-inch jacket diameter. This cable is extremely difficult to maneuver and install, but has the best electrical performance of the group.
Figure 10.4. Comparison of worst-case step-response waveforms for six different Belden cable types. All cables 100 m length.
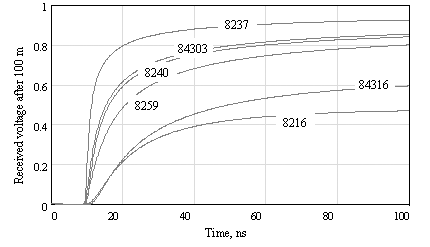
The raw size has more to do with high-frequency performance than any other single factor. The circumference of the conducting elements determines the skin-effect losses, which dominate the performance of the cable. Bigger cables almost always exhibit less loss.
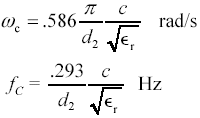
The only limitation to the use of very large cables is the existence of non-TEM modes of propagation that may occur in circular waveguides. The lowest -order such mode is termed the cutoff frequency f c for the waveguide .
Equation 10.7
|
where |
d 2 is the inside diameter of the shield, m, |
|
|
|
|
c is the velocity of light, 2.998 ·10 8 m/s. |
In the case of RG-58 having a core diameter of b = 2.95 mm and  r = 2.3, the lowest-order non-TEM mode appears at f c = 19.7 GHz. Operation of this cable at or above 19.7 GHz begs for trouble. The bigger the cable, the lower the cutoff frequency.
Secondary differences between the cables involve the surface treatment on the conductors and the dielectric composition.
The main difference between the 8240 and 8259 cables is that the center conductor on the 8240 is bare solid copper, while the center conductor on the 8259 is both solder-tinned and stranded. Tinned conductors are easy to work with and don't corrode, but these features come at the cost of much increased cable attenuation. Stranding makes the center conductor more flexible and easy to work, but the surface roughness again increases the attenuation.
Plating the center conductor with silver works in the opposite direction. Silver plating helps reduce the attenuation. The resistivity of silver is about 8% less than copper. That's the approach taken in the 84303 cable. This cable also uses a TFE Teflon dielectric, which has a slightly lower dielectric constant compared to polyethylene (2.1 versus 2.6). For the same capacitance per foot, Belden can afford to fatten the center conductor, which again reduces the attenuation. This benefit must be traded off against the slight deterioration in dielectric loss of TFE Teflon versus polyethylene. The 84303 cable performs electrically a little better than the 8240. The same differences (silver-coated center conductor and TFE Teflon dielectric) distinguish the 84316 cable from the 8216.
If performance is super-critical in your application, ask for sweep- tested cable. That means the manufacturer actually tested the frequency response of the cable after it was made. This testing costs extra but roots out various manufacturing problems that can create subtle, annoying, repetitive defects in the cable structure. These repetitive defects can cause lumps in the frequency response. High-end video applications, for example, use sweep-tested cables.
POINTS TO REMEMBER
- A good coaxial cable presents a nearly uniform impedance at all frequencies above the onset of the skin effect.
- Coaxial cables formed from foamed, cellular, or helically-wrapped dielectrics exhibit a faster propagation velocity and less high-frequency loss than their solid-dielectric counterparts.
- The step response duration for a coaxial cable scales roughly in proportion to the square of cable length.
10.1.1 Stranded Center-Conductors
To increase the mechanical flexibility of a cable, many manufacturers use a stranded center conductor. Patterns of either 7 or 19 wires are common (Figure 10.5). The effective diameter of a 7-way strand, for the purposes of computing the skin-effect resistance, is 2.63 times the diameter of each individual wire. The effective diameter of a 19-way strand , for the purposes of computing the skin-effect resistance, is 4.23 times the diameter of each individual wire.
Figure 10.5. For the purpose of computing skin-effect losses, the effective diameter of a stranded configuration is less than the maximal outside diameter of the configuration.
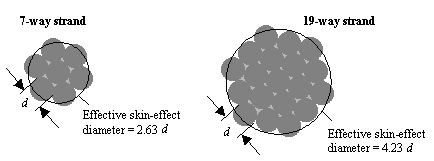
The effective diameter in each case was computed using a 2-dimensional method-of-moments field solver assuming a 50-ohm cable with a solid polyethelyne dielectric. A total of 120 line segments approximated the outer perimeter of the 7-strand or 19-strand configurations during this calculation. Other combinations of characteristic impedance and dielectric will return similar values of effective diameter.
The effective diameters for computing the DC resistances of these stranded-configuration wires are  and
and  times respectively, the diameters of the individual wires in each case.
10.1.2 Why 50 Ohms?
POINT TO REMEMBER
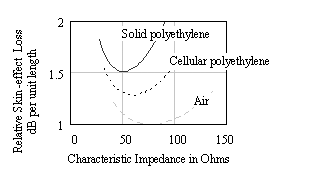
- A characteristic impedance of approximately 50 W minimizes the skin-effect losses in a solid-polyethylene coaxial cable.
10.1.3 50-Ohm Mailbag
[85] The following Web page nicely explains the whole optimum-loss problem: www.ece.wpi.edu/courses/ee535/hwk97/hwk2cd97/mrosner/mrosner.html.
POINTS TO REMEMBER
- Wimpy drivers appreciate higher-impedance transmission lines.
- I consider IBM's selection of 150- W for STP-A a goof.
- 50- W coax is less sensitive than 75- W coax to reflections caused by transceiver taps.
Fundamentals
- Impedance of Linear, Time-Invariant, Lumped-Element Circuits
- Power Ratios
- Rules of Scaling
- The Concept of Resonance
- Extra for Experts: Maximal Linear System Response to a Digital Input
Transmission Line Parameters
- Transmission Line Parameters
- Telegraphers Equations
- Derivation of Telegraphers Equations
- Ideal Transmission Line
- DC Resistance
- DC Conductance
- Skin Effect
- Skin-Effect Inductance
- Modeling Internal Impedance
- Concentric-Ring Skin-Effect Model
- Proximity Effect
- Surface Roughness
- Dielectric Effects
- Impedance in Series with the Return Path
- Slow-Wave Mode On-Chip
Performance Regions
- Performance Regions
- Signal Propagation Model
- Hierarchy of Regions
- Necessary Mathematics: Input Impedance and Transfer Function
- Lumped-Element Region
- RC Region
- LC Region (Constant-Loss Region)
- Skin-Effect Region
- Dielectric Loss Region
- Waveguide Dispersion Region
- Summary of Breakpoints Between Regions
- Equivalence Principle for Transmission Media
- Scaling Copper Transmission Media
- Scaling Multimode Fiber-Optic Cables
- Linear Equalization: Long Backplane Trace Example
- Adaptive Equalization: Accelerant Networks Transceiver
Frequency-Domain Modeling
- Frequency-Domain Modeling
- Going Nonlinear
- Approximations to the Fourier Transform
- Discrete Time Mapping
- Other Limitations of the FFT
- Normalizing the Output of an FFT Routine
- Useful Fourier Transform-Pairs
- Effect of Inadequate Sampling Rate
- Implementation of Frequency-Domain Simulation
- Embellishments
- Checking the Output of Your FFT Routine
Pcb (printed-circuit board) Traces
- Pcb (printed-circuit board) Traces
- Pcb Signal Propagation
- Limits to Attainable Distance
- Pcb Noise and Interference
- Pcb Connectors
- Modeling Vias
- The Future of On-Chip Interconnections
Differential Signaling
- Differential Signaling
- Single-Ended Circuits
- Two-Wire Circuits
- Differential Signaling
- Differential and Common-Mode Voltages and Currents
- Differential and Common-Mode Velocity
- Common-Mode Balance
- Common-Mode Range
- Differential to Common-Mode Conversion
- Differential Impedance
- Pcb Configurations
- Pcb Applications
- Intercabinet Applications
- LVDS Signaling
Generic Building-Cabling Standards
- Generic Building-Cabling Standards
- Generic Cabling Architecture
- SNR Budgeting
- Glossary of Cabling Terms
- Preferred Cable Combinations
- FAQ: Building-Cabling Practices
- Crossover Wiring
- Plenum-Rated Cables
- Laying Cables in an Uncooled Attic Space
- FAQ: Older Cable Types
100-Ohm Balanced Twisted-Pair Cabling
- 100-Ohm Balanced Twisted-Pair Cabling
- UTP Signal Propagation
- UTP Transmission Example: 10BASE-T
- UTP Noise and Interference
- UTP Connectors
- Issues with Screening
- Category-3 UTP at Elevated Temperature
150-Ohm STP-A Cabling
- 150-Ohm STP-A Cabling
- 150- W STP-A Signal Propagation
- 150- W STP-A Noise and Interference
- 150- W STP-A: Skew
- 150- W STP-A: Radiation and Safety
- 150- W STP-A: Comparison with UTP
- 150- W STP-A Connectors
Coaxial Cabling
- Coaxial Cabling
- Coaxial Signal Propagation
- Coaxial Cable Noise and Interference
- Coaxial Cable Connectors
Fiber-Optic Cabling
- Fiber-Optic Cabling
- Making Glass Fiber
- Finished Core Specifications
- Cabling the Fiber
- Wavelengths of Operation
- Multimode Glass Fiber-Optic Cabling
- Single-Mode Fiber-Optic Cabling
Clock Distribution
- Clock Distribution
- Extra Fries, Please
- Arithmetic of Clock Skew
- Clock Repeaters
- Stripline vs. Microstrip Delay
- Importance of Terminating Clock Lines
- Effect of Clock Receiver Thresholds
- Effect of Split Termination
- Intentional Delay Adjustments
- Driving Multiple Loads with Source Termination
- Daisy-Chain Clock Distribution
- The Jitters
- Power Supply Filtering for Clock Sources, Repeaters, and PLL Circuits
- Intentional Clock Modulation
- Reduced-Voltage Signaling
- Controlling Crosstalk on Clock Lines
- Reducing Emissions
Time-Domain Simulation Tools and Methods
- Ringing in a New Era
- Signal Integrity Simulation Process
- The Underlying Simulation Engine
- IBIS (I/O Buffer Information Specification)
- IBIS: History and Future Direction
- IBIS: Issues with Interpolation
- IBIS: Issues with SSO Noise
- Nature of EMC Work
- Power and Ground Resonance
Points to Remember
Appendix A. Building a Signal Integrity Department
Appendix B. Calculation of Loss Slope
Appendix C. Two-Port Analysis
- Appendix C. Two-Port Analysis
- Simple Cases Involving Transmission Lines
- Fully Configured Transmission Line
- Complicated Configurations
Appendix D. Accuracy of Pi Model
Appendix E. erf( )
Notes
EAN: N/A
Pages: 163


 from the operative terms (1+ d 2 / d 1 )/ln( d 2 / d 1 ) that control the position of the minimum. Examination of the operative terms reveals that the position of the minima is a function only of the ratio d 2 / d 1 , and not of either