UTP Transmission Example: 10BASE-T
UTP Transmission Example 10BASE T
The 10BASE-T system operates at 10 Mbaud on category 3 cable (Figure 8.4). It uses Manchester coding, which generates either one or two signal transitions per data bit. Let's do a set of system simulations of 10BASE-T signaling using cable lengths from 10 to 100 meters . These simulations highlight the effects of the cable transfer function. They use the worst-case category 3 cable model (at 20 °C), but no other system imperfections. The transmitted rise/fall time is 30 ns.
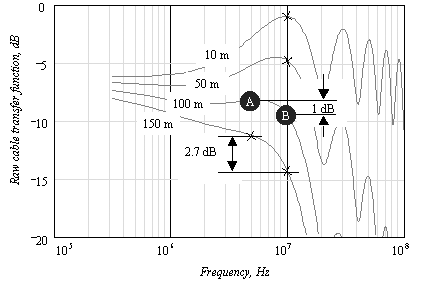
Figure 8.4. Raw transfer function of worst-case category 3 UTP at various lengths.
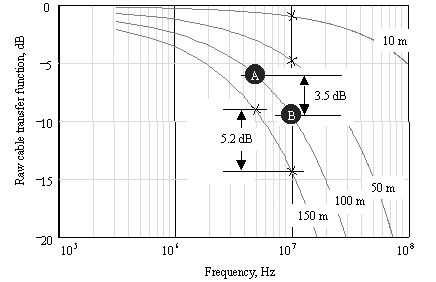
Figure 8.4 shows the raw cable frequency response for a variety of lengths. On each plot, I've marked the attenuation for each length at a frequency of 10 MHz, which corresponds to the maximum alternation rate for the 10 Mb/s Manchester-coded signal.
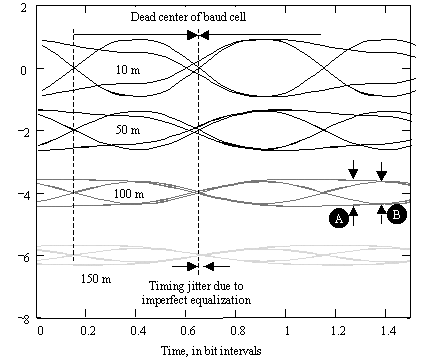
The 10-m cable gives an attenuation at 10 MHz of 1 dB. This produces in Figure 8.5 a near-perfect eye pattern. Note that I've set the transmitted signal rise/fall time to 30 ns, a value commonly used in the industry. This setting reduces the spectral content above 30 MHz, which helps to meet FCC and EN emissions regulations.
Figure 8.5. Eye patterns for unequalized Manchester coding. Data rate = 10 Mb/s, transmit rise/fall = 30 ns, cable = worst-case category 3 UTP at 20 °C.
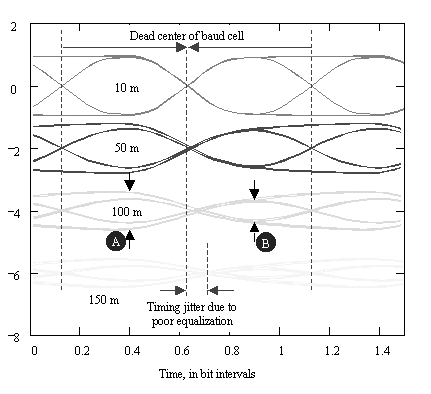
The 50-m cable gives an attenuation at 10 MHz of roughly 5 dB. The eye still looks okay. This is a good general lesson in cable equalization: 5 dB of attenuation at the maximum alternation rate doesn't distort a Manchester-coded signal very much.
The 100-m cable gives an attenuation at 10 MHz of almost 10 dB. The eye here shows some asymmetry, but still looks easily recoverable. Looking back at the attenuation curve, let's compare the attenuation at 10 MHz (the maximum alternation rate) and 5 MHz (the minimum alternation rate for Manchester coding). The difference is about 3.5 dB. This difference corresponds roughly to the difference in heights between the minimum-alternation-rate (maximum run length) eye height (A) and the maximum-alternation-rate amplitude (B) in Figure 8.5. This is about as far as you want to take a nonequalized Manchester system. For any coding system, when the attenuation difference between the maximum alternation frequency and the minimum alternation frequency [66] exceeds 3.5 dB, the eye pattern suffers.
[66] The minimum alternation frequency for uncoded random binary data is zero. The minimum alternation frequency for a code designed to equalize the DC balance ( numbers of 1s and 0s) over each code groups of n baud intervals and having a baud period of b equals approximately 1/(2 nb ).
The 150-m cable goes too far. At this distance the 10-MHz attenuation is roughly 15 dB, and the difference between the 5 and 10 MHz attenuation figures has grown to 5.2 dB. The zero crossings of the received data show noticeable amounts of timing jitter, and the noise margin is severely compromised.
From Figure 8.5 you can see that the received data amplitude at 150 meters is a function of past history. That is, the second 1 of a 1,1 pattern comes in larger than a 1 that follows a 0. This larger received amplitude then takes longer to come down on the next stroke, causing timing jitter. If the received amplitude could be made independent of data pattern history, the timing jitter would be improved. This is the principle of equalization:
The timing jitter is improved when all received amplitudes are independent of past history .
To equalize the received amplitudes, we could ask the transmitter to please transmit a smaller-than-normal pulse when following a baud with the same polarity. One of the many possible circuits used to accomplish this trick appears in Figure 8.6. Any circuit that modulates the transmit amplitude in order to better equalize the signal at the end of a long cable is called a pre-emphasis circuit.
Figure 8.6. Effective transfer function of 10BASE-T transmit pre-emphasis filter.
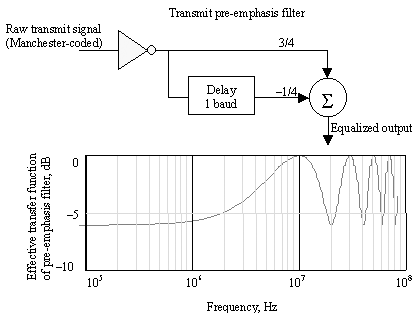
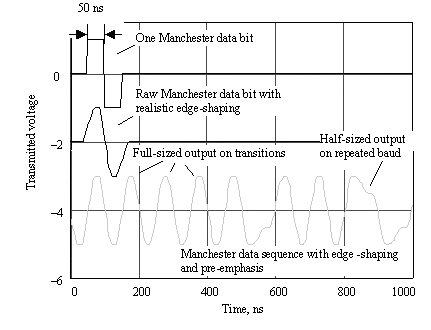
The circuit in Figure 8.6 assumes the Manchester-coded data takes on values of 1 or “1 in each successive baud [67] . The circuit takes 3/4 of the normal transmit signal and subtracts from that value 1/4 of the signal from one baud earlier. Whenever the raw transmit signal is the same in two successive 1/2-baud intervals, the net result is a signal of 1/2 size. Whenever the raw transmit signal executes a transition, successive 1/2-baud intervals will have opposite polarities, and the net result will be a signal having full value. The equalized output appears in Figure 8.7.
[67] Manchester coding generates two bauds for each transmitted bit. The transmitted baud rate therefore equals twice the bit rate. To send a logical 1, the Manchester coder generates the pattern 1, “1. To send a logical 0, the Manchester coder generates a pattern “1, 1. This is one possible variation of Manchester coding that guarantees a transition in the middle of each bit cell. An alternate definition might guarantee a transition at the beginning of each cell, with a transition either present or missing in the center of the cell to indicate data values of 1 or 0.
Figure 8.7. 10BASE-T transmitted waveforms with edge-shaping and pre-emphasis.
This circuit operates like a filter, with a frequency-domain transfer function equal to 3/4 “ ¼ e “ j2 p fb , where b is the Manchester baud period. The transfer function magnitude is plotted in Figure 8.6. The transfer function attenuates all signals below 1 MHz by about 6 dB. At 5 MHz the attenuation is “2.5 dB, and at 10 MHz, the attenuation is zero. That looks just about like what we need. The difference between the 10-MHz attenuation and the 5-MHz attenuation is +2.5 dB, which should help correct the negative 3.5-dB slope of the 100 m category 3 UTP cable response. The peculiar behavior of the circuit at frequencies above 20 MHz is of little consequence, as the transmit edge-shaping heavily attenuates all signal power in that band .
A family of composite (equalizer plus cable) frequency response curves is presented in Figure 8.8. The transmitted waveform contains very little power at frequencies above 20 MHz, so the lumps in the equalized transfer function at 30 MHz, 50 MHz, and beyond will not affect the received signal quality.
Figure 8.8. Equalized transfer functions for worst-case category 3 UTP at various lengths.
The equalized system eye patterns are shown in Figure 8.9. As you can see, the lower two eye patterns (100 m and 150 m) appear much better than in the unequalized system. In the lower two waveforms the mid-baud zero crossing occurs much closer to the dead center of the baud cell. This improvement in timing jitter makes life a lot easier on the clock recovery circuits. Also, the noise margin has improved. All around, it's a better system.
Figure 8.9. Equalized eye patterns for Manchester coding. Data rate = 10 Mb/s, transmit rise/fall = 30 ns, cable = worst-case category 3 UTP at 20 °C.
I should point out that all the eye pattern waveforms in this section show the signal at the end of a single segment of worst-case cable. This signal may not be the same as the signal present at the discriminator circuit in a practical receiver, due to the use of low-pass filtering in the receiver front end used to control noise. The receiver's low-pass filter in most cases introduces further pattern-selective degradation of the received amplitude and additional jitter. Other system imperfections, such as work-area cables, jumpers , reflections, near-end crosstalk (NEXT), and alien crosstalk, are similarly not incorporated into the figure.
The pre-emphasis circuit helps at long cable lengths but makes things worse at short cable lengths. For example, at 10 m the pre-emphasis causes noticeable overshoot of the transitions in Figure 8.9. In a two-level system this overshoot is of little consequence, because only the polarity of the received signal matters, not its amplitude.
At short lengths, the pre-emphasis also induces unwanted jitter on the transitions. Fortunately, any clock timing jitter contributed by the overshoot is more than compensated in the receiver noise budget by the presence of the absolutely enormous incoming signal level. At 100 m, where you need good jitter performance, the timing looks superb.
In a multilevel transmission system, overshoot can become a very serious issue. It can significantly confuse the receiver. The more levels that exist in a transmission scheme, the more accurately one must equalize. To achieve the requisite accuracy, equalizer circuits for multilevel coding usually incorporate some form of automated adaptation.
For a two-level system, the simple fixed pre-emphasis circuit presented in this section boosts the maximum operational cable length by at least 50%. I should point out that the Manchester equalizer is a particularly simple case, because with Manchester coding the majority of the signal energy in the data signal is contained within the band between 5 MHz and 10 MHz. The equalizer need only flatten the received signal spectrum over this relatively narrow band. Uncoded random binary data (NRZ coding), which produces a wider ratio between the high and low band edges of its data spectrum, demands equalization over a wider range of frequencies.
A more sophisticated adaptive equalizer, to the extent that it can maintain a constant gain over the range of frequencies contained in the data signal, will permit operation at even greater distances. Adaptively equalized systems commonly boost the maximum operational cable length by 100% or more.
POINTS TO REMEMBER
- Timing jitter is improved when all received amplitudes are independent of past history.
- Simple fixed pre-emphasis boosts the maximum operational cable length of a Manchester-coded link by at least 50%.
- A more sophisticated adaptive equalizer can extend operation to even greater distances.
Fundamentals
- Impedance of Linear, Time-Invariant, Lumped-Element Circuits
- Power Ratios
- Rules of Scaling
- The Concept of Resonance
- Extra for Experts: Maximal Linear System Response to a Digital Input
Transmission Line Parameters
- Transmission Line Parameters
- Telegraphers Equations
- Derivation of Telegraphers Equations
- Ideal Transmission Line
- DC Resistance
- DC Conductance
- Skin Effect
- Skin-Effect Inductance
- Modeling Internal Impedance
- Concentric-Ring Skin-Effect Model
- Proximity Effect
- Surface Roughness
- Dielectric Effects
- Impedance in Series with the Return Path
- Slow-Wave Mode On-Chip
Performance Regions
- Performance Regions
- Signal Propagation Model
- Hierarchy of Regions
- Necessary Mathematics: Input Impedance and Transfer Function
- Lumped-Element Region
- RC Region
- LC Region (Constant-Loss Region)
- Skin-Effect Region
- Dielectric Loss Region
- Waveguide Dispersion Region
- Summary of Breakpoints Between Regions
- Equivalence Principle for Transmission Media
- Scaling Copper Transmission Media
- Scaling Multimode Fiber-Optic Cables
- Linear Equalization: Long Backplane Trace Example
- Adaptive Equalization: Accelerant Networks Transceiver
Frequency-Domain Modeling
- Frequency-Domain Modeling
- Going Nonlinear
- Approximations to the Fourier Transform
- Discrete Time Mapping
- Other Limitations of the FFT
- Normalizing the Output of an FFT Routine
- Useful Fourier Transform-Pairs
- Effect of Inadequate Sampling Rate
- Implementation of Frequency-Domain Simulation
- Embellishments
- Checking the Output of Your FFT Routine
Pcb (printed-circuit board) Traces
- Pcb (printed-circuit board) Traces
- Pcb Signal Propagation
- Limits to Attainable Distance
- Pcb Noise and Interference
- Pcb Connectors
- Modeling Vias
- The Future of On-Chip Interconnections
Differential Signaling
- Differential Signaling
- Single-Ended Circuits
- Two-Wire Circuits
- Differential Signaling
- Differential and Common-Mode Voltages and Currents
- Differential and Common-Mode Velocity
- Common-Mode Balance
- Common-Mode Range
- Differential to Common-Mode Conversion
- Differential Impedance
- Pcb Configurations
- Pcb Applications
- Intercabinet Applications
- LVDS Signaling
Generic Building-Cabling Standards
- Generic Building-Cabling Standards
- Generic Cabling Architecture
- SNR Budgeting
- Glossary of Cabling Terms
- Preferred Cable Combinations
- FAQ: Building-Cabling Practices
- Crossover Wiring
- Plenum-Rated Cables
- Laying Cables in an Uncooled Attic Space
- FAQ: Older Cable Types
100-Ohm Balanced Twisted-Pair Cabling
- 100-Ohm Balanced Twisted-Pair Cabling
- UTP Signal Propagation
- UTP Transmission Example: 10BASE-T
- UTP Noise and Interference
- UTP Connectors
- Issues with Screening
- Category-3 UTP at Elevated Temperature
150-Ohm STP-A Cabling
- 150-Ohm STP-A Cabling
- 150- W STP-A Signal Propagation
- 150- W STP-A Noise and Interference
- 150- W STP-A: Skew
- 150- W STP-A: Radiation and Safety
- 150- W STP-A: Comparison with UTP
- 150- W STP-A Connectors
Coaxial Cabling
- Coaxial Cabling
- Coaxial Signal Propagation
- Coaxial Cable Noise and Interference
- Coaxial Cable Connectors
Fiber-Optic Cabling
- Fiber-Optic Cabling
- Making Glass Fiber
- Finished Core Specifications
- Cabling the Fiber
- Wavelengths of Operation
- Multimode Glass Fiber-Optic Cabling
- Single-Mode Fiber-Optic Cabling
Clock Distribution
- Clock Distribution
- Extra Fries, Please
- Arithmetic of Clock Skew
- Clock Repeaters
- Stripline vs. Microstrip Delay
- Importance of Terminating Clock Lines
- Effect of Clock Receiver Thresholds
- Effect of Split Termination
- Intentional Delay Adjustments
- Driving Multiple Loads with Source Termination
- Daisy-Chain Clock Distribution
- The Jitters
- Power Supply Filtering for Clock Sources, Repeaters, and PLL Circuits
- Intentional Clock Modulation
- Reduced-Voltage Signaling
- Controlling Crosstalk on Clock Lines
- Reducing Emissions
Time-Domain Simulation Tools and Methods
- Ringing in a New Era
- Signal Integrity Simulation Process
- The Underlying Simulation Engine
- IBIS (I/O Buffer Information Specification)
- IBIS: History and Future Direction
- IBIS: Issues with Interpolation
- IBIS: Issues with SSO Noise
- Nature of EMC Work
- Power and Ground Resonance
Points to Remember
Appendix A. Building a Signal Integrity Department
Appendix B. Calculation of Loss Slope
Appendix C. Two-Port Analysis
- Appendix C. Two-Port Analysis
- Simple Cases Involving Transmission Lines
- Fully Configured Transmission Line
- Complicated Configurations
Appendix D. Accuracy of Pi Model
Appendix E. erf( )
Notes
EAN: N/A
Pages: 163
