Equivalence Principle for Transmission Media
Figure 3.37 shows the transfer function and step response of six selected Belden coaxial cable types, at a fixed length of 25 meters . Eye diagrams for all six cable types appear in Figure 3.38. Of the six types, the 8237-type cable delivers the best transfer function (least loss) and the best step response ( fastest risetime).
Figure 3.37. Frequency-response and step-response graphs for selected Belden coaxial cable types.
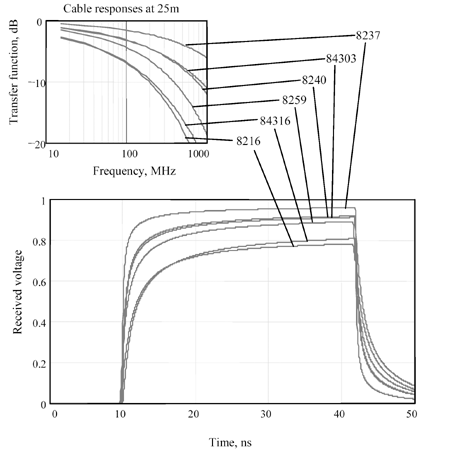
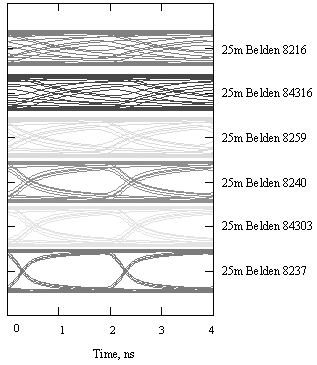
Figure 3.38. The eye quality for six selected Belden coaxial cable types at a data rate of 500 Mb/s and a fixed cable length of 25 m varies dramatically.
Suppose you are planning to use these cables in a communication system operating at a distance of 25 m and a speed of 500 Mbaud. You can determine the likelihood of success by a simple examination of the transfer function. The key item to observe is the gross attenuation in dB at 1/2 the data rate (250 MHz).
The 8237-type cable at a length of 25 m clearly attenuates less than 3 dB at 250 MHz, meaning that the opening at the center of the eye when transmitting a continuous 101010.... pattern will likely be larger than 70%. Keep in mind that this is not an exact calculation because your data pattern consists of square waves, not sine waves, but for planning purposes it is quite useful. Figure 3.38 shows the calculated eye patterns, taking into account the limited risetime of the driver and the complete frequency response of the cable.
The next two cable types (84303 and 8240) have more attenuation at 250 MHz and so deliver more eye-pattern distortion. The next cable type (8259) is marginal, and the last two cable types (84316 and 8216) exhibit far too much attenuation at 250 MHz. The eye diagrams for these last two cable types are practically closed. Apparently, the performance of these coaxial cable types varies tremendously as a function of the construction.
Even though the performance varies widely, the cables still bear remarkable similarity to one another. You can see the similarity best in Figure 3.1, which shows the same six coaxial-cable curves plotted on a logarithmic vertical axis (log-of-dB). Over the frequency range from 10 to 1000 MHZ the slopes of all the cable responses are the same, because all six cables happen to operate in the same mode (the skin-effect limited mode) over this range.
Over the frequency range 10 to 1000 MHz the six curves are just shifted copies of each other. That is, if you shift one curve vertically, it will overlay almost perfectly on top of any of the other curves. Of course there are limits to the application of this rule. For example, over the range between 0.1 and 10 MHz the various cables transition into the skin-effect region at different points. Over the more limited range from 10 MHz to 1000 MHz, however, all six curves have a similar slope.
You can use this similarity to derive an equivalence relation between all six cables. This equivalence depends on the fact that the cable attenuation in dB scales linearly with distance. That is, if you take one particular cable and scale its length by a factor k , then the attenuation of that cable, as measured in dB, also scales by the same factor k . Since the vertical axis in Figure 3.1 is a logarithmic axis, scaling the attenuation in dB by k will raise (or lower) the attenuation curve by a fixed amount equal to log( k ). Scaling the length does not change the slope in Figure 3.1; it just raises or lowers the whole curve. Over the range of frequencies dominated by the skin effect, you can use this length-scaling principle to cause any cable to mimic the performance, of any other cable.
For example, suppose you adjust the length of each cable from Figure 3.37 to guarantee attenuation in each case at 250 MHz of, say, 3.5 dB. This adjustment slides the transfer curves in Figure 3.1 vertically until they all line up, passing through the same point at 250 MHz. Since they have the same slope over the range 10 to 1000 MHz, they will then each produce precisely the same transfer function in every way, with the exception of the bulk transport delay, which will be less on the shorter cables (see Figure 3.39).
Figure 3.39. Frequency-response and step-response graphs for specific lengths of selected Belden coaxial cable types, the length in each case chosen to create precisely 3.5 dB attenuation at 250 MHz.
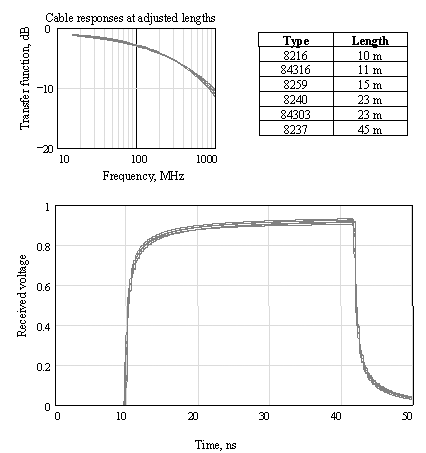
The selection of 3.5 dB as the point of similarity is arbitrary. The same theory works at any point. I chose 3.5 dB at 250 MHz because that is an aggressive specification for non-return-to-zero (NRZ) random binary signaling at 500 Mbps.
A DC-balanced data code having a strict guarantee of equal numbers of ones and zeros over some finite interval can get by with slightly more attenuation. In that case one typically strives to achieve no more than a 3.5 dB attenuation difference over the range between the lowest to the highest possible data frequencies.
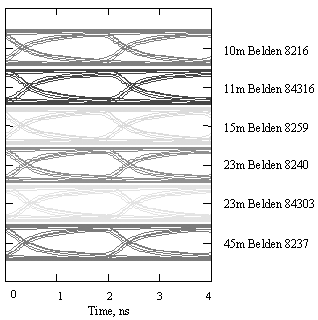
Figure 3.40 shows the resulting eye-patterns with each cable adjusted to a length that provides 3.5 dB of attenuation at 250 MHz. As you can see, the performance graphs for all cables at the new adjusted lengths are the same. For example, 45 meters of type 8237 cable gives the same performance as 23 meters of type 8240 cable over the frequency range from 10 to 1000 MHz. In a sense, all skin-effect-limited channels do the same thing. Almost any copper cable, if its length is adjusted properly, will generate the same eye pattern.
Figure 3.40. Eye diagrams for adjusted lengths of six selected Belden coaxial cable types at a data rate of 500 Mb/s.
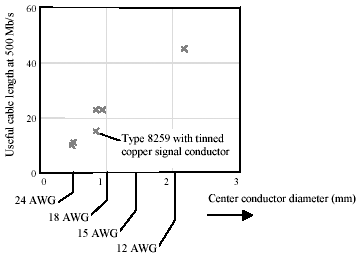
Also note that the adjusted lengths fall almost in direct proportion to the diameter of the center conductor (Figure 3.41). For its size, the type-8259 cable delivers the worst performance. This cable has a tinned center conductor that artificially raises the AC skin-effect resistance of the cable, thus lowering its bandwidth.
Figure 3.41. The 8259 cable has a tinned-copper center conductor, which raises the skin-effect resistance, limiting the distance at which it may be used.
POINT TO REMEMBER
- Over the range of frequencies dominated by the skin effect, you can scale the length of one coaxial cable type to cause it to mimic the performance of any other type.
Fundamentals
- Impedance of Linear, Time-Invariant, Lumped-Element Circuits
- Power Ratios
- Rules of Scaling
- The Concept of Resonance
- Extra for Experts: Maximal Linear System Response to a Digital Input
Transmission Line Parameters
- Transmission Line Parameters
- Telegraphers Equations
- Derivation of Telegraphers Equations
- Ideal Transmission Line
- DC Resistance
- DC Conductance
- Skin Effect
- Skin-Effect Inductance
- Modeling Internal Impedance
- Concentric-Ring Skin-Effect Model
- Proximity Effect
- Surface Roughness
- Dielectric Effects
- Impedance in Series with the Return Path
- Slow-Wave Mode On-Chip
Performance Regions
- Performance Regions
- Signal Propagation Model
- Hierarchy of Regions
- Necessary Mathematics: Input Impedance and Transfer Function
- Lumped-Element Region
- RC Region
- LC Region (Constant-Loss Region)
- Skin-Effect Region
- Dielectric Loss Region
- Waveguide Dispersion Region
- Summary of Breakpoints Between Regions
- Equivalence Principle for Transmission Media
- Scaling Copper Transmission Media
- Scaling Multimode Fiber-Optic Cables
- Linear Equalization: Long Backplane Trace Example
- Adaptive Equalization: Accelerant Networks Transceiver
Frequency-Domain Modeling
- Frequency-Domain Modeling
- Going Nonlinear
- Approximations to the Fourier Transform
- Discrete Time Mapping
- Other Limitations of the FFT
- Normalizing the Output of an FFT Routine
- Useful Fourier Transform-Pairs
- Effect of Inadequate Sampling Rate
- Implementation of Frequency-Domain Simulation
- Embellishments
- Checking the Output of Your FFT Routine
Pcb (printed-circuit board) Traces
- Pcb (printed-circuit board) Traces
- Pcb Signal Propagation
- Limits to Attainable Distance
- Pcb Noise and Interference
- Pcb Connectors
- Modeling Vias
- The Future of On-Chip Interconnections
Differential Signaling
- Differential Signaling
- Single-Ended Circuits
- Two-Wire Circuits
- Differential Signaling
- Differential and Common-Mode Voltages and Currents
- Differential and Common-Mode Velocity
- Common-Mode Balance
- Common-Mode Range
- Differential to Common-Mode Conversion
- Differential Impedance
- Pcb Configurations
- Pcb Applications
- Intercabinet Applications
- LVDS Signaling
Generic Building-Cabling Standards
- Generic Building-Cabling Standards
- Generic Cabling Architecture
- SNR Budgeting
- Glossary of Cabling Terms
- Preferred Cable Combinations
- FAQ: Building-Cabling Practices
- Crossover Wiring
- Plenum-Rated Cables
- Laying Cables in an Uncooled Attic Space
- FAQ: Older Cable Types
100-Ohm Balanced Twisted-Pair Cabling
- 100-Ohm Balanced Twisted-Pair Cabling
- UTP Signal Propagation
- UTP Transmission Example: 10BASE-T
- UTP Noise and Interference
- UTP Connectors
- Issues with Screening
- Category-3 UTP at Elevated Temperature
150-Ohm STP-A Cabling
- 150-Ohm STP-A Cabling
- 150- W STP-A Signal Propagation
- 150- W STP-A Noise and Interference
- 150- W STP-A: Skew
- 150- W STP-A: Radiation and Safety
- 150- W STP-A: Comparison with UTP
- 150- W STP-A Connectors
Coaxial Cabling
- Coaxial Cabling
- Coaxial Signal Propagation
- Coaxial Cable Noise and Interference
- Coaxial Cable Connectors
Fiber-Optic Cabling
- Fiber-Optic Cabling
- Making Glass Fiber
- Finished Core Specifications
- Cabling the Fiber
- Wavelengths of Operation
- Multimode Glass Fiber-Optic Cabling
- Single-Mode Fiber-Optic Cabling
Clock Distribution
- Clock Distribution
- Extra Fries, Please
- Arithmetic of Clock Skew
- Clock Repeaters
- Stripline vs. Microstrip Delay
- Importance of Terminating Clock Lines
- Effect of Clock Receiver Thresholds
- Effect of Split Termination
- Intentional Delay Adjustments
- Driving Multiple Loads with Source Termination
- Daisy-Chain Clock Distribution
- The Jitters
- Power Supply Filtering for Clock Sources, Repeaters, and PLL Circuits
- Intentional Clock Modulation
- Reduced-Voltage Signaling
- Controlling Crosstalk on Clock Lines
- Reducing Emissions
Time-Domain Simulation Tools and Methods
- Ringing in a New Era
- Signal Integrity Simulation Process
- The Underlying Simulation Engine
- IBIS (I/O Buffer Information Specification)
- IBIS: History and Future Direction
- IBIS: Issues with Interpolation
- IBIS: Issues with SSO Noise
- Nature of EMC Work
- Power and Ground Resonance
Points to Remember
Appendix A. Building a Signal Integrity Department
Appendix B. Calculation of Loss Slope
Appendix C. Two-Port Analysis
- Appendix C. Two-Port Analysis
- Simple Cases Involving Transmission Lines
- Fully Configured Transmission Line
- Complicated Configurations
Appendix D. Accuracy of Pi Model
Appendix E. erf( )
Notes
EAN: N/A
Pages: 163
