Technical Issues Related to IT Governance Tactics: Product Metrics, Measurements and Process Control
Technical Issues Related to IT Governance Tactics Product Metrics, Measurements and Process Control
Michalis Xenos
Hellenic Open University, Greece
Copyright 2004, Idea Group Inc. Copying or distributing in print or electronic forms without written permission of Idea Group Inc. is prohibited.
Abstract
This chapter deals with some technical aspects of the strategies for IT Governance described in most of the other chapters of this book. The practical application of IT Governance techniques and tactics requires the collection and analysis of measurable data that guide estimation, decision-making and assessment, since it is common sense that one can control and manage better what one is able to measure. This chapter aims at introducing the reader to product metrics and measurements, proposing methods relating to the implementation of a measurements program and analyzing how product metrics can be used to control IT development.
Focus is placed on product metrics, measurements and process control techniques. Such instruments can aid significantly in monitoring the development process and making IT-related tasks more transparent to IT managers. They also aid in design, prediction and assessment of the IT product quality. They provide data used for decision-making, cost and effort estimation, fault prevention, and testing time reduction. Moreover, the use of product metrics and process control techniques can direct the standardization of IT products and IT development process, as well as the assessment of the process maturity of outsourcing partners. The most commonly used metrics are presented and the reader is introduced to measurement techniques and automation tools. This chapter also discusses the application of metrics along with statistical process control tools. Finally, it provides suggestions on how product metrics can aid towards IT Governance not only in large IT companies, but also in the smaller ones.
Introduction
IT Governance is "the organizational capacity exercised by the board, executive management and IT management to control the formulation and implementation of IT strategy and in this way ensure the fusion of business and IT" (Van Grembergen, 2002). Previous chapters of this book have successfully introduced the reader to several IT Governance techniques and tactics that aid the board, executive and IT managers in monitoring, standardization, quality assessment, cost estimation and cost cut down; in short, they aid in controlling the IT process. The practical application of such techniques and tactics requires the collection and analysis of measurable data that guide estimation, decision-making and assessment. It is common sense that one can control and manage better what one is able to measure, as pointed out by DeMarco (DeMarco, 1982).
This is what product metrics do. They provide measurements of factors related to IT development that can be utilized as input to process control techniques. Product metrics, along with the measurement techniques used for their collection, constitute the means to measure desirable product characteristics and in this way allow control of the product development process. This chapter focuses on product metrics, measurements and process control techniques. Such instruments can aid significantly in monitoring the development process and making IT-related tasks more transparent to IT managers. They also aid in design, prediction and assessment of the IT product quality. They provide data used for decision-making, cost and effort estimation, fault prevention, and testing time reduction. Moreover, the use of product metrics and process control techniques can direct the standardization of IT products and IT development process, and the assessment of the process maturity of outsourcing partners.
Measurements and Process Control in the IT Industry
IT management and development has suffered from many disasters. Examples of such crises can be found in the classic article of Gibbs (Gibbs, 1994) describing software crises in both the private and government sectors. In other cases, the delivered IT quality suffers from such defects that can lead in significant losses. For instance, one of the recent US National Institute of Standards and Technology reports states that insufficient software costs the US as much as US $59 billion a year and that up to US$22 billion of that could be saved if licensed software had just 50% fewer defects (Miller & Ebert, 2002). These facts lead to a reasonable question: How can IT management be aided in reducing errors and improving IT quality? Two of the means significantly aiding towards this direction are software metrics and process control techniques. Such metrics and techniques are extensively used in the current IT development industry and form an inseparable part of the development process of companies that have achieved CMM fourth and fifth levels, as documented in recent reports (McGarry & Decker, 2002).
Metrics are used in IT development process to measure various factors related to software quality and can be classified as product metrics, process metrics and recourse metrics. Product metrics are also called software metrics. These are metrics that are directly related to the product itself, such as code statements, delivered executables, and manuals, and strive to measure product quality, or attributes of the product that can be related to product quality. Process metrics focus on the process of IT development and measure process characteristics, aiming to detect problems or to push forward successful practices. Resource metrics are related to the resources required for IT development and their performance. This chapter focuses on product metrics and how such metrics can aid towards IT development process control and respectively towards IT Governance.
This Chapter
It could be said that this chapter deals with some technical aspects of the strategies for IT Governance described in most of the other chapters of this book. Having read about different strategies and tactics for IT Governance (see the relevant chapter) the reader is now introduced to metrics and how these can aid IT managers. Issues such as cost estimation, monitoring the IT development process, diagnosing the IT development effectiveness, decision making on outsourcing and integration, and quality assessment can be achieved more easily with the use of metrics and process control.
In order to present examples of the techniques covered, this chapter goes into some technical details that require knowledge of basic software engineering principles and statistical control. Such technical details are presented using smaller fonts. If the reader is not interested in them, he may skip areas marked with smaller fonts and still be able to follow the main objectives of the chapter.
This chapter aims at introducing the reader to product metrics and measurements, proposing methods relating to the implementation of a measurements program and analyzing how product metrics can be used to control IT development.
What this chapter presents is an overview of software metrics and measurement techniques. The most commonly used metrics are presented and the reader is introduced to measurement techniques and automation tools. Furthermore, emphasis is placed on the correlation of internal metrics with external product quality characteristics by combining internal and external measurements. Finally, this chapter discusses the application of metrics along with statistical process control tools. Such tools aim at keeping the IT development process under control. Emphasis has also been placed on the argument that product metrics can be utilized not only by large IT developing enterprises, but also by smaller or medium-size ones, since in many cases the misinter- pretation of measurements in small and medium enterprises has led to the belief that product metrics are only meant for large companies. This chapter provides suggestions on how product metrics can aid towards better IT Governance not only in major IT companies, but also in the smaller ones.
The chapter is organized as follows: the chapter begins with a literature review of product metrics, measurements and statistical process control. Next, the chapter discusses issues related to measurements, use of product metrics, correlation between internal and external measurements and the application of Statistical Process Control during IT development and offers solutions and recommendations. This is followed by a discusses on future trends and a summary of conclusions of this chapter.
Background
Metrics and Measurements
Measurement is the process by which numbers or symbols are assigned to attributes of entities in the real world in such a way as to describe them according to clearly defined rules (Fenton & Pfleeger, 1997). In IT development, measurements are conducted by using metrics. A metric is an empirical assignment of a value in an entity aiming to describe a specific characteristic of this entity. Measurements have been part of our everyday life for a long time and were introduced to IT Governance in order to satisfy the need to control IT development, since according to DeMarco (1982), IT development cannot be controlled if it cannot be measured.
The first software metrics were proposed in the mid '70s by McCabe (1976) and Halstead (1977), while the first practical use of metrics — in terms of correlation with development data — was presented by Funami and Halstead (1976). In the following years, a large number of software metrics were proposed, some of which still have practical use and can lead to improvements in IT development, while others proved to be quite impractical in certain occasions. The proliferation of metrics was followed by more practical proposals on how to interpret results from metrics, such as the one by Fitzsimmons and Love (1978) or the one by Shepperd and Ince (1990). A number of methods combining metrics into measurement methodologies were also presented, such as the ones proposed by Hansen (1978) and by Xenos and Christodoulakis (1994).
A company involved in IT development can select from a variety of applied metrics those that are more suitable to be included in its IT Governance techniques. This selection can be made from a large volume of proposed product metrics that include code metrics such as lines of code, software science metrics, complexity metrics, readability metrics such as the one proposed by Joergensen (1980), data metrics, nesting metrics, and structure metrics such as the one proposed by Henry and Kafura (1981). There are also process metrics, estimation metrics, design metrics, testing metrics, reliability metrics, maintainability metrics, reusability metrics, as well as metrics applied on specific programming languages, such as object-oriented metrics, or metrics for visual programming. Therefore, taking into account the volume of literature that exists about software metrics, it is no more a question of finding metrics for an IT project, rather than selecting the appropriate ones for better IT Governance. Given the great number of metrics (measuring almost everything), any attempt to select a metric without basing the selection on a detailed breakdown of the IT developing company needs and an extensive investigation of the proposed metric's applicability would result in minor benefits from its use or no benefits at all. To benefit from the use of metrics, apart from fully understanding the various existing metrics, one should also define well why one wants to measure, what to measure and when is the right time to measure it.
So the first question rising is: 'Why use metrics?' The answer to this question is that metrics are needed to provide understanding of different elements of IT projects. Since it is not always clear what causes an IT project to fail, it is essential for IT Governance to measure and record characteristics of good projects as well as bad ones. Metrics provide indicators for the developed software. As Ragland (1995) states, indicators are metrics or combinations of metrics that provide insights of the IT process, the software project, or the product itself. Measurements aim at the assessment of the status of the development process and the developed product. Therefore, metrics can be used for performance evaluation, cost estimation as Stamelos and Angelis (2001) have proposed, effort estimation, improving IT productivity, selecting best practices and — in general — for improving IT Governance.
This discussion leads to the next question: 'What to measure?' As previously mentioned, process and product are what we need to measure. One may argue that since the result of IT projects is software, what we need to measure is software and only software. This is not true. According to Deming (1986), if the product you have developed is erroneous, do not just fix the errors, but also fix the process that allowed the errors into the product. This way you will not have to keep fixing the error in subsequent productions. Therefore, both process and product metrics and measurements are important in IT Governance. You have already read about techniques for governing IT process in the other chapters of this book, including Statistical Process Control shortly described in this chapter. For this reason, the remaining part of this chapter focuses on the IT product itself; it focuses on product metrics.
The use of product metrics is highly related to the maturity of the IT development company. The adoption of standards such as the ISO 9001 (1991) or the CMM (Paulk, Curtis, Chrissis, & Weber, 1993) enforces a disciplined IT development process that has to be in control, therefore measured. Methods like Goal Question Metric (Solingen & Berghout, 1999) enable developers to implement realistic product metrics in the development process tailored to their needs. The more mature the company is with regard to the employment of IT Governance techniques, the more improved its measurement plan is and the more complex and detailed can be the metrics introduced into the IT development process.
It must be noted that before selecting the appropriate metrics, it is very important to define the desired product quality characteristics. The selection of these quality characteristics aids in defining what needs to be measured and what needs not, depending on the particular needs of the IT developing company. In the early 70's, McCall, Richards and Walters (1977) defined a framework for measuring such characteristics and proposed the Factors Criteria Metrics model — also known as FCM model — a model for defining what is software quality in terms of sub-characteristics. Incorporating FCM and experience from similar proposals, years later, the ISO standard ISO 9126 (1996) standardized what product quality is in terms of sub-characteristics. Therefore product metrics can be used within the IT development procedure in order to measure such product characteristics related to product quality. The amount and the identity of the characteristics to be measured are related to the IT Governance maturity and are further discussed in this chapter.
Having defined the goals and reasons for measuring, the next question that arises is: 'When to measure?' Although measurements should be conducted throughout the entire IT development life cycle, their scope varies depending on the IT development phase. Different measurement goals are defined at different development phases and therefore different kinds of metrics should be used. In the early phases of IT development, metrics are used mainly for estimation purposes. It is useful to collect metrics relating to different projects, so that they can serve as historical data for future projects, aiding in better IT Governance. As far as current projects are concerned, such data from past projects are used to assist in estimation (Putnam & Myers, 1992). E.g., size metrics are frequently used to predict the size of a new project. This is how COCOMO (Boehm, 1989), a well-known estimation model operates. Function points (Albrecht, 1979) are also commonly used for estimation.
In the intermediate phases of IT development process, metrics are used for project monitoring purposes while, in the meantime, code metrics are used to prevent errors. Furthermore, defect reports during testing are used for evaluating product quality and calibrating the measurement methods of the early phases. This purpose is also served by collecting external measurement data following project delivery, namely during the beta testing or maintenance phases of a project. So the time to measure is determined by the requirements and the aims of the measurement program and can vary from one IT project to another.
Summarizing, using an oversimplifying statement it could be said that metrics are an important instrument of IT Governance, aiding in making estimations in the early phases of an IT development project, preventing problems in intermediate phases and evaluating quality in the late project phases.
Statistical Process Control
Product metrics are essential instruments for the application of Statistical Process Control techniques into IT Governance. Statistical Process Control — briefly called SPC — is a collection of problem-solving tools useful in achieving process stability and improving capability (Montgomery, 1991). SPC has been successfully used by industry for the production of material goods aiming at the detection of non-conformity and the elimination of waste during production of such goods. The following paragraphs, in smaller fonts, discuss further some SPC technical details.
One of the concepts of SPC techniques is to monitor specific product quality characteristics over time. This is a way of monitoring whether the development process is 'in control', or whether it has become 'out of control' and consequently should be stopped and adjusted. Sample measurements relating to specific product characteristics are compared to each other using a control chart illustrating when problems occur in the development process and human intervention is required. Figure 1 is an example of a control chart. The vertical axis illustrates the values of the measured characteristic, while the horizontal axis represents periodical sample measurements. The measurement period may cover a few minutes or days or even weeks, although in industry it usually covers minutes rather than days or weeks. The center horizontal line represents the desired value of the measured characteristic — also called mean value, since in a process that is in control the mean value measured must be the desired one — while the other two horizontal lines represent the upper and lower acceptable limits of the characteristic's values. The dots depict sample measurements, while the lines connecting the dots are drawn simply to make monitoring easier by visualizing the dots sequence. As long as the dots appear within the area between the upper and lower limit lines, the monitored process is considered to be in control. Such a process is considered as a stable one, and more than 99% of its variation falls within three sigma of the mean value of the measured quantity, i.e., within the upper and lower limit. On the other hand, a dot falling out of the upper or lower limit is an indication that the process might be out of control and further investigation or even adjustment is required. A process, however, may still be considered as out of control even if all measurements fall within the acceptable limit lines. This is the case when the dots seem to behave in a systematic, therefore non-random, manner. For example, in the control chart of Figure 1, ten consequent measurements fall above the desired value. This is strong indication that the development process may be out of control and in need of adjustments. Therefore, a process that stays within the upper and lower limit and does not show other indications of non-random behavior is a controlled process; in such cases the past performance of a process can be used to predict its future performance.
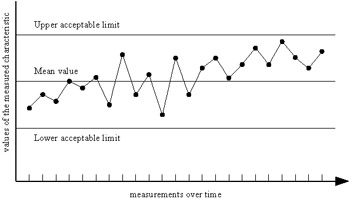
Figure 1: Example of a Control Chart
The aforementioned example makes it clear that SPC can only be applied on characteristics that can be objectively measured. This is very common in the production of material goods, where SPC has been applied with success, i.e., the values of the characteristics are most often dimensions or weights, such as the size of an instrument in millimeters or its weight in kilograms. This is rarely the case, however, in software development, where objective measurements are not always easy to obtain. For this reason, product metrics are essential in the IT development process since they are the instruments used to provide objective values that make the application of SPC techniques feasible. Summarizing, the exploitation of product metrics for obtaining values of the desired quality characteristics has made SPC a valuable tool aiding towards the improvement of the IT development process (Burr & Owen, 1996).
Sample cases of SPC use into IT development have been presented by Weller (2000), who used SPC for source code inspections to assess product quality during testing and to predict post-ship product quality, and by Florac, Carleton and Barnard (2000), who used SPC for analyzing the IT development process of a NASA space shuttle project that was related to 450,000 total delivered source LOC. To conclude, SPC can be used in IT development in conjunction with product metrics so as to exploit measurements of past performance and aiming to determine the IT development process capability to meet user specifications.
Product Measurements and Process Control in IT
Issues, Controversies, Problems
This section classifies product metrics into two categories, internal and external, and provides a short definition and examples of each category, descriptions of how they can be used in IT development and what kind of problems one might have to face during their application. Emphasis is placed on the correlation between internal and external metrics, since this issue is highly related to the use of metrics. The discussion also focuses on the way that the company size affects the application of metrics, since in certain cases the conduction of measurements appears to be problematic in small and medium size IT companies. For this reason, issues related to the application of product metrics in small or medium size companies are further analyzed in this section.
Product metrics can be categorized (Fenton & Pfleeger, 1997) as internal product metrics and external product metrics. Internal product metrics are those used to measure attributes of the product that can be measured directly by examining the product on its own, irrespectively of its behavior. External product metrics are those used to measure attributes of the product that can be measured only with respect to how the product relates to its environment.
Internal Metrics
Internal metrics can be classified into three categories based on the product attributes they measure. These categories are: size, complexity and data metrics.
- Size metrics are metrics that measure attributes related to the product size. Such attributes are the lines of code, the percentage of comments within the code, the volume of the basic entity used for design (for example the number of fifth level bubbles on a DFD-based design), the volume of the documentation, etc.
- Complexity metrics are metrics that measure attributes related to program complexity. Such attributes are the complexity of the program flow graph, the nesting levels, the object-oriented methods complexity, etc.
- Data metrics are metrics that measure attributes related to the data types and data structures used by the product. Such attributes are the volume of the data, the complexity of data structures, the volume of recursive data structures, the volume of data used per class in object-oriented programming, etc.
A more technical discussion enriched with typical examples of metrics from each category is presented in the following paragraphs using italics.
Among the internal size metrics, perhaps the most simple and most extensively used is the LOC metric, where LOC stands for Lines Of Code. However, despite its simplicity, defining LOC is not always an easy task. Namely, before applying the LOC metric, one must define whether LOC includes comment lines or not, empty lines or not and how code statements that have been broken into many lines will be counted. Of course, a measurements program based on a well-defined quality manual helps a lot towards solving such issues, as discussed in the following subsection of this chapter.
Although LOC is a commonly used size metric, it does not always provide accurate estimations of product size, due to differentiation in the definition of the 'line' according to each programmer's style. A way to face this problem (Halstead, 1977) is to break down code statements into tokens, which can either be operators or operands. In this way, measurements are not based on counting ambiguous lines anymore, but on counting well-defined tokens. Following the above concept, a set of metrics is defined by considering that n1 is the number of distinct operators, n2 the number of distinct operands, N1 the total occurrences of operators in the measured module and N2 the total occurrences of operands. Examples of such metrics are program size given by equation (1), effort estimator given by equation (2) and language level given by equation (3).
| (1) | 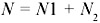 |
| (2) | 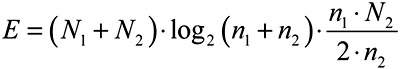 |
| (3) | 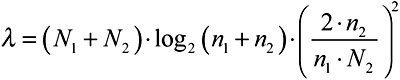 |
As regards metrics (1), (2) and (3), N provides a sufficient metric of the module's size, which has proven to be more accurate than LOC, while E is a good indicator of the effort spent on a module. Moreover, the E metric has proven (Fitzsimmons & Love, 1978) to be highly correlated to the number of defect reports for many programming languages. The λ metric is an indicator of how well the programming language has been used and variations of a standard measured λ of the programming language or languages the IT company is using for a particular IT project can aid in the early detection of problematic modules.
There are many more internal metrics, such as comments ratio, number of methods per class, number of public instance methods per class (Lorenz & Kidd, 1994), ratio of methods per class, etc. For example, function points, which fall into this category, are a very widespread internal metric used for estimation. Function points are based on an empirical relation and the assignment of weighting factors used to make countable measures of information domain to contribute to the total count of function points (Arthur, 1985).
As regards the internal complexity metrics, perhaps the most well-known and commonly used one is cyclomatic complexity (McCabe, 1976). Simplifying the formula so as to be applicable for each module, the cyclomatic complexity metric V(g) could be calculated as in (4), where e is the number of edges and n is the number of nodes of the measured module's flow graph g.
| (4) | 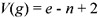 |
Table 1 shows a small sample of code in Object Pascal, produced using Borland Delphi for an image-processing tool. The numbers in the left of the code are used simply to aid in corresponding code statements with the graph points. The simplified flow graph g for this small module of sample code is illustrated in Figure 2. Consequent statement lines have been merged to a single node for simplicity purposes.
|
01 |
for i:=0 to m*n-(signlength*8) do begin if i mod step = 0 then begin pgrs1.position := trunc (i/step); label5.caption := inttostr(info)+'%'; end; for j:=i to i+(signlength*8)-1 do begin temp1[j-i]:=levels[level,j]; end; sim:=0; for j:=0 to (signlength*8)-1 do begin if temp1[j]=signature[j] then begin sim:=sim+1; end; end; similarity[i]:=sim; if similarity[i]>=signlength*8 then sign_found:=sign_found+1; end; similarity[i+1]:=0; |
|
02 |
|
|
03 |
|
|
04 |
|
|
05 |
|
|
06 |
|
|
07 |
|
|
08 |
|
|
09 |
|
|
10 |
|
|
11 |
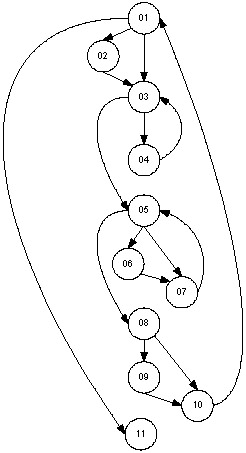
Figure 2: The G Flow Graph
Using the formula (4) and the flow graph g of the module shown in Table 1 it is easy to calculate the cyclomatic complexity V(g) of g, as shown in formula (5). High values of V(g) normally correspond to complex modules, while small values correspond to less complex ones. A module having only sequential statements and no control or decision commands would have V(g)=1.
| (5) | 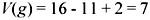 |
Other well-known complexity metrics are the depth of inheritance tree (Bansiya & Davis, 1997) used in object-oriented programming, the method complexity metric (Lorenz & Kidd, 1994), etc. Complexity metrics have been used with success to predict error-prone parts of code, but as discussed in this chapter their use can be problematic or lead to false estimations if they are not conducted in the framework of a complete method.
Finally, as regards the internal data metrics, such as the Data Structure Complexity Metric (Tsai, Lopez, Rodriguez, & Volovik, 1986), or the Number of Abstract Data types, or the Data Access Metric (Bansiya & Davis, 1997), it is important to note that one of their major benefits is that they can provide predictions before the completion of a large portion of code, since in most cases the data structures are known in advance. Data metrics are used to measure the volume or the complexity of data and data structures used in a module, or modules of code. The use of data metrics, as well as complexity and size metrics is further discussed in this chapter.
As far as internal product metrics in general are concerned, it is important to mention that one of their major advantages is that they are easy to automate and therefore data collection can be made in an easy, automated and cost-effective way. Furthermore, the measurement results can also be analyzed with an automated way using statistical techniques, and thus conclusions can be drawn rapidly. Tools such as Athena (Tsalidis, Christodoulakis, & Maritsas, 1991), QSUP (Xenos, Thanos, & Christodoulakis, 1996), Emerald (Hudepohl, Aud, Khoshgoftaar, Allen, & Maykand, 1996), GQM automation (Lavazza, 2000), etc. have made internal measurements very easy to conduct. The screenshot from the metrics form of QSUP shown in Figure 3 is an example of the simple and automated way in which such measurements can be made.
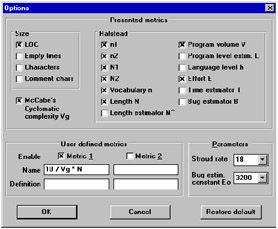
Figure 3: A Screen Shot from QSUP
On the other hand, it should be mentioned that among the disadvantages of internal product measurements is the fact that they are, in many cases, difficult to interpret. In other cases, the internal quantities measured are not clearly related to the external quality characteristics that one wants to assess. Such problems can only be solved in the framework of a well-defined measurement method that combines internal and external metrics.
External Metrics
Based on ISO 9126 (1996) standard, the external factors affecting IT product quality are Functionality, Usability, Efficiency and Reliability. As far as the definition of these factors is concerned (Kitchenham & Pfleeger, 1996), functionality refers to a set of functions and specified properties that satisfy stated or implied needs. Usability is defined as a set of attributes that bear on the effort needed for the use and on the individual assessment of such use by a stated or implied set of users. Efficiency refers to a set of attributes that bear on the relationship between the software's performance and the amount of resources used under stated conditions, while reliability refers to a set of attributes that bear on the capability of software to maintain its performance level, under stated conditions, for a stated period of time.
External metrics are used to measure directly these four factors or the characteristics of which these factors are composed. Unlike internal metrics (that measure internal characteristics of IT products and aim to relate measurements of such characteristics to these factors), external metrics measure directly these factors or their characteristics. Such metrics in many cases can be based on subjective estimates. Among the means employed by external metrics are surveys on user opinion providing valuable measurements for IT functionality or usability. Measures like defect reports, or mean time between failures (Fenton & Pfleeger, 1997) are used to determine IT product reliability, while measures like memory usage are used to determine efficiency.
As already mentioned, the application of external metrics implies that a certain extent of subjectivity is involved; even metrics that appear to be objective are often characterized by some degree of subjectivity. For example, defect reports seem to be a solid metric that can be used to objectively measure reliability. But the number of defect reports submitted by a user is influenced by issues such as the time and the extent of IT product usage, the user experience and even the user's motivation to edit and submit a defect report. Therefore, such metrics must be analyzed very carefully and under a framework that will take under consideration such issues. Among the external metrics that have to seriously consider the problem of subjectivity are survey-based external metrics. The following paragraphs, in italics, are a technical discussion on the use of questionnaire-based external metrics.
Perhaps the most direct way to measure users' opinion for an IT product is simply to ask them. This in most cases is done either by user interviews, or by questionnaire-based surveys. Interviews may cost significantly more than surveys — especially in cases that users are geographically dispread — and in many cases the interviewees' opinions might affect users' judgment. On the other hand, as argued by Kaplan, Clark and Tang (1995), surveys allow focusing on just the issues of interest, since they offer complete control of the questions to be asked. Furthermore, surveys are quantifiable and therefore are not only indicators in themselves, but also allow the application of more sophisticated analysis techniques to the measurements, techniques that are appropriate to organizations with higher levels of quality maturity.
However, the less costly, questionnaire-based surveys have to face problems too. The most common problem is the low response rate (especially when the means used for the conduction of the survey are mail, or e-mail); therefore a large number of users is required to guarantee an adequate volume of responses and thus effectiveness of the survey. Furthermore, surveys have to deal with problems such as the subjectivity of measurements and the frequency of erroneous responses. Questionnaire-based surveys sent by mail to a number of recipients should follow guidelines (Lahlou, Van der Maijden, Messu, Poquet, & Prakke, 1992) on how the questionnaire should be structured in order to minimize subjectivity due to misleading interpretations of questions or choice levels. For example, questionnaires should be well structured and the questions should follow a logical order, while references to previous questions should be avoided. Moreover, it is recommended that questions with pre-defined answers are used instead of open questions, where possible, while concepts such as probability, which may confuse the user, should be avoided, etc.
Still, due to the nature of surveys, errors are likely to occur. Actually, what is meant by errors, in this case, are responses not actually representing user opinion. Such errors could occur because, for example, the user answered the questionnaire very carelessly and made random choices when confused, or because the user was enthused in the first questions, but lost interest somewhere in the middle of the questionnaire and thus made some random choices in order to finish it, or simply because he misunderstood some of the questions and unintentionally made errors.
A technique for error minimization involving the use of safeguards to detect errors has been proposed by Xenos and Christodoulakis (1997). A safeguard is defined as a question placed inside the questionnaire so as to measure the correctness of responses provided by users. Therefore, safeguards are not questions aiming to measure users' opinions about the quality of an IT product, but questions aiming to detect errors. Specifically, safeguards are either questions that can be answered by only one particular answer and any other answer is considered as an error, or repeated questions (phrased differently in their second appearance) placed into different sections of the questionnaire to which exactly the same choices are offered as candidate answers — or repeated questions with exactly the same phrasing but to which completely different types of answers are offered. One major advantage of this type of surveys, which will be further discussed, is the fact that they place focus on IT user requirements and may aid in calibrating metrics, controlling measurement results, and providing confidence to both the company and the users.
| (6) | 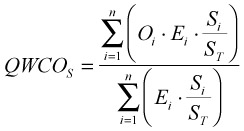 |
Apart from error detection, this technique also weights users' opinions based on their qualifications and a metric QWCOS is calculated using formula (6). In this formula, Oi, measures the normalised score of user i opinion, Ei measures the qualifications of user i, n is the number of users who responded to the survey, Si is the number of safeguards that the user i has replied correctly to, and ST is the total number of safeguards included. Since the use of the QWCUS technique implies the existence of at least one safeguard in the questionnaire, the division by ST is always valid.
Summarizing, one of the major advantages of external metrics is that they measure directly the desired external IT product quality characteristics; thus no further analysis or interpretation is needed. Additionally, external metrics contribute to a great extent to what is considered to be one of the main goals of IT product quality: user satisfaction. On the other hand, disadvantages and problems should be taken seriously under consideration when deciding to use external metrics, the most important of which being that such metrics are not objective and additional effort is required to ensure their objectivity. Furthermore, they are not as cost effective as internal measurements and in many cases it is difficult to conduct measurements due to high error rates, especially in cases that error detection techniques have not been used during measurements.
Correlating Metrics to Software Quality Characteristics
In this subsection the correlation between internal and external metrics is discussed. Being well aware of the correlation between internal and external measurements is essential for defining the goals and the techniques of an overall measurement method appropriate for the specific needs of an IT developing company and therefore being able to aid towards better IT Governance.
Some interesting results regarding the correlation of internal and external measurements were derived from a study (Xenos, Stavrinoudis, & Christodoulakis, 1996) in the framework of which measurements were conducted for 46 IT projects. Table 2 shows the normalized measurement results of the 46 software products measured using the aforementioned QWCOS external metric in assenting order — worst measurements first. The measurements of user perception of IT product quality were derived from a questionnaire-based survey.
|
External Measurement Results for 46 IT Projects |
|||||||||||
|---|---|---|---|---|---|---|---|---|---|---|---|
|
0.06 |
0.12 |
0.12 |
0.14 |
0.16 |
0.19 |
0.19 |
0.21 |
0.23 |
0.26 |
0.28 |
0.30 |
|
0.30 |
0.30 |
0.31 |
0.33 |
0.33 |
0.34 |
0.34 |
0.39 |
0.40 |
0.41 |
0.42 |
0.43 |
|
0.43 |
0.44 |
0.45 |
0.46 |
0.47 |
0.48 |
0.48 |
0.48 |
0.51 |
0.54 |
0.56 |
0.60 |
|
0.60 |
0.60 |
0.67 |
0.75 |
0.76 |
0.78 |
0.80 |
0.86 |
0.88 |
0.94 |
||
The internal measurement results relating to the 46 projects of the research – in the same order as in Table 2 — are shown in Table 3. The internal measurement results are normalized and were calculated using a formula combining a number of internal metrics. This combination metrics formula — called CMF — does not measure a physical product quantity, but combines all internal metric results. Its solid purpose is to provide a collective mechanism for comparison as shown in equation (7).
|
Combined Internal Measurement Results for same IT Projects |
|||||||||||
|---|---|---|---|---|---|---|---|---|---|---|---|
|
0.581 |
0.965 |
1.545 |
0.742 |
0.444 |
0.727 |
1.223 |
0.694 |
0.780 |
0.660 |
1.043 |
0.693 |
|
1.488 |
0.806 |
1.022 |
1.162 |
0.980 |
0.916 |
1.000 |
1.599 |
0.779 |
1.400 |
1.316 |
0.946 |
|
1.276 |
1.494 |
0.952 |
0.930 |
0.970 |
1.050 |
1.100 |
0.934 |
1.143 |
1.200 |
1.220 |
1.031 |
|
1.434 |
1.234 |
1.996 |
1.428 |
1.358 |
1.826 |
1.493 |
1.750 |
1.730 |
1.785 |
||
| (7) |  |
The metrics that form part of the CMF are the weighed average language level λwa, the essential size ratio R, the weighed average cyclomatic complexity Vwa and the data structure complexity metric T.
As expected, the external measurements results for the 46 projects followed an almost normal distribution with mean value 0.437 and standard deviation 0.219, as shown in Figure 4 illustrating the grouped frequency distribution — using a class range of 0.13 — around the marked midpoints.
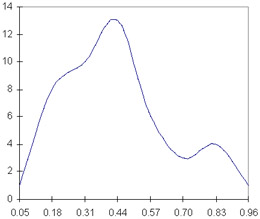
Figure 4: Distribution of External Measurements
In a similar manner, the combined internal measurement results are shown in Figure 5. Internal measurements also followed a normal distribution with mean value 1.149 and standard deviation 0.363, as can be seen in Figure 5.
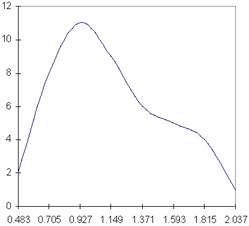
Figure 5: Distribution of Internal Combined Measurements
The preparatory work described above provided a uniform manner to represent external and internal IT product quality measurements, and consequently the examination of the correlation was feasible. The scatter plot in Figure 6 illustrates the correlation of internal and external measurements for these 46 IT projects. The horizontal line represents the measurements conducted using the external metrics while the vertical line represents the measurements conducted using the internal metrics. Projects are marked as points in the coordinates for each measurements line. The diagonal line — also called correlation line — represents the way in which correlation would be illustrated if the two measurement methods were 100% correlated.
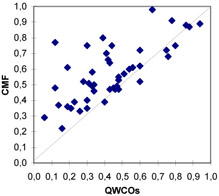
Figure 6: Correlation Among Internal and External Measurements
Points marked below the correlation line represent measurements that produced a higher score when external metrics of IT product quality were conducted, compared to their low internal measurements score. Namely, points below the correlation line represent IT projects that, despite their low internal measurements score, produced higher external metrics scores, i.e., the end-user perception of quality was not as low as expected based on the internal metrics results. On the other hand, points marked above the correlation line are measurements that produced a lower score when external metrics were conducted, compared to their high internal measurements score. Namely, these points represent IT projects that, despite their high score in internal measurements, users' perception for quality was not equally high.
As made evident by the scatter plot of Figure 6, only a very small number of projects fail the internal quality measurements and still achieve high external measurements scores; very few points are marked below the correlation line and no points are marked in great distance below this line. On the contrary, many points are marked just over the correlation line and even further above. This easily leads to the conclusion that satisfaction of internal quality standards — as measured using internal metrics — does not guarantee a priori success in meeting customers' perception of quality as measured using external metrics. IT products that receive high scores in an internal measurements program are not always likely to received high user acceptance.
Problems and Issues Using Metrics in Small and Medium Size IT Companies
Although in major IT developing companies metrics are most often an integral part of IT development process aiming at better IT Governance, this is rarely the case in small or medium size software development companies where none or very few software measurements are included in the development process. This is either due to lack of awareness of metrics and measurement methods, or due to the belief that measurements are impractical for small or medium size software development companies, cost too much and should always be conducted within a quality assurance framework available only in larger companies. This is partially true, since "measuring in the small" — a common expression for measurements in small and medium size companies — had to overcome several problems. However, it is just as true — as discussed further in this subsection — that measuring in the small is feasible and practical and all the problems can be overcome. Moreover, the use of metrics entails a great number of benefits for the small and medium IT developing companies that will implement them.
As already mentioned, small software developing companies willing to incorporate the application of metrics in their IT development process will often have to confront a number of problems and limitations. One of them lies in the fact that most small companies do not base software development on a standard. The lack of a standard framework that will constitute a guide for the use of metrics often leads to the conclusion that measurements are a luxury that they cannot afford. High cost is also an important reason why such companies often resist the application of new methods, tools, technologies and developing standards.
Furthermore, it should be considered that the majority of small companies operate under tremendous pressure. Given the limitations of their resources, they cannot afford a failure. Time is very critical and, since reaching a maturity level is a long-term commitment, this commitment is overlooked due to constant 'fire fighting'. The developing methods are in most cases ad hoc and chaotic and even in the cases of successfully completed projects, a major problem is the inability to repeat successful practices. Moreover, roles in small software development companies are sometimes unclear. There is no clear distinction between process and product engineers, or project management and development. The lack of formal development methods often results in unavailability of project records — historical data of any kind, not necessarily measurement data — and process documentation. The processes are kept in the minds of the development engineers and consequently are not documented in order to become common practice for every company employee.
Summarizing, the lack of a standard framework for measurements, the lack of formal development methods, the necessity for everyday 'fire fighting', as well as the lack of time to keep records are the basic limitations relating to the use of metrics in small IT developing companies.
On the other hand, small IT developing companies enjoy a number of benefits that are very helpful for the application of a measurements program. A fact that has not been stressed enough, but is true in most cases, is that the human resources of small software companies comprise skilled, well-educated and usually experienced engineers. This statement is based on the fact that in small companies the engineers are usually the same people who decided to take the risk of founding the company, and these people are, in most cases, experienced in the field of software engineering, or else they would not risk in a field for which they have little knowledge. Such engineers — although in many cases are obliged to use ad hoc methods for developing a project — already have the knowledge and the experience to acknowledge why metrics will improve their development process and what the benefits of a measurements program are. As a result, they are usually capable of selecting themselves the metrics appropriate for their IT projects and stay committed to them, not feeling that metrics are simply part of a process that has been enforced on them, which is often the case with employees in larger companies.
Another benefit of small software developing companies is the enhanced internal communication. While large companies spend a lot of management time and effort to select proper communication approaches and organize and reinforce internal communication processes, in small companies good internal communication is an everyday reality. Thus, internal distribution of data — among which is measurement data — is facilitated, while there is no need for complex communication procedures. Even more important than internal communication, however, is enhanced external communication. While in large companies there is no direct communication between product engineers and the customer, in small companies communication with the customer is far more direct. There are no intermediates between the customer and the developers and in most cases, this improves significantly the level of communication, despite the informality and lack of a communication method. This fact facilitates the collection of external measurements and their direct exploitation.
Another benefit regarding the use of metrics in small companies is that the difference of belief-systems of product engineers, i.e., software developers and developer managers, and process engineers, i.e., software quality engineers, quality assurance engineers, process improvement specialists and change agents reported (Mackey, 2000) for large IT development companies is not a problem in small and medium ones. Specifically, one of the major problems when implementing metrics is that processes and actions initiated by process engineers tend to be underestimated by product engineers and considered as bureaucratic slowdown of their work. In small and medium IT developing companies, where engineers play multiple roles — since they are mainly product engineers but also have to consider process improvement — it is easier to use metrics and appreciate their value.
Finally, it should be stressed that the collection and use of historical data required for measurements is facilitated thanks to the small size of the company, the few years of operation — in most cases — and the employment of the same individuals for a long period of time, which is also common in most cases. It is easier for personnel to note improvement owed to the use of metrics in practice and be convinced to use them. Realizing day after day in practice the real benefits of using metrics and achieving product and process improvement is much more convincing that just reading about it in impersonal reports — which might be the case in large companies. Therefore, despite what is currently believed, small companies have many reasons motivating them to incorporate metrics in their IT developing process. Recommendations regarding the use of metrics in such small and medium size IT developing companies are discussed in the following subsection.
Solutions and Recommendations
This subsection discusses solutions and recommendations for dealing with the issues, controversies and problems presented in the preceding section. Firstly, practical guidelines are presented relating to how both internal and external measurements can aid towards better IT Governance within a rigorous framework combining them into a complete measurement method applicable for IT developing companies. Then, the application of this method in small and medium IT companies is discussed, while suggestions are made on how the problems analyzed in the preceding section can be overcome. Finally, this subsection closes with a discussion on how metrics can be used in accordance with SPC so as to aid towards better IT Governance.
Combining Internal and External Metrics into a Measurement Method
As already mentioned in the previous sections, internal and external measurements must be conducted under a well-defined framework with precise goals. Before selecting the appropriate metrics for any IT project, it is necessary that all metrics available for use in the IT developing company have been collected and documented in detail in the company's quality manual. This manual is a basic component of the metrics application process and includes the metrics, the measurement techniques as well as guidelines for the application of metrics, the data analysis and the corrective actions required for improving the IT developing process. It should also be mentioned that the quality manual includes all metrics that are available regardless of how many times they have been used, or the availability of measurements data from past IT development projects.
Then, for each IT project, a set of metrics appropriate for this particular project is selected from the quality manual. The criteria on which the selection of metrics is based are the particular quality factors that the IT project places emphasis on. This set of metrics is documented — using the guidelines available in the quality manual — and consists of the quality plan of the IT project. Thus, a project quality plan should include all the metrics, measurement guidelines and goals applicable for the IT project. It is self-evident that the project plan of a specific IT project may be entirely different from another project's plan and may use a completely different set of metrics. The selection of the appropriate metrics and measurement techniques is performed by the IT developing company quality manager in cooperation with the project manager and — if necessary — with the members of the development team. In most cases, the analysis of historical data and measurements collected from similar projects can prove to be very helpful for the definition of the project quality plan. Figure 7 presents an illustration of the above procedure.
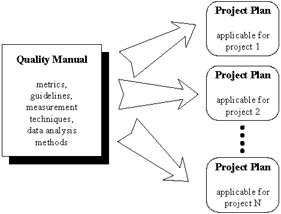
Figure 7: Selection of Metrics for Each IT Project
The quality plan of each project includes internal metrics so as to provide an easy and inexpensive way to detect possible causes for low IT product quality, as this might be perceived by the end-users, and take early corrective action. Including internal metrics in the quality plan will help in preventing failures and non-conformities. For achieving better results, it is recommended that every quality plan includes a combination of internal metrics. For example, high complexity measurements relating to a module are not necessarily an indication of bad practice and low quality, but if combined with additional measurements indicating a large volume of code and low data complexity, then this could be considered as an indication that problems might occur during testing or even after project delivery and that early corrective action should be taken.
A project quality plan should also include external metrics — applied during alpha or beta testing and post shipment — so as to measure external quality factors. Occasionally external metrics could be used in order to test the soundness of the internal metrics and measurements results and even to calibrate internal metrics. Such calibrations must be reflected with the appropriate changes in the quality manual.
It must be noted that the successful selection of metrics and measurement techniques to be included in the IT developing company quality manual is very dependent on company maturity. The adoption of sophisticated techniques and complex metrics by a company might prove to be ineffective, if it is not supported by years of experience with metrics and measurements and large volumes of data from past project measurements. IT developing companies should always keep this fact in mind and set feasible measurement goals, not aiming too high at the early stages of metrics application.
Application of Metrics in Small and Medium Size IT Companies
As regards small and medium size IT developing companies, it should be stressed that metrics can be used without causing a major increase in the development cost. For example, communication costs, which should be included in any cost estimation relating to quality, are high in larger companies but minimal in small ones. Moreover, a large number of metrics and tools are freely available, thus minimizing the cost of using metrics. Of course, it is important to note that metrics can help small IT developing companies to improve process efficiency, product quality and reach a higher level of maturity. It is suggested that metrics are used with a standard in mind. This does not imply that a small company should attempt to obtain an ISO9001 certification or a high level CMM assessment by using metrics. However, it is suggested that the IT company should attempt to build a quality manual based on a standard and introduce metrics into specific project quality plans following the guidelines of this standard. The primary goal should be the improvement of product quality and process efficiency by the use of metrics and a future goal might be the certification. In the case that the certification is achieved, it is not advisable to use it for marketing reasons only, such as promotional purposes, as often is the case, but mainly for improvement. Furthermore, it is recommended that the standard's guidelines are adopted step by step while the use of metrics, in the early stages of introduction of measurements in the company, should be limited to a selected set of well-known metrics, metrics that as Kautz (1999) said "must make sense for small IT companies."
The use of metrics in small and medium size companies should be based on each company's specific needs. A good approach would be to start with a method such as the GQM (Solingen & Berghout, 1999), by selecting very few metrics at first, based on specific and well-defined goals. Existing data that require little effort to collect (such as size measurements, testing time, data from the customers) should be collected and exploited. Experience reports (Grable, Jernigan, Pogue, & Divis, 1999) have shown that similar metrics have been used with success in small IT projects aiding towards better IT Governance. However, it should always be kept in mind that the main idea of metrics is to measure only what actually helps towards well-defined goals and is achievable considering time and personnel limitations. In the same way, the use of free methods and tools is advisable only provided that their selection is based on real company needs and not on the fact that they are free. Perhaps, the most important suggestion regarding the use of metrics is to rely on small companies' benefits — as presented in the preceding section — and take advantage of them as much as possible. For example, good external communication can significantly aid in better and easier collection of external product measurements. Engineers playing both roles of product and process engineer have the advantage of being in the position to interpret various internal and external metric results and at the same time benefit from process improvement to achieve more effective product development process.
Finally, especially for small and medium size IT developing companies, it must be noted that commitment is the most critical factor that determines success or failure of a measurement program. It is better to set minor goals and use very few metrics at first, increasing them progressively, rather than define an ambitious measurement program that will be abandoned later on, when the first need for 'fire fighting' will occur and preoccupy everyone. If commitment to metrics weakens, it is usually difficult to revive. Small IT development companies making limited use of metrics, based on their particular needs and aiming towards process improvement according to a chosen standard, have a lot to gain from this effort.
Using Metrics within a SPC Framework
As mentioned in previous sections, the use of statistical process control techniques to monitor if a process is in control — so as to implement corrective measures, if the process has become out of control, or simply to use data relating to past performance to predict future behavior — is feasible only if internal metrics are available to be used as basis for the application of SPC. These internal metrics are used to measure essential characteristics of the IT developing process.
It should be stressed that the selection of internal metrics is very important for the proper application of SPC techniques. On the other hand, examples of models that have failed to predict process behavior have been reported (Adams, 1984) and based on these examples the inclusion of internal metrics in such models was criticized (Fenton & Neil, 1999); specifically, it was argued that external metrics are the only true indicators of process performance. It is indisputable that external metrics are the final indicators of process performance, but such metrics cannot be available in the early phases of IT process development, where predictions need to be made. This luck of external metrics leads to the use of internal ones as well as the use of SPC techniques to monitor the IT development process. Of course, it goes without saying that the selection of the proper metrics to measure statistical relationships is a very important task and thus should be made very carefully and should always be verified by using external metrics. This is the proper way to apply SPC techniques, as discussed in the following examples.
As Florac and Carleton (1999) mention, the control chart, already presented earlier in this chapter, is an ideal tool for analyzing process behavior, because it measures process performance over time and provides an operational definition of stability and capability. It is a fact that IT developing companies are beginning to appreciate the value that control charts add to IT Governance by providing quantitative insights of the behavior of their IT development processes. Using control charts, it is easy to monitor when a metric exceeds the preset limits, which is interpreted that the IT developing process has become out of control and therefore immediate corrective action should be taken to eliminate abnormalities. A more technical discussion of the use of such charts follows.
Based on the main idea of the control chart illustrated in Figure 2, a number of control chart variations exist that can be used to monitor IT development process depending on the type of data measured. For individuals or attributes of data – such as counts related to occurrences of events or sets of characteristics — the most appropriate are XmR control charts. In XmR charts the middle bar, called Xbar, represents the mean value of the measured item. The mRbar is the mean value of the absolute differences of successive pairs of data. The upper control limit UCL and the lower control limit LCL in XmR control charts are fixed straight lines and the values of these lines can be calculated using formulas (8) and (9). Further details on how to develop and use XmR control charts can be found in Florac and Carleton (1999). Other than the formulas used to calculate the acceptable limits, namely the limits within which measurements should fall in order for the process to be considered in control, the XmR control charts are similar to the control chart example presented in Figure 2.
| (8) | 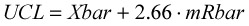 |
| (9) | 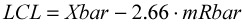 |
Figure 8 is an XmR chart illustrating the results of 20 inspecting sessions using the metric LOC per inspection person hour. An inspecting session is a formal review process conducted by a number of experienced code reviewers. The 'inspection person hour' stands for the number of reviewers multiplied by the number of the hours that the session lasted. Assuming that the 20 measurements collected are: 42, 55, 41, 50, 37, 17, 22, 44, 63, 68, 30, 42, 51, 62, 38, 34, 55, 39, 27, 49, the Xbar represents the average of all measurements, therefore, Xbar = 43.30. In a similar manner, mRbar is calculated as the average of the absolute differences of the 19 successive pairs of data, therefore mRbar = 15.21. Using formulas (8) and (9), UCL and LCL are calculated respectively: UCL = 83.76 and LCL = 2.84. Using the aforementioned calculations and a typical spreadsheet it is easy to monitor this IT process and to create the XmR control chart of Figure 8. In this example the monitored process is in control, since all measurements fall within UCL and LCL and there are no indications of non-random behavior.
Figure 8: An XmR Chart of LOC Per Person Hours Spent During Formal Inspection Sessions
When the measured item is a variable — as in the case of observations of continuous phenomena or counts that describe size or status — then the appropriate type of control charts for monitoring purposes are the u-charts. In this case, the upper and lower control limits (UCL and LCL) vary depending on each measurement, since the last measurement affects the limits and leads to the calculation of new ones. In the example illustrated in Figure 8, a u-chart is used to monitor the testing process and measures the number of defects per LOC reported during a typical testing session. The session is typical in the sense that it is well planned and took place regularly and in a manner similar to the previous sessions. The center line is called Ubar and represents the number of defects reported during the testing session divided by the number of LOC examined. The upper and lower control limits are calculated using formulas (10) and (11).
| (10) | 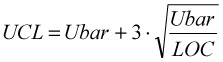 |
| (11) | 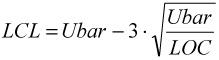 |
To create a u-chart is very simple and can be done using a typical spreadsheet such as the one used to create the u-chart of Figure 9. It should be noted that for using the u-chart it is necessary to receive measurement data on a regular basis. SPC techniques cannot be applied with few sets of data received sporadically over time in a nonperiodical manner. More important than regularity in data receipt is the issue of data homogeneity. This applies to all variations of control charts, since in order to use control charts data must be homogeneous. For example, the u-chart of a LOC metric based on the data received from the testing sessions of two different programming languages will not provide any valuable results; in this case, the IT development process can only be monitored using two different control charts. Similarly, when the testing sessions include retesting of some modules, again, two different control charts are required, since it is expected that retesting sessions will result in lower rates than the previous testing sessions, resulting in abnormal variation of the Ubar measurements. Consequently, the use of two control charts (one for testing sessions and one for retesting sessions) is necessary to ensure measurements validity.
Figure 9: A U-Chart of Defects Per LOC Reported During Regular Testing Sessions
The example of the u-chart of Figure 9 is based on data from a past IT project. The LCL is not calculated or illustrated, since it is not applicable for the particular case. The testing sessions do not include any retest of revised code. Of course, in another case in the formulas (10) and (11), the upper and lower control limits would have been calculated using another metric instead of the number of defects divided by LOC.
The main purpose of control charts is to help in the detection of variations in the measured IT process. Variations can be common-cause variations or assignable-cause variations (Florac, Carleton, & Barnard, 2000). Common-cause variations are normal and rather expected variations caused by regular interaction among process components of the IT development process such as people, machines, material, tools, environment and methods. Such variations usually cause measurements to fluctuate within acceptable limits. Assignable-cause variations, on the other hand, are caused by events that are not part of the normal IT development process and indicate abnormal or sudden changes to one or more basic process components. In the majority of cases, assignable-cause variations cause measurements to fall out of the acceptable limits. Removing all assignable causes and preventing their reoccurrence will lead to a stable and predictable IT development process.
In order to statistically monitor the IT development process, one can choose from a number of internal metrics to be included in the model. This section presented a few examples of the application of SPC techniques contributing to the exploitation of past process performance to predict future behavior and detect abnormalities in the IT process. Using such techniques allows better control of the IT development process and therefore helps towards better IT Governance. For better results, as already discussed, one must always combine such techniques with external measurements under a measurements framework.
Future Trends
For about three decades now, metrics are used for the estimation of product-related issues (such as product size, required effort, time required for testing, etc.) for early detection and prevention of problems during development and for product assessment after product release. More recently, during the past decade, the use of metrics for statistically controlling IT development process was proposed.
Although both these practices were proven to be successful in practice and aided significantly towards better IT Governance, the benefits from the use of metrics are not commonly recognized. This is partly due to the lack of awareness of metrics in small and medium size IT developing companies. Although in major IT companies metrics are extensively used, in many cases, small and medium ones are not even aware of the prospect and benefits of using metrics. However, this is constantly changing. More and more small and medium size IT developing companies become aware of product metrics and process control. Besides, the adoption of standards such as ISO9001, or assessment in CMM higher levels, has contributed to this change since both standards are encouraging the use of IT metrics.
Another issue that is expected to change in the near future is the availability of more sophisticated tools. Although many measurements tools are available, using a number of metrics, there are not many tools available yet that use past projects' measurement data in combination with current project data in order to aid in decision making. Combining metrics with decision support techniques, or methods for resolving uncertainty will lead to the development of valuable tools that will aid towards IT Governance. A recent approach towards this direction (Fenton, Krause, & Neil, 2002) is using IT metrics and Bayesian networks for effective IT Governance, especially for risk management, by automatically predicting defects in the released IT product. One of the benefits of such models is that they allow reasoning in both forward (used for prediction of future behavior) and backward direction (used for assessment of best practices or analysis of problematic practices and definition of revisions and corrective actions that need to be taken).
Finally, another future goal is related to the expansion of open source systems. An ambitious plan would be to use metrics for defining measurable goals related to source code modules available for inclusion in open source IT projects and therefore to define a set of standards that will determine the quality of such code. Selecting the appropriate set of metrics for open source modules and setting up the standards for such a measurements program is a difficult and ambitious future goal due to the particularities of open source development and the lack of formal management structure.
Conclusion
This chapter introduced the reader to software metrics that are used to provide knowledge about different elements of IT projects. It presented internal metrics that can be applied prior to the release of the IT product to provide indications relating to quality characteristics, and external metrics applied after IT product delivery to give information about user perception of product quality. It also analyzed the correlation among internal and external metrics and discussed the way in which such metrics can be combined into a measurements program. Emphasis was placed on small and medium size IT developing companies and how such companies can overcome problems relating to the application of metrics. Finally, the use of metrics within a statistically controlled IT development process was discussed.
Software metrics can be used to measure various factors related to IT product development. These factors include estimation, early detection and prevention of problems, product assessment, etc. Their utilization within a measurements framework in combination with the use of automated tools can aid towards IT development process control and better IT Governance, regardless of the IT developing company size.
References
Adams, E. (1984). Optimizing Preventive Service of Software Products. IBM Research Journal, 28(1), 2–14.
Albrecht, A. J. (1979). Measuring application development productivity. Proceedings of IBM Applications Development Symposium, Monterey, California, (pp. 83–92).
Arthur, L. (1985). Measuring programmer productivity and software quality. Wiley-Interscience.
Bansiya, J., & Davis, C. (1997). Using QMOOD++ for object-oriented metrics. Automated metrics and object-oriented development. Online Dr. Dobb's Journal.
Boehm, B.W. (1989). Software risk management. Los Alamos: IEEE Computer Society Press.
Burr, A., & Owen, M. (1996). Statistical methods for software quality. Thompson Computer Press.
DeMarco, T. (1982). Controlling software projects. New York: Yourdon Press.
Deming, W. (1986). Out of the crisis. Cambridge: MIT Center for Advanced Engineering Study.
Fenton, N.,Krause, P., & Neil, M. (2002). Software measurement: Uncertainty and causal modeling. IEEE Software, 19(4), 116–122.
Fenton, N. E., & Neil, M. (1999). A critique of software defect prediction research. IEEE Transactions on Software Engineering, 25(5), 675–689.
Fenton, N. E., & Pfleeger, S. L. (1997). Software metrics: A rigorous & practical approach (2nd ed.). London: International Thomson Computer Press.
Fitzsimmons, A., & Love, T. (1978). A review and evaluation of software science. Computing Surveys, 10.
Florac, W. A., & Carleton, A. D. (1999). Measuring the software process: Statistical process control for software process improvement. MA: Addison-Wesley.
Florac, W. A.,Carleton, A. D., & Barnard, J. R. (2000). Statistical process control: Analyzing a space shuttle onboard software process. IEEE Software, 17(4), 97–105.
Funami, Y., & Halstead, M. (1976). A software physics analysis of Akiyama's debugging data. Symposium on Computer Software Engineering, Polytechnic Institute of New York, (pp. 133–138).
Gibbs, W. (1994). Software's chronic crisis. Scientific American, 271(3), 86–95.
Grable, R.,Jernigan, J.,Pogue, C., & Divis, D. (1999). Metrics for small projects: Experiences at the SED. IEEE Software, 16(2), 21–28.
Halstead, M. (1977). Elements of software science. North Holland: Elsevier Publications.
Hansen, W. (1978). Measurement of the program complexity by the pair (cyclomatic number, operator count). ACM SIGPLAN, 13.
Henry, S., & Kafura, D. (1981). Software structure metrics based on information flow. IEEE Transactions on Software Engineering, SE-7 (5), 510–518.
Hudepohl, J. P.,Aud, S. J.,Khoshgoftaar, T. M.,Allen, E .B., & Maykand, J. (1996). Emerald: Software metrics and models on the desktop. IEEE Software, 13(5), 56–60.
ISO9001: Quality management and quality assurance standards. (1991). International Standard. ISO/IEC 9001.
ISO9126: Information technology. Evaluation of software. Quality characteristics and guides for their use. (1996). International Standard. ISO/IEC 9126.
Joergensen, A. (1980). A methodology for measuring the readability and modifiability of computer programs. BIT Journal, 20, 394–405.
Kaplan, C.,Clark, R., & Tang, V. (1995). Secrets of software quality. New York: McGraw Hill.
Kautz, K. (1999). Making sense of measurement for small organizations. IEEE Software, 16(2), 14–20.
Kitchenham, B., & Pfleeger, S. (1996). Software quality: The elusive target. IEEE Software, 13(1), 12–21.
Lahlou, S.,Van der Maijden, R.,Messu, M.,Poquet, G., & Prakke, F. (1992). A guideline for survey - techniques in evaluation of research. Blussels: ESSC-EEC-EAEC.
Lavazza, L. (2000). Providing automated support for the GQM measurement process. IEEE Software, 17(3), 56–62.
Lorenz, M., & Kidd, J. (1994). Object–oriented software metrics. New York: Prentice Hall.
Mackey, K. (2000). Mars versus Venus. IEEE Software, 17(3), 14–16.
McCabe, T. (1976). A software complexity measure. IEEE Transactions in Software Engineering, SE-2 (4), 308–320.
McCall, J. A.,Richards, P. K., & Walters, G. F. (1977). Factors in software quality. (Vols I, II, III). U.S. Rome Air Development Center Reports NTIS AD/A-049, 14–55.
McGarry, F., & Decker, B. (2002). Attaining Level 5 in CMM process maturity. IEEE Software, 19(6), 87–96.
Miller, A., & Ebert, C. (2002). Software engineering as a business. IEEE Software, 19(6), 18–22.
Montgomery, D.C. (1991). Introduction to statistical quality control (2nd ed.). New York: John Wiley & Sons.
Paulk, M. C.,Curtis, B.,Chrissis, M. B., & Weber, C. V. (1993). Capability maturity model for software (Version 1.1). Pittsburgh: Carnegie Mellon University – Software Engineering Institute: Technical Report. CMU/SEI-93-TR-024.
Putnam, L., & Myers, W. (1992). Measures for excellence. Cambridge: Yourdon Press.
Ragland, B. (1995). Measure, metric or indicator: What's the difference? Crosstalk, 8.
Shepperd, M., & Ince, D. (1990). The use of metrics in the early detection of design errors. Proceedings of Software Engineering.
Solingen, R., & Berghout, E. (1999). The goal question metric method. McGraw Hill.
Stamelos, I., & Angelis, L. (2001). Managing uncertainty in project portfolio cost estimation. Information & Software Technology. Elsevier Publications, 43(13), 759–768.
Tsai, W. T.,Lopez, M. A.,Rodriguez, V., & Volovik, D. (1986). An approach to measuring data structure complexity. Compsac86. 240–246.
Tsalidis, C.,Christodoulakis, D., & Maritsas, D. (1991). Athena: A software measurement and metrics environment. Software Maintenance Research and Practice.
Van Grembergen, W. (2002). Introduction to the Minitrack: IT governance and its mechanisms. Proceedings of the 35th Hawaii International Conference on System Sciences (HICSS), IEEE.
Weller, E. F. (2000). Practical applications of statistical process control. IEEE Software, 17(3), 48–55.
Xenos, M., & Christodoulakis, D. (1994). An applicable methodology to automate software quality measurements. IEEE Software Testing and Quality Assurance International Conference, New Delhi (pp. 121–125).
Xenos, M., & Christodoulakis, D. (1997). Measuring perceived software quality. Information and Software Technology Journal. Butterworth Publications, 39(6), 417–424.
Xenos, M.,Stavrinoudis, D., & Christodoulakis, D. (1996). The correlation between developer-oriented and user-oriented software quality measurements (a case study). Proceedings of the 5th European Conference on Software Quality, EOQ-SC, Dublin: Ireland (pp. 267–275).
Xenos, M.,Thanos, P., & Christodoulakis, D. (1996). QSUP: A supporting environment for preserving quality standards. Proceedings of the 6th International Conference on Software Quality, Dundee Scotland (pp. 146–154).
Section I - IT Governance Frameworks
- Structures, Processes and Relational Mechanisms for IT Governance
- Integration Strategies and Tactics for Information Technology Governance
- An Emerging Strategy for E-Business IT Governance
Section II - Performance Management as IT Governance Mechanism
- Assessing Business-IT Alignment Maturity
- Linking the IT Balanced Scorecard to the Business Objectives at a Major Canadian Financial Group
- Measuring and Managing E-Business Initiatives Through the Balanced Scorecard
- A View on Knowledge Management: Utilizing a Balanced Scorecard Methodology for Analyzing Knowledge Metrics
- Measuring ROI in E-Commerce Applications: Analysis to Action
- Technical Issues Related to IT Governance Tactics: Product Metrics, Measurements and Process Control
Section III - Other IT Governance Mechanisms
- Managing IT Functions
- Governing Information Technology Through COBIT
- Governance in IT Outsourcing Partnerships
Section IV - IT Governance in Action
EAN: 2147483647
Pages: 182
- Chapter II Information Search on the Internet: A Causal Model
- Chapter III Two Models of Online Patronage: Why Do Consumers Shop on the Internet?
- Chapter VIII Personalization Systems and Their Deployment as Web Site Interface Design Decisions
- Chapter IX Extrinsic Plus Intrinsic Human Factors Influencing the Web Usage
- Chapter XV Customer Trust in Online Commerce
