Debugging in Visual Studio .NET
The easiest and best way to avoid bugs is to let Visual Studio .NET help you find and remove them.
When you run your code in the debugger, you can literally watch your code progress, step by step. As you walk through the code, you can see the variables change values and watch as objects are created and destroyed. A good symbolic debugger is like a full motion CAT scan of your program.
The debugger is one of the most powerful tools at your disposal for learning Windows programming. This section provides a brief introduction to the most important parts of the debugger within Visual Studio .NET. For complete coverage of the Visual Studio .NET debugger, please see Mastering Visual Studio .NET by Ian Griffiths (O'Reilly).
21.5.1 Finding Syntax Errors
Your eye tends to see what it expects. For example, read the sentence in Figure 21-3.
Figure 21-3. Seeing what you expect

Many readers will see this as "Paris in the spring" even after reading it a few times. Some readers will see the mistake only when they actually place their index fingers on the page and mark off each word. The brain tends to see what it expects to see, and finding syntax errors can be terribly difficult. Fortunately, this is the easiest kind of error for Visual Studio .NET to find.
Consider the following C# code that will not compile:
![]()
private void mnuStartLoop_Click(object sender, System.EventArgs e)
{
 for (int i = 1; i < 10; i++);
 {
 if ( i = = 10 )
 {
 MessageBox.Show("Counted 10!",
 "MessageBoxCounter",MessageBoxButtons.OK,
 MessageBoxIcon.Information);
 }

 Application.DoEvents( );

 }
}
Can you spot the error? Now take a look at it in Visual Studio .NETthe error is highlighted by Visual Studio .NET (with a red, squiggly line) before you even try to compile, as shown in Figure 21-4.
Figure 21-4. Syntax error highlighting
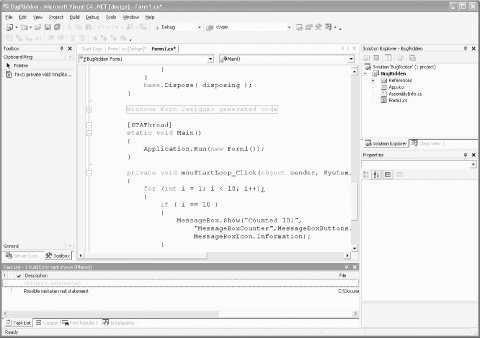
Notice the underlined semicolon at the end of the for statement and note that the Task list also flags that line as a potential problem. In fact, if you double-click on the line in the task list, you are taken directly to the semicolon for easy deletion.
Syntax errors are easy as pie; runtime errors, though, can be tricky, which is where the debugger can really help you out.
21.5.2 Debug Versus Release Mode
To use Visual Studio .NET for debugging, you must set up to run your program in Debug mode (this is the default, so you really don't have to do very much).
You can compile your program in either Debug or Release mode (or in a custom mode you create for yourself). The Release configuration mode is designed to strip out all the debugging information (which might otherwise bloat your program) and turn on optimizations (which will make your program run faster). The debug mode turns off optimizations (which can otherwise make debugging tricky) and adds back the symbolic information (the C# or VB.NET code) that helps you to figure out what is going wrong.
Look at the top of the Toolbar in the Visual Studio .NET editor. You'll find a drop-down menu that lets you switch between Debug and Release and invoke the Configuration Manager, as shown in Figure 21-5.
Figure 21-5. Setting Debug mode

The Configuration Manager option brings up the Configuration Manager dialog box, shown in Figure 21-6.
Figure 21-6. The Configuration Manager
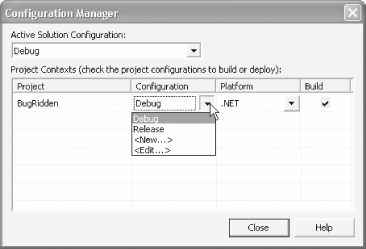
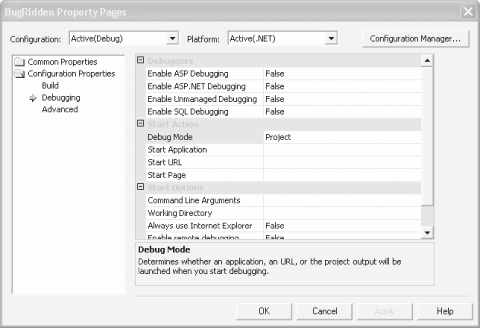
The Configuration Manager lets you modify the configuration (e.g., for Debug builds) or create new configurations for special requirements. These options are limited, however. The most powerful way to control the configuration for debugging is to bring up the properties window for the project itself by right-clicking on the project in the Solution Explorer window and then choosing the Configuration Properties/Debugging option in the left pane, as shown in Figure 21-7.
Figure 21-7. Project Properties
21.5.3 The Debug Toolbar
A Debug toolbar is available in the IDE. To make it visible, click on the View/Toolbars menu commands, and then click on Debug, if it is not already checked. Table 21-1 shows the icons that appear on the Debug toolbar (unless you customize it to your own needs).
|
Icon |
Debug menu equivalent |
Keyboard shortcut |
Description |
|---|---|---|---|
|
|
Toolbar handle. Click and drag to move the toolbar to a new location. |
||
|
|
Start / Continue |
F5 |
Start or continue executing the program. |
|
|
Break All |
Ctrl+Alt+Break |
Stop program execution at the currently executing line. |
|
|
Stop Debugging |
Shift+F5 |
Stop debugging. |
|
|
Restart |
Ctrl+Shift+F5 |
Stop the run currently being debugged and immediately begin a new run. |
|
|
Show the next statement. |
||
|
|
Step Into |
F11 |
If the current line contains a call to a method or function, this icon will single step the debugger into that method or function. |
|
|
Step Over |
F10 |
If the current line contains a call to a method or function, this icon will not step into that method or function, but go to the next line after the call. |
|
|
Step Out |
Shift+F11 |
If the current line is in a method or function, that method or function will complete and the debugger will next stop on the line after the method or function call. |
|
|
A unit of debugger stepping. Possible values are Line, Statement, and Instruction. |
||
|
|
A hexadecimal display toggle. |
||
|
|
Windows |
A debug window selector. |
|
|
|
Toolbar options. Offer options for adding and removing buttons from the Debug, Text Editor, and all other toolbars. |
21.5.4 Breakpoints
Breakpoints are at the heart of debugging. A breakpoint is an instruction to .NET to stop at a specific line in your code if that line is about to be executed. While the execution is paused, you can perform one of the actions from the list shown next.
- Examine and modify values of variables and expressions.
- Single step through the code.
- Move into and out of methods and functions, even stepping into classes written in other CLR-compliant languages.
- Perform any number of other debugging and analysis tasks.
21.5.4.1 Setting a breakpoint
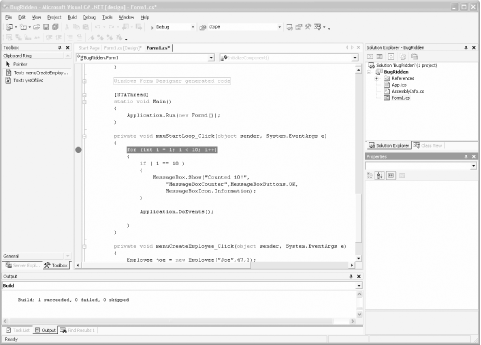
A breakpoint is set in the Source window (any Source windowpage file, control file, code-behind, etc.) by single-clicking on the gray vertical bar along the left margin of the window (or by pressing F9). A red dot will appear in the left margin, and the line of code will be highlighted, as shown in Figure 21-8.
Figure 21-8. Breakpoint
An alternative to clicking in the left margin is selecting the Debug/New Breakpoint... menu command (Ctrl+B). Clicking on the File tab brings up the dialog shown in Figure 21-9. The text boxes will already be filled in with the current location of the cursor.
Figure 21-9. New Breakpoint dialog box
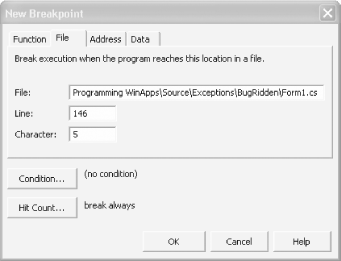
The four tabs in the dialog box in Figure 21-9 correspond to the four types of breakpoints, described in Table 21-2.
|
Type |
Description |
|---|---|
|
Function |
Allows you to specify where, in which language, and in which method or function the break will occur. |
|
File |
Sets a breakpoint at a specific point in a source file. When you set a breakpoint by clicking in the left margin (or pressing F9), a file breakpoint is set. |
|
Address |
Sets a breakpoint at a specified memory address. |
|
Data |
Sets a breakpoint when the value of a variable changes. |
21.5.4.2 Breakpoint window
You can see all the currently set breakpoints by looking at the Breakpoint window. To display the Breakpoint window, perform any one of the following actions:
- Press Ctrl+Alt+B.
- Select Breakpoints from the Debug/Windows menu command.
- Click on Windows icon of the Debug toolbar and select Breakpoints.
A Breakpoint window is shown in Figure 21-10.
Figure 21-10. Breakpoint window

You can toggle a breakpoint between Enabled and Disabled by clicking on the corresponding CheckBox in the Breakpoint window.
21.5.4.3 Breakpoint properties
Sometimes you don't want a breakpoint to stop execution every time the line is reached. Visual Studio .NET offers two properties that can be set to modify the behavior of a breakpoint. These properties can be set in either of two ways:
- Right-click on the breakpoint line in the code window and select Breakpoint Properties.
- Open the Breakpoint window, right-click on the desired breakpoint, and select Properties.
In either case, you will see the dialog box shown previously in Figure 21-9.
The fields at the top of the Breakpoint Properties dialog box will default to the current breakpoint's location. The two buttons allow access to the Condition and Hit Count properties.
21.5.4.3.1 Condition
The Condition button brings up the dialog shown in Figure 21-11.
Figure 21-11. Breakpoint Condition dialog box
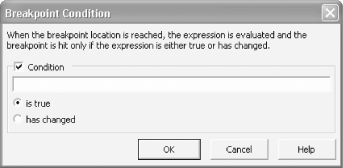
You can enter any valid expression in the edit field. This expression is evaluated when program execution reaches the breakpoint. Depending on which radio button is selected and how the Condition expression evaluates, the program execution will either pause or move on. The two radio buttons are labeled as described next.
is true
If the entered Condition evaluates to a Boolean true, then the program will pause.
has changed
If the entered Condition has changed, then the program will pause. On the first pass through the piece of code being debugged, the breakpoint will never pause execution because there is nothing to compare against. On the second and subsequent passes, the expression will have been initialized and the comparison will take place.
21.5.4.3.2 Hit count
Hit count is the number of times that spot in the code has been executed since either the run began or the Reset Hit Count button was pressed. The Hit Count button brings up the dialog shown in Figure 21-12.
Figure 21-12. Breakpoint hit count dialog box
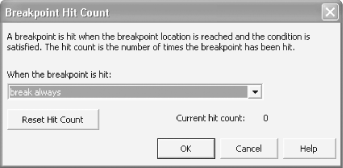
Clicking on the drop-down list presents the following options:
- Break always.
- Break always when the hit count is equal to.
- Break always when the hit count is a multiple of.
- Break always when the hit count is greater than or equal to.
Click on any option other than "break always," the default, and the dialog box will add an edit field for you to enter a target hit count.
Suppose that this breakpoint is set in a loop of some sort. You selected "break when the hit count is a multiple of" and entered 5 in the edit field. Then the program pauses execution every fifth time through.
21.5.4.4 Breakpoint icons
There are several different breakpoint symbols, or glyphs, each conveying a different type of breakpoint. These glyphs appear in Table 21-3.
|
Glyph |
Type |
Description |
|---|---|---|
|
|
Enabled |
A normal, active breakpoint. If breakpoint conditions or hit count settings are met, execution will pause at this line. |
|
|
Disabled |
Execution will not pause at this line until the breakpoint is re-enabled. |
|
|
Error |
The location or condition is not valid. |
|
|
Warning |
The code at this line is not yet loaded, so a breakpoint can't be set. If the code is subsequently loaded, then the breakpoint will become enabled. |
21.5.4.5 Stepping through code
The Start Loop menu choice invokes the method mnuStartLoop_Click. The idea of this method is to count from 1 to 10 and display a message box, but this method has a bug: the message box is never displayed. Here's the code:
![]()
private void mnuStartLoop_Click(object sender, System.EventArgs e)
{
 for (int i = 1; i < 10; i++)
 {
 if ( i = = 10 )
 {
 MessageBox.Show("Counted 10!",
 "MessageBoxCounter",MessageBoxButtons.OK,
 MessageBoxIcon.Information);
 }
 Application.DoEvents( );
 }
}
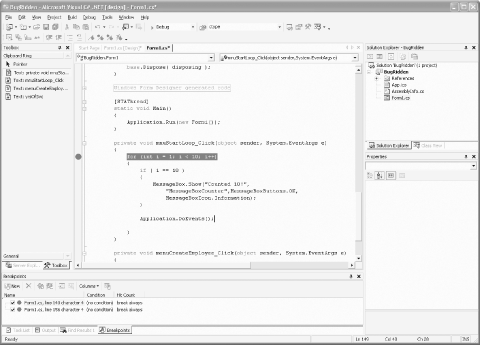
You may be able to find the bug on inspection (without a debugger) but let's assume that this one has you stumped. Place a breakpoint on the first line of the method, as shown in Figure 21-13.
Figure 21-13. Breakpoint on first line of mnuStartLoop_Click
|
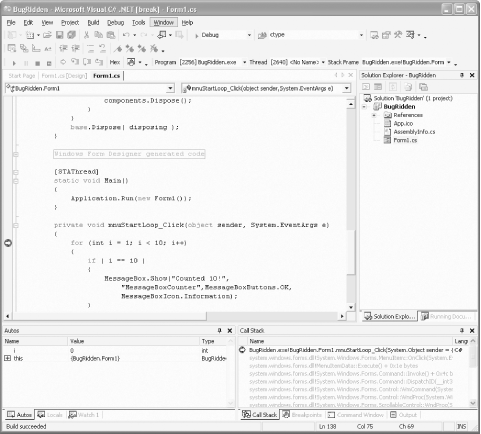
Click on Debug  Start (or press F5) to run to the breakpoint. Click on the first menu choice to invoke the method. Your program will break at the first line of the event handler, as shown in Figure 21-14.
Figure 21-14. Hitting the breakpoint
21.5.4.6 Examining variables and objects
Once the program is stopped, you can examine the value of objects and variables currently in scope. This process is incredibly intuitive and easy. Just place the mouse cursor over the top of any variable or object in the code, wait a moment, and a little pop-up window will appear with its current value
If the cursor hovers over a variable, the pop-up window will contain the type of variable, its value (if relevant), and any other properties it may have.
If the cursor hovers over some other object, the pop-up window will contain information relevant to its type, including its full namespace, its syntax, and a descriptive line of help.
Press F10 to step into the loop and ensure that the variable i has a meaningful value.
21.5.4.7 Immediate window
The Immediate window lets you type almost any variable, property, or expression and immediately see its value. To open the Immediate window, do any of the following:
- Press Ctrl+Alt+I.
- Select Immediate from the Debug/Windows menu commands.
- Click on the Windows icon of the Debug toolbar and select Immediate.
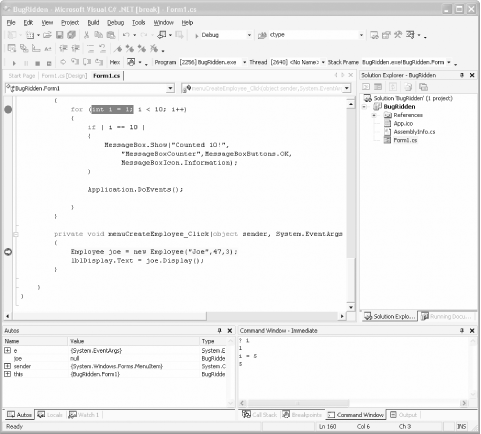
You can enter expressions for immediate execution in the Immediate window. If you want to see the value of an expression, prepend it with a question mark. For instance, if the breakpoint is on the line shown in Figure 21-14, you can see the value of the integer i by entering:
?i
in the Immediate window and pressing Enter. Figure 21-15 shows the result of that exercise; additionally, this figure shows how to assign a new value to the variable i and then view its value again.
Figure 21-15. Immediate window

You can clear the contents of the Immediate window by right-clicking anywhere in the window and selecting Clear All. Close the window by clicking on the X in the upper-righthand corner. If you close the window and subsequently bring it back up in the same session, it will still have all the previous contents.
As you step through this example, you can see that the variable i never reaches the value 10. That is because you've asked the for loop to count only as long as i is less than 10. Changing the for loop instruction fixes the problem.
for (int i = 1; i <= 10; i++)
21.5.5 Examining Objects
Try a somewhat more complicated example. Create a breakpoint in the first line of the mnuCreateEmployee_Click method. Run the program and choose the second menu choice, "Create Employee." Stop on the breakpoint as shown in Figure 21-16.
Figure 21-16. Breaking in the event handler
Press F11 to step into the method (the constructor). You now are brought to the first line of the Employee constructor. There is much to examine. First, open the call stack window by doing either of the following:
- Press Ctrl+Alt+C.
- Select Call Stack from the Debug/Windows menu commands.
You can examine the call stack from the Stack Frame drop-down menu in the Debug toolbar as well.
Both the Call Stack window (shown in Figure 21-17) and the Stack Frame drop-down menu (shown in Figure 21-18), show the same information: the list of method calls that brought you to this point in the program.
Figure 21-17. Call Stack window

Figure 21-18. Stack Frame Debug toolbar

In any case, you can see that you are now in the Employee constructor, and you can see the value of the parameters passed in to the constructor. While you are here, expand the this parameter in the Autos window (or the me parameter in a VB.NET application), as shown in Figure 21-19.
Figure 21-19. Autos window initial values

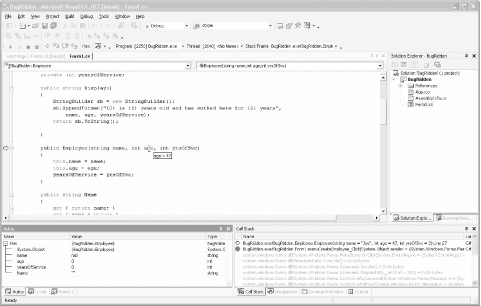
Before you go further, place the mouse over any parameter to the constructor, and let it hover for a moment. The value of the parameter is shown in a tool tip, illustrated in Figure 21-20.
Press F10 to step into the constructor, and continue to press F10 two more times to set the member variable name and age.
Figure 21-20. Tool tip shows values
21.5.5.1 Autos window
The Autos window shows all the variables used in the current statement and the previous statement, displayed in a hierarchical table. To open the Autos window, do any of the actions described in the list shown next.
- Press Ctrl+Alt+V, followed by A.
- Select Autos from the Debug/Windows menu commands.
- Click on the Windows icon of the Debug toolbar and select Autos.
The Autos window is shown in Figure 21-21.
Figure 21-21. Autos window
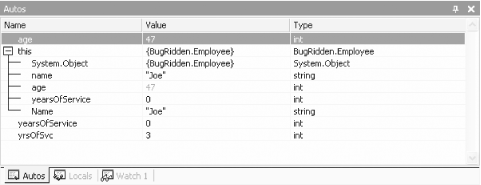
You will find columns for the Name of the object, its Value, and its Type. A plus sign next to an object indicates that it has child objects that are not displayed; a minus sign indicates that its child objects are visible. Clicking on a plus symbol expands the tree and shows all children, while clicking on a minus symbol contracts the tree and displays only the parent.
You can select and edit the value of any variable. Any changed value displays as red in the Autos window. Any changes to values take effect immediately.
21.5.5.2 Locals window
The Locals window is the same as the Autos window, except that it shows variables local to the current context. By default, the current context is the method or function containing the current execution location.
To open a Locals window, do any of the following:
- Press Ctrl+Alt+V, L. (Press and hold Ctrl+Alt+V, release all three keys, and then press L.)
- Select Locals from the Debug/Windows menu commands.
- Click on Windows icon of the Debug toolbar and select Locals.
21.5.5.3 This/Me window
The C# This window and the VB.NET Me window are exactly the same as the Autos window, except that they show all objects pointed to by this in C# and Managed C++ and by Me in VB.NET.
To open a This/Me window, do any of the following:
- Press Ctrl+Alt+V, T.(Press and hold Ctrl+Alt+V, release all three keys, then press T.)
- Select This or Me from the Debug/Windows menu commands.
- Click on the Windows icon of the Debug toolbar; select This or Me.
21.5.5.4 Watch window
The Watch window is the same as the Autos window, except that it shows only variables, properties, or expressions that you enter into the Name field in the window or drag from another window. The advantage to using a Watch window is that it lets you watch objects from several different source windows simultaneously and watch objects that might otherwise not be displayed (e.g., expressions, etc.). This overcomes the inability to add object types other than the specified type to any other debug window.
To open a Watch window, do any of the following:
- Press Ctrl+Alt+W, followed by n, where n is either 1, 2, 3, or 4.
- Select Watch from the Debug/Windows menu commands.
- Click on the Windows icon of the Debug toolbar and select Watch.
In addition to typing in the name of the object you want to watch, you can drag-and-drop variables, properties, or expressions from a Code window. Select the object in the code that you want to put in the Watch window, and then drag it to the Name field in the open Watch window.
You can also drag-and-drop objects from any of the following windows into the Watch window:
- Locals
- Autos
- This/Me
- Disassembly
To drag something from one of these windows to the Watch window, both the source window and the Watch window must be open. Highlight a line in the source window, and then drag it down over the Watch tab. The Watch window will come to the foreground. Continue dragging the object to an empty line in the Watch window.
21.5.5.5 Threads window
The Threads window lets you examine and control threads in the program you are debugging. Threads are sequences of executable instructions. Programs can be either single-threaded or multithreaded. The topic of threading and multiprocess programming is beyond the scope of this book. For a complete discussion of threading, see Programming C#, Third Edition, or Programming Visual Basic .NET, Second Edition, both by Jesse Liberty (O'Reilly).
To open a Threads window, do any of the following:
- Press Ctrl+Alt+H.
- Select Threads from the Debug/Windows menu commands.
- Click on the Windows icon of the Debug toolbar and select Threads.
21.5.5.6 Modules window
The Modules window lets you examine the .exe and .dll files that are used by the program being debugged. To open a Modules window, do any of the following:
- Press Ctrl+Alt+U.
- Select Modules from the Debug/Windows menu commands.
- Click on the Windows icon of the Debug toolbar and select Modules.
A modules window is shown in Figure 21-22.
Figure 21-22. Modules window

By default, the modules are shown in the order in which they were loaded. You can resort the table by clicking on any column header.
21.5.5.7 Disassembly window
The Disassembly window shows the current program in assembly code. If you are debugging managed code, such as code from VB.NET, C#, or Managed C++, this window will correspond to the Just In Time compiled code.
A Disassembly window is shown in Figure 21-23.
Figure 21-23. Disassembly window
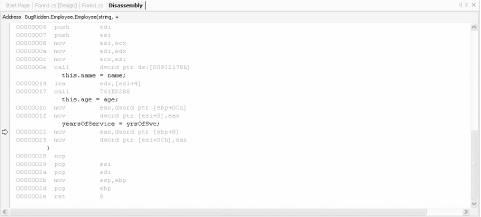
Unlike the previous several windows, the Disassembly window displays as a tabbed item and as part of the main Source code window. You can set breakpoints anywhere in the window, as you can for any other Source code window. To open a Disassembly window, do any of the following:
- Press Ctrl+Alt+D.
- Select Disassembly from the Debug/Windows menu commands.
- Click on the Windows icon of the Debug toolbar and select Disassembly.
21.5.5.8 Registers window
The Registers window lets you examine the contents of the microprocessor's registers. Values that have recently changed are displayed in red. To open a Registers window, do any of the following:
- Press Ctrl+Alt+G.
- Select Registers from the Debug/Windows menu commands.
- Click on Windows icon of the Debug toolbar and select Registers.
You can select which pieces of information to view by right-clicking anywhere in the Registers window and clicking on the information you would like displayed.
21.5.5.9 Memory windows
Four Memory windows are available for viewing memory dumps of large buffers, strings, and other data that will not display well in any other window. To open a Memory window, do any of the following:
- Press Ctrl+Alt+M followed by n, where n is either 1, 2, 3, or 4.
- Select Memory from the Debug/Windows menu commands.
- Click on the Windows icon of the Debug toolbar and select Memory.
Windows Forms and the .NET Framework
Getting Started
Visual Studio .NET
- Overview
- Start Page
- Projects and Solutions
- The Integrated Development Environment (IDE)
- Building and Running
Events
Windows Forms
- Windows Forms
- Web Applications Versus Windows Applications
- The Forms Namespace
- Form Properties
- Forms Inheritance
- User Interface Design
Dialog Boxes
- Dialog Boxes
- Modal Versus Modeless
- Form Properties
- DialogResult
- Termination Buttons
- Apply Button
- CommonDialog Classes
Controls: The Base Class
Mouse Interaction
Text and Fonts
Drawing and GDI+
Labels and Buttons
Text Controls
Other Basic Controls
TreeView and ListView
List Controls
Date and Time Controls
Custom Controls
- Custom Controls
- Specializing an Existing Control
- Creating a User Control
- Creating Custom Controls from Scratch
Menus and Bars
ADO.NET
- ADO.NET
- Bug Database: A Windows Application
- The ADO.NET Object Model
- Getting Started with ADO.NET
- Managed Providers
- Binding Data
- Data Reader
- Creating a DataGrid
Updating ADO.NET
- Updating ADO.NET
- Updating with SQL
- Updating Data with Transactions
- Updating Data Using DataSets
- Multiuser Updates
- Command Builder
Exceptions and Debugging
- Exceptions and Debugging
- Bugs Versus Exceptions
- Exceptions
- Throwing and Catching Exceptions
- Bugs
- Debugging in Visual Studio .NET
- Assert Yourself
Configuration and Deployment
EAN: 2147483647
Pages: 148

