Data Flow and Control Flow
For years, data flow and control flow were seen as the primary means to document a software system. Although modern software architecture principles have evolved into the more general study of structures and behavior, these two venerable aspects of softwaredata and controlrule the day in a few pockets of practice. How do they relate to what we would call a more holistic architecture documentation package?
11.7.1 Data Flow Views
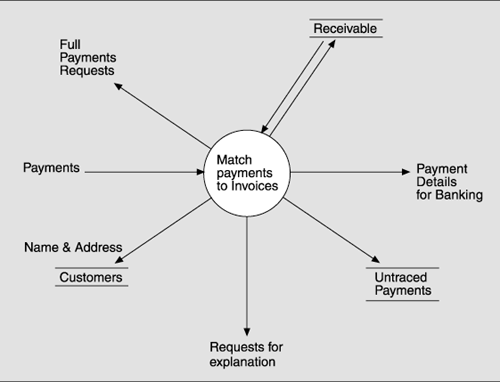
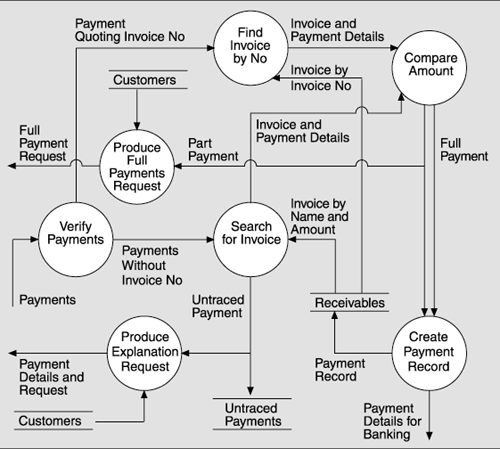
Data flow views of a system are exemplified by data flow diagrams (DFDs), a concept made famous by the structured analysis methods of the 1970s. If your intent is to represent data flows as described earlier, you should choose a style in the C&C viewtype. This viewtype lets you define components for data processing and for data stores. A connector in a C&C view describes an interaction or a protocol between components but usually not the data that flows across the connector. Therefore, to represent data flow diagrams, define a C&C style in which components are proceduresprocessesand/or data stores, and the connector is a "data exchange" connector with the additional property of names of data flows. Table 11.13 shows how to represent data flow diagrams in the C&C viewtype.
| Data Flow Diagram Term | Our Term | |
|---|---|---|
| Components | Procedure | Component: functionality |
| Data store | Component: data store | |
| Connectors | Data exchange | Communication + data flow name |
You may also want to describe data flow aspects of modules represented in a style of the module viewtype. To document data type dependencies, you can show which modules are producers or consumers of a specific data type. Representing data flow in a module viewtype is done by defining a style specializing the depends-on relation into a sends-data-to relation. In case it is of interest, data stores can be defined as a specialized type of module. Table 11.14 shows how to represent data flow diagrams in the module viewtype.
| Data Flow Diagram Term | Our Term | |
|---|---|---|
| Element | Procedure | Module |
| Data store | Specialized module as data store | |
| Relation | Data flow | Sends-data-to, specialized from depends-on |
The allocation viewtype also has the potential to document data flow aspects, especially if analyzing network or storage capacities is important. Such a diagram would represent how much information flows at a time over a network connection or how many megabytes are required for either persistent or temporary storage. Table 11.15 shows how to represent data flow diagrams in the allocation viewtype.
| Data Flow Diagram Term | Our Term | |
|---|---|---|
| Software element | Procedure | Process |
| Data store | Specialized module as data store | |
| Environmental element | Processor | Physical unit: data store |
| Data storage | Physical unit: processor | |
| Relation | Data flow | Sends-data-to |
| Communication channel | Communication |
Finally, note that DFDs don't make the strong distinction among modules, components, and hardware platforms that more modern treatments of architecture do. So if your goal is to reproduce the classic data flow diagrams of structured-analysis fame, you may have to define a hybrid style that combines the module, C&C, and allocation styles. Data dictionaries, a strong part of DFD method, have their counterpart in the element catalogs described in Chapter 10. P-specs, which are essentially pseudocode representations of the elements, can be captured as behavioral information in our world.
If you are a diehard member of the DFD community, take comfort in the fact that you can achieve your goals with the methods of this book. But heed the advice given for the other documentation approaches in this chapter: Augment your favorite with other useful views; then complete the package by adding supporting documentation and beyond view documentation.
11.7.2 Control Flow Views
Whereas a data flow diagram portrays a system from the point of view of the data, a control flow graph, such as a flowchart, portrays the functionality that performs transformation on the data. In Chapter 8, we introduced several modeling languages, some of which have flowchartlike control symbols, such as decisions and loops. Therefore, if flowcharts are part of your system documentation and you are looking for a place to put them in a documentation package prescribed, you can regard them as a form of behavioral documentation and use them in conjunction with any viewtype. In some casesfor example, to support performance analysis or to build in an aid for later debugginga control flow notation in the primary presentation of a view might be of interest.
In a C&C style, the use of a specific connector defines a control flow, or interaction, between the connected components. (See Table 11.16.) In a module viewtype, control flows would be represented as a uses relation specialized into a transfers-control relation. (See Table 11.17.) In a deployment viewtype, the change of control in the execution environment can be represented. Performance, security, and availability analyses that include the execution platform rely on understanding the flow of control within the system. (See Table 11.18.)
|
Thus, classic flowcharts, which detail the behavior of programs, can be used as a way to specify the behavior of elements, although many other, more suitable languages are available to do that. At coarser levels of granularity, however, it might make sense to show control flow among architectural elements as a view in its own right, but be clear on the expected use of such a view. Views based on other styles might do the same job and convey richer information as well.
| Control Flow Diagram Term | Our Term | |
|---|---|---|
| Components | Procedure | Component: process |
| Connectors | Control flow | Connector |
| Control Flow Diagram Term | Our Term | |
|---|---|---|
| Element | Procedure: process | Module |
| Relation | Control flow | Transfers-control-to specialized from uses |
| Control Flow Diagram Term | Our Term | |
|---|---|---|
| Software element | Procedure: process | Process |
| Environmental element | Physical unit | |
| Relation | Control flow | Communication specialized to control flow |
Software Architectures and Documentation
- P.1. The Role of Architecture
- P.2. Uses of Architecture Documentation
- P.3. Interfaces
- P.4. Views
- P.5. Viewtypes and Styles
- P.6. Seven Rules for Sound Documentation
- P.7. Summary Checklist
- P.8. Discussion Questions
- P.9. For Further Reading
Part I. Software Architecture Viewtypes and Styles
The Module Viewtype
- Overview
- Elements, Relations, and Properties of the Module Viewtype
- What the Module Viewtype Is For and What Its Not For
- Notations for the Module Viewtype
- Relation to Other Viewtypes
- Summary Checklist
- Discussion Questions
- For Further Reading
Styles of the Module Viewtype
- Styles of the Module Viewtype
- Decomposition Style
- Uses Style
- Generalization Style
- Layered Style
- Summary Checklist
- Discussion Questions
- For Further Reading
The Component-and-Connector Viewtype
- Overview
- Elements, Relations, and Properties of the C&C Viewtype
- What the C&C Viewtype Is For and What Its Not For
- Relation to Other Viewtypes
- Summary Checklist
- Discussion Questions
- For Further Reading
Styles of the Component-and-Connector Viewtype
- Styles of the Component-and-Connector Viewtype
- The Pipe-and-Filter Style
- Shared-Data Style
- Publish-Subscribe Style
- Client-Server Style
- Peer-to-Peer Style
- Communicating-Processes Style
- Notations for C&C Styles
- Summary Checklist
- Discussion Questions
- For Further Reading
The Allocation Viewtype and Styles
- Overview
- Elements, Relations, and Properties of the Allocation Viewtype
- Deployment Style
- Implementation Style
- Work Assignment Style
- Summary Checklist
- Discussion Questions
- For Further Reading
Part II. Software Architecture Documentation in Practice
- Part II. Software Architecture Documentation in Practice
- ECS Architecture Documentation Roadmap
- ECS System Overview
- ECS Software Architecture View Template
- Mapping Between Views
- Directory
- Architecture Glossary and Acronym List
- Module Decomposition View
- Module Uses View
- Module Generalization View
- Module Layered View
- C&C Pipe-and-Filter View
- C&C Shared-Data View
- C&C Communicating-Processes View
- Allocation Deployment View
- Allocation Implementation View
- Allocation Work Assignment View
Advanced Concepts
- Advanced Concepts
- Chunking Information: View Packets, Refinement, and Descriptive Completeness
- Using Context Diagrams
- Combined Views
- Documenting Variability and Dynamism
- Creating and Documenting a New Style
- Summary Checklist
- Discussion Questions
- For Further Reading
Documenting Software Interfaces
- Overview
- Interface Specifications
- A Standard Organization for Interface Documentation
- Stakeholders of Interface Documentation
- Notation for Interface Documentation
- Examples of Interface Documentation
- Summary Checklist
- Discussion Questions
- For Further Reading
Documenting Behavior
- Beyond Structure
- Where to Document Behavior
- Why to Document Behavior
- What to Document
- How to Document Behavior: Notations and Languages
- Summary Checklist
- Discussion Questions
- For Further Reading
Choosing the Views
- Choosing the Views
- Stakeholders and Their Documentation Needs
- Making the Choice
- Two Examples
- Summary Checklist
- Discussion Questions
- For Further Reading
Building the Documentation Package
- Building the Documentation Package
- One Document or Several?
- Documenting a View
- Documentation Beyond Views
- Validating Software Architecture Documentation
- Summary Checklist
- Discussion Questions
- For Further Reading
Other Views and Beyond
- Other Views and Beyond
- Overview
- Rational Unified Process/Kruchten 4+1
- UML
- Siemens Four Views
- C4ISR Architecture Framework
- ANSI/IEEE-1471-2000
- Data Flow and Control Flow
- RM-ODP
- Where Architecture Documentation Ends
- A Final Word
- For Further Reading
- Appendix A. Excerpts from a Software Architecture Documentation Package
- Volume I ECS Software Architecture Documentation Beyond Views
Rationale, Background, and Design Constraints
References
EAN: 2147483647
Pages: 152
