Hack 32. Hack on Base Maps in Your Favorite Image Editor


You don't always have to rely on complicated GIS software to make maps that tell your story. In fact, sometimes it's a lot easier not to.
While writing [Hack #29], we had the chance to explore the flatplanet catalog of free world maps, which can be found online at http://flatplanet.sourceforge.net/maps/. This collection offers world maps based on satellite imagery, topography, temperature, rainfall, land use, demographics, plate tectonics, and more, but not a single map featuring political boundaries. (Actually, the population growth map shows political boundaries, but it also completely omits places for which no data was availablee.g., Greenland, Western Sahara, Eritrea, et al.)
Although we are philosophically opposed to the social and economic inequalities that political borders serve to maintain and foster, there is no denying that the same political borders offer a very immediate source of context to the stories we can tell with maps. From a storytelling context, borders offer a way of breaking up huge landmasses into smaller places that people have heard of, and maybe know something about. Wouldn't it be nice to have some of this lovely Earth imagery show international boundaries, as a way of offering more context to the other things we'd like to display on a world map?
At this point, a professional digital cartographer might reach for his GIS software and start loading vector layers, but we wanted something easier. For starters, where to get a decent vector layer that represents the world's current set of political borders and isn't encumbered by licensing restrictions? One easy answer is the Generic Mapping Tools, or GMT, which includes a free, reasonably current set of international-boundary vectors at a reasonable resolution. GMT is covered in great detail in [Hack #28] . For now, we'll simply assume you have it installed.
GMT outputs its maps in PostScript, which makes good sense for a software package whose original purpose in life was to help scientists make maps for publications. However, even though it can be used to draw very precise vector maps, PostScript is not particularly renowned as a common GIS format. Many image editors, on the other hand, can work with PostScript just fine, including our favorite, the GIMP. The same image editors also have no trouble with the JPEG images available from the flatplanet project. So why not use them to make new maps? Let's walk through what we did to add political borders to the Blue Marble map of Earth.
3.12.1. Drawing the Political Boundary Layer
Let's start by generating the political-borders layer in PostScript using the pscoast command from GMT, as follows:
$ pscoast -JQ0/11i -R-180/180/-90/90 -N1/3 -A4000/0/2 > world.ps
The -JQ0/11 option to pscoast tells it that we want an Equidistant Cylindrical projection of the world to match the projection used in the flatplanet maps, centered on the prime meridian (i.e., 0 degrees longitude), plotted 11 inches wide, which is the largest size page that the GIMP will import. -R-180/180/-90/90 asks pscoast for a map of the whole world. The -N option tells it to draw political boundaries. In this case, we want just the international borders, drawn with a three-pixel-wide pen. Note that we're not asking pscoast to draw coastlines, or fill any of the shapes, because we will want to see coastlines and landmass details from our underlying JPEG base map instead.
Finally, -A4000/0/2 filters pscoast's vector database in such a way that features less than 4,000 km2 in area, or more than two levels down hierarchically (out of a total of four levels), are omitted. You'll want to refer to the GMT documentation for further clarification on how this works, but our particular selection ensures that most nations and large lakes are included, but small islands, smaller lakes, and rivers will be excluded. Without specifying -A, we get everything in the vector database that ships with GMT, which is quite a lot, and really too much detail for the scale of the map we want to draw.
|

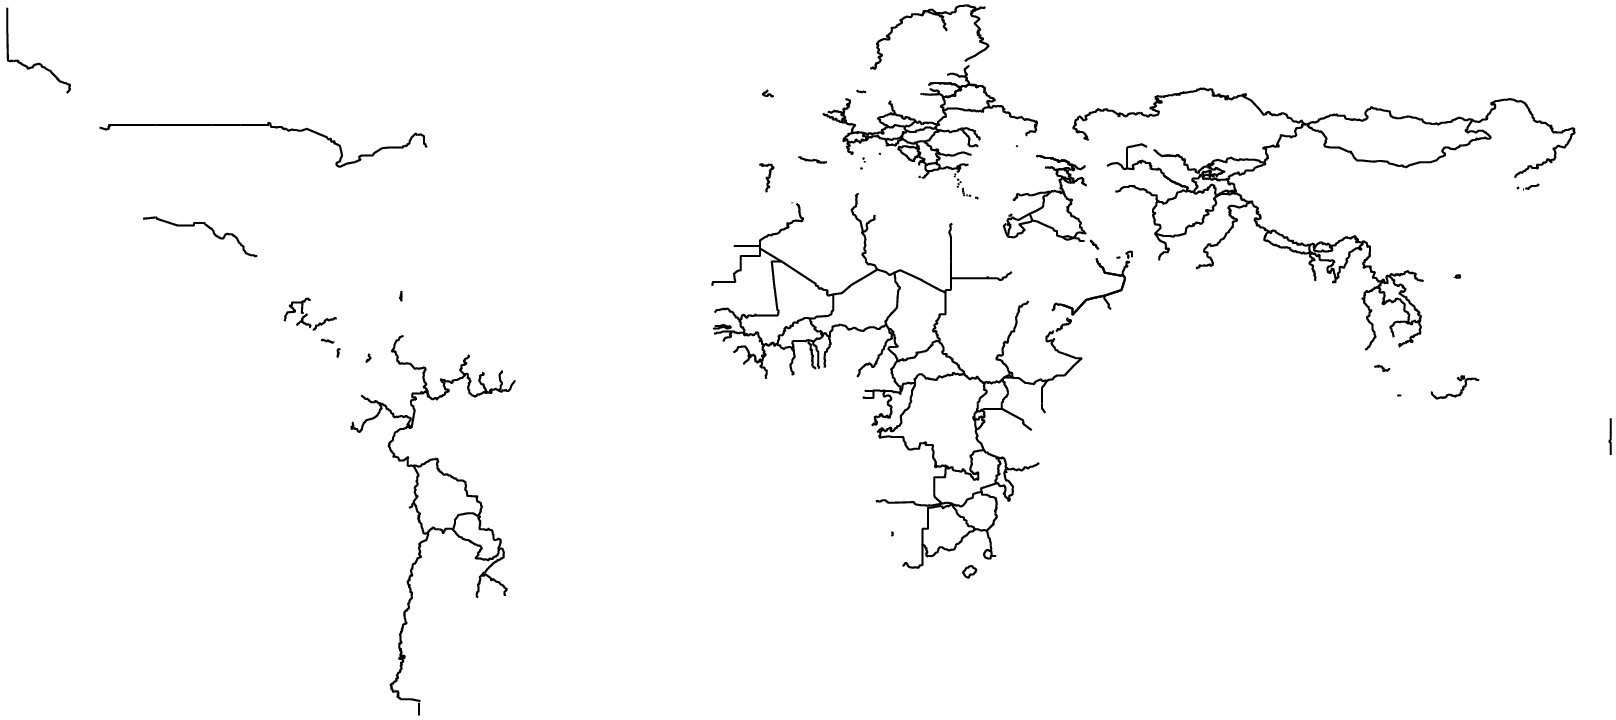
Figure 3-36 shows the output from pscoast. It's kind of interesting to see just how much of the world's political boundaries are formed by the shapes of the planet's coastlines. You might notice, for example, that New Zealand and bits of eastern Siberia are missing from the image; that's because there are no land boundaries in that part of the world!
Figure 3-36. The world's political borders, as generated by GMT
3.12.2. Importing the Map Layers
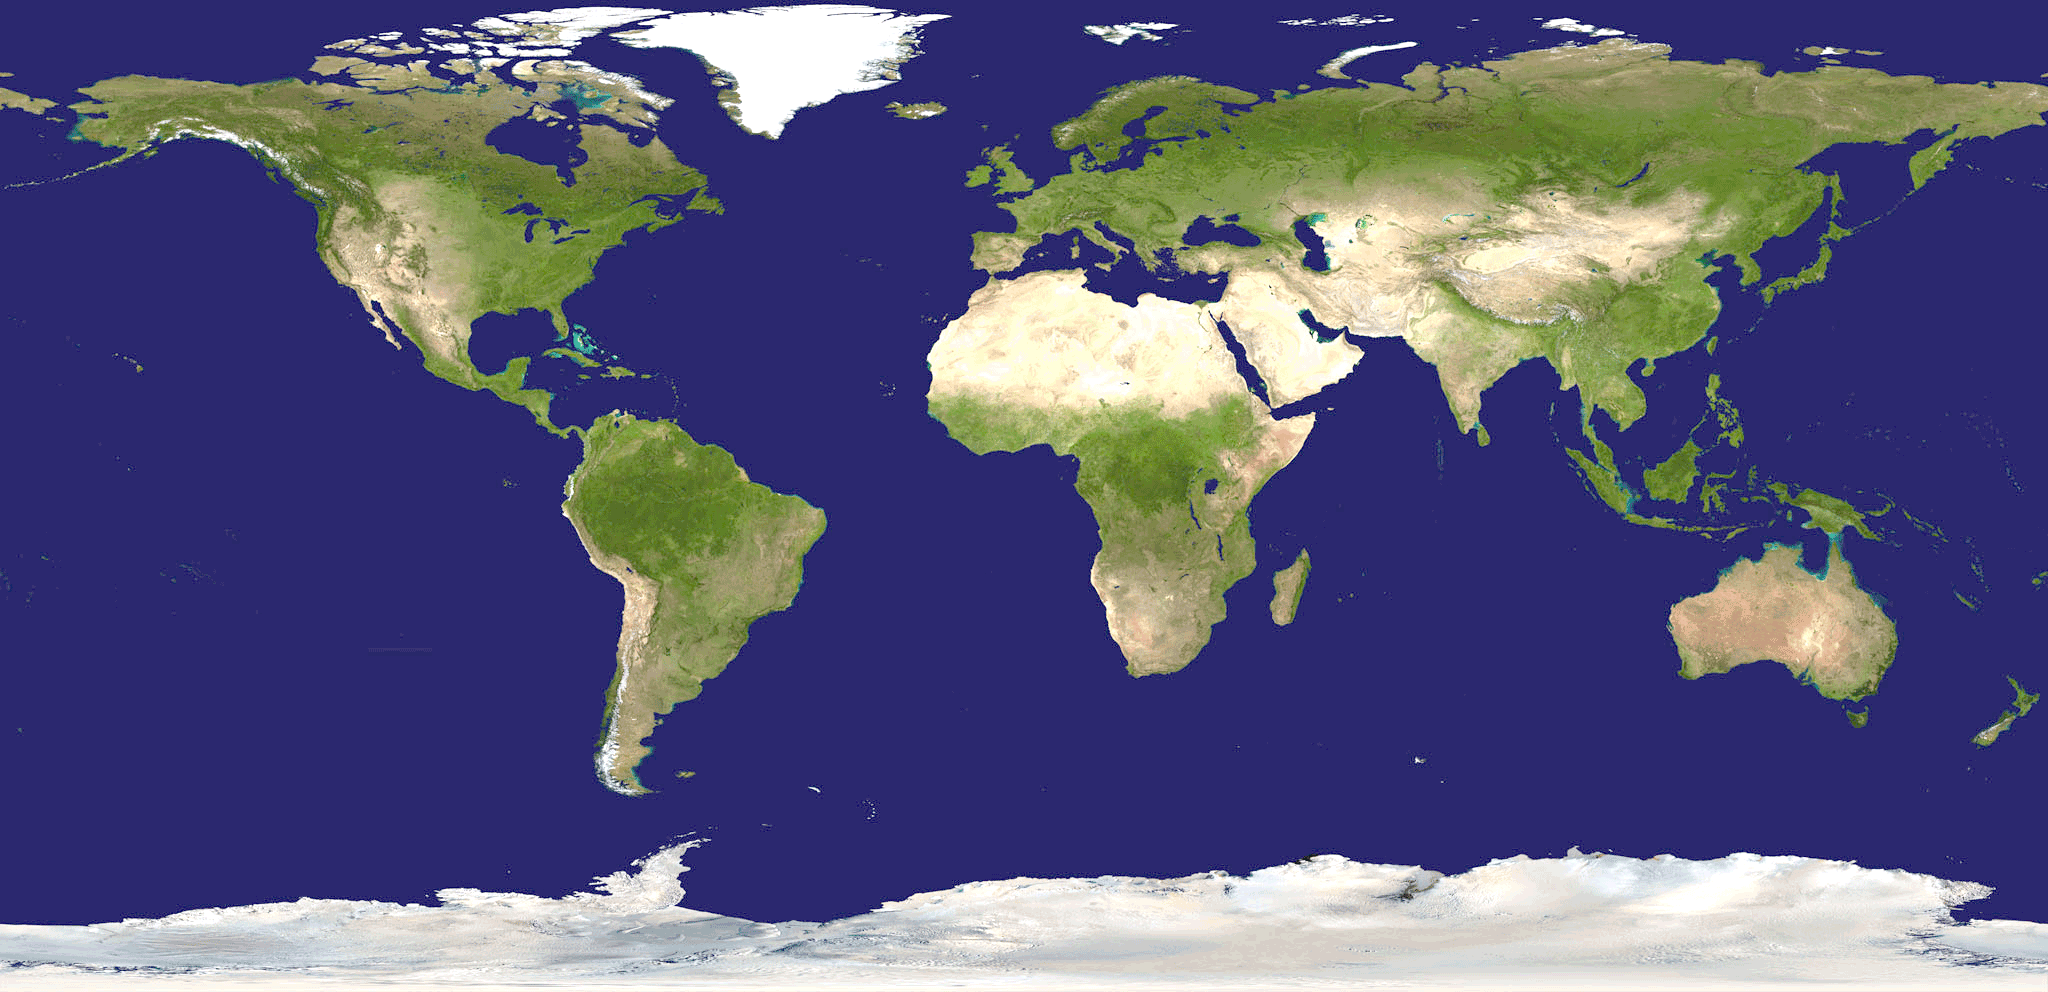
Now, let's switch to our image editor. We like the GIMP, but any advanced image editorlike Photoshop, for examplewill have all of the features and tools we describe. First, grab the image you want to overlay the political boundaries on. We chose the 2048x1024 pixel Blue Marble image from http://flatplanet.sourceforge.net/maps/natural.html, but any of the images on that page will do. You can also find a copy of this image at http://mappinghacks.com/maps/land_shallow_topo_2048.jpg. Save it to your hard drive, and load it up in your image editor. This image will serve as the base layer, over which we'll drape the boundaries layer. Figure 3-37 shows what this image looks like.
Figure 3-37. NASA's Blue Marble map of Earth
Next, we'll import the boundaries layer, which we saved earlier as world.ps. Loading a PostScript file will trigger a dialog that provides the image editor with some hints about how to rasterize the vector data. In the GIMP, PostScript files always load in portrait orientation at 8.5"x11", so the resolution we select influences how many pixels wide and high the imported image will be. We want to select a resolution that will make the two images come out the same size. Since our underlying JPEG image is 2048 pixels wide, we need to divide 2048 pixels by 11 inches to get a resolution of around 186 dots per inch (dpi), which will make the two images more or less match. At this resolution, the boundary layer becomes 2046 pixels wide, which is close enough.
The PostScript import dialog in the GIMP also offers anti-aliasing options. Anti-aliasing fuzzes out the curves and corners in the rasterized version of the vector drawing, so we don't end up with jagged-looking edges. We opted for high graphical anti-aliasing for our boundary layer, but you might want to tweak this setting to see what you end up with. You should now have two different images loaded, one of the satellite imagery and another of the political boundaries.
3.12.3. Combining the Layers to Make a New Map
The first thing you'll notice about the boundary layerin the GIMP, anywayis that it's lying on its side! That's because GMT produces landscape-oriented PostScript by default, but the GIMP assumes that all PostScript is portrait-oriented. So the first thing to do is to correct this, by clicking on the boundary layer, and then selecting "Image images/ent/U2192.GIF border=0> Transform
images/ent/U2192.GIF border=0> Rotate 90 degrees CW" from the drop-down menu. This should rotate the image such that it's now oriented correctly. Now execute Edit
images/ent/U2192.GIF border=0> Selection
images/ent/U2192.GIF border=0> Select All to select the entire image, and then Edit
images/ent/U2192.GIF border=0> Copy to copy it to the clipboard.
Next, click on the Blue Marble image and run Edit images/ent/U2192.GIF border=0> Paste to paste the boundary image in as a floating layer, which should make the Blue Marble image disappear beneath it. We need to alter the opacity of the boundary layer so that the white parts become transparent, leaving only the black borders. In the GIMP, you can go to Tools
images/ent/U2192.GIF border=0> Layer Dialog, which pops up a dialog displaying both layers of the current image. Click on the upper of the two, which should be the floating layer containing our political boundaries. Then click the drop-down menu labeled Opacity, and change it from Normal to Multiply. Suddenly, the white background of the boundary layer disappears, and the topographic map of Earth reappears beneath it!
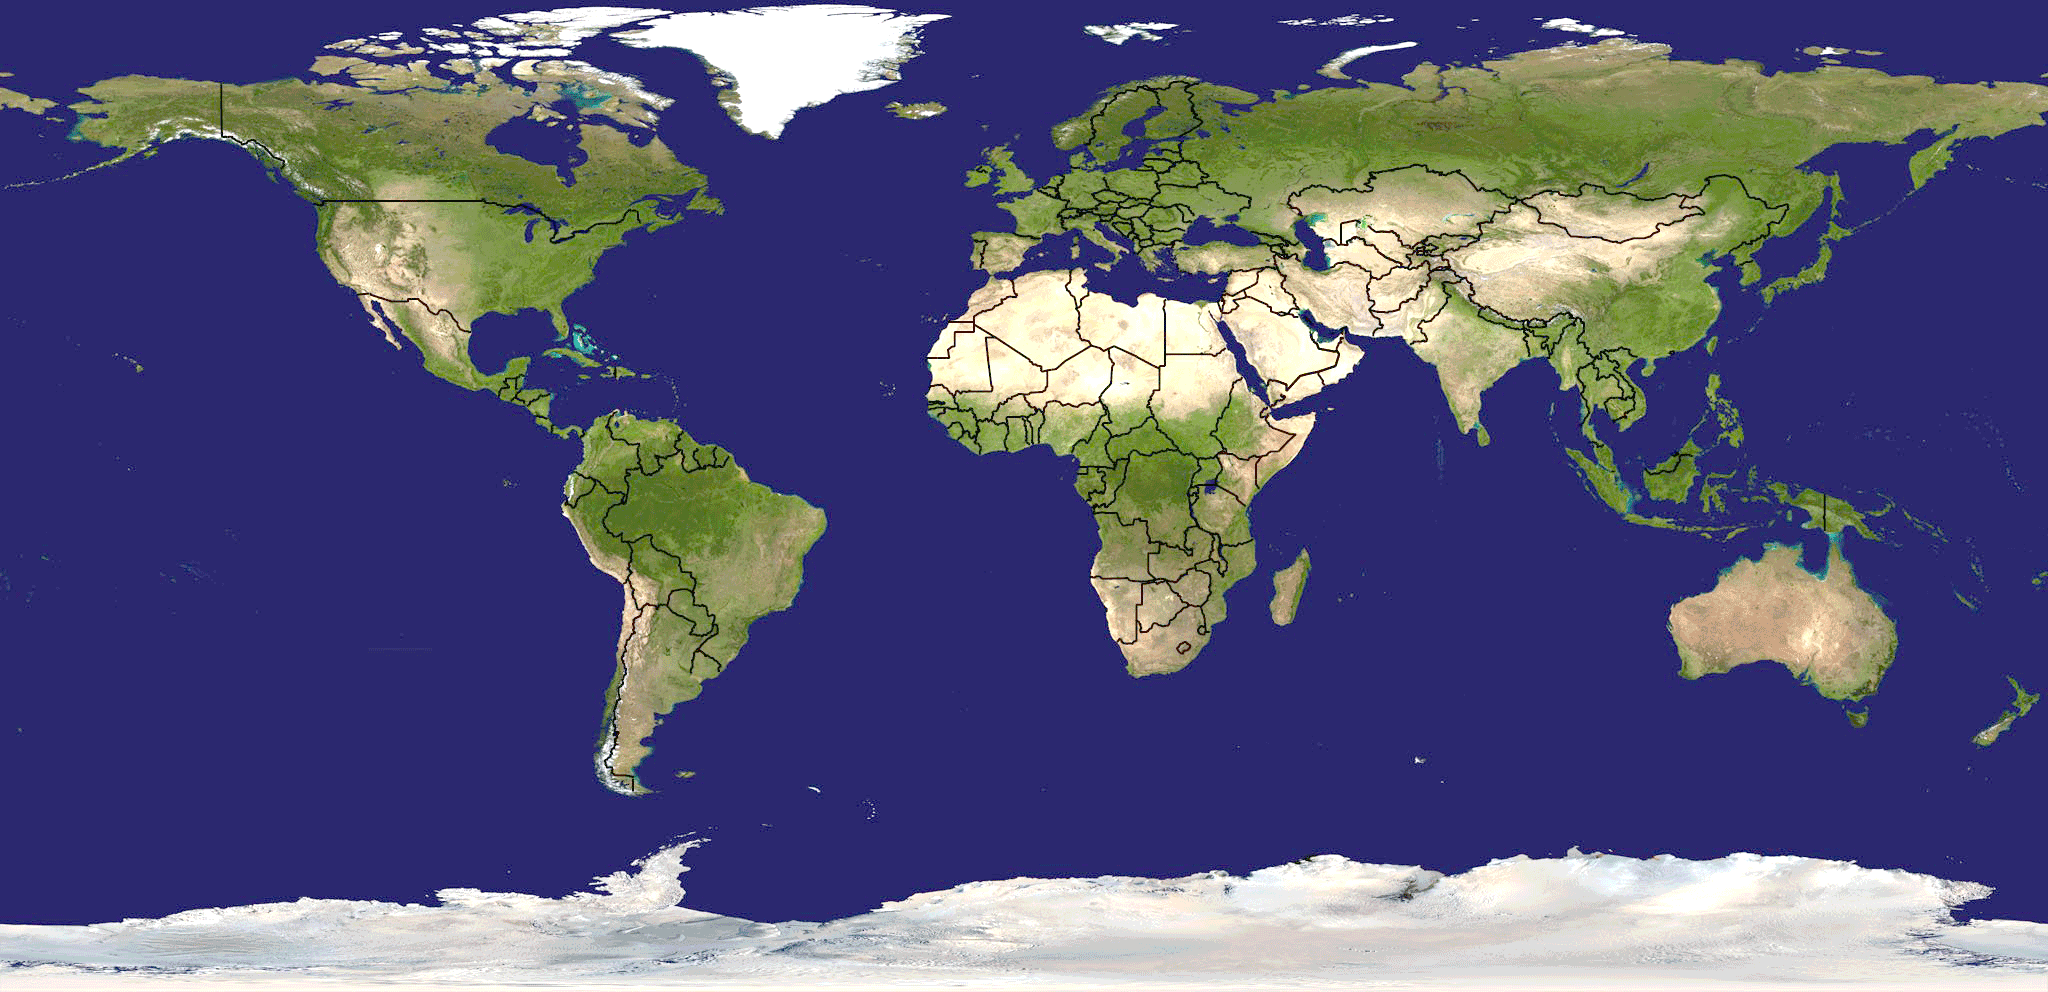
The last thing we need to fix is that the boundary layer is probably in the wrong place with respect to the Blue Marble image underneath. Select the Move tool from the toolbox (or hit the M key in the GIMP), and you should be able to drag the political boundary layer around over the top of the topographic map. You should be able to drag the boundaries almost into place with the mouse; then zoom in and nudge the image with your arrow keys, until the upper layer falls into place. The last couple of pixels might be a little challenging, so try zooming in on a region that you're really familiar with for this part. We chose the area around Michigan and Ontario as a good place for aligning the two layers, because the border there conforms pretty closely to the shape of the land and lake areas. Finally, hit the Anchor Layer button on the Layer dialog, and you're done! Figure 3-38 shows the two layers, aligned and merged. You can find a copy of this map image online at http://mappinghacks.com/maps/ for use in your own projects.
Figure 3-38. Our new political map of the world, using NASA's Blue Marble imagery and international boundary vectors from GMT
Now, a GIS expert might be horrified at this approach, but you're not going to be using this map for oil drilling or disaster relief, are you? When you're telling stories with maps, and precision is not a great concern, there's nothing wrong with using the tools you have at hand.
3.12.4. See Also
- [Hack #28]
- [Hack #29]
Mapping Your Life
- Hacks 1-13
- Hack 1. Put a Map on It: Mapping Arbitrary Locations with Online Services
- Hack 2. Route Planning Online
- Hack 3. Map the Places Youve Visited
- Hack 4. Find Your House on an Aerial Photograph
- Hack 5. The Road Less Traveled by in MapQuest
- Hack 6. Make Route Maps Easier to Read
- Hack 7. Will the Kids Barf?
- Hack 8. Publish Maps of Your Photos on the Web
- Hack 9. Track the Friendly Skies with Sherlock
- Hack 10. Georeference Digital Photos
- Hack 11. How Far? How Fast? Geo-Enabling Your Spreadsheet
- Hack 12. Create a Distance Grid in Excel
- Hack 13. Add Maps to Excel Spreadsheets with MapPoint
Mapping Your Neighborhood
- Hacks 14-21
- Hack 14. Make Free Maps of the United States Online
- Hack 15. Zoom Right In on Your Neighborhood
- Hack 16. Who Are the Neighbors Voting For?
- Hack 17. Map Nearby Wi-Fi Hotspots
- Hack 18. Why You Cant Watch Broadcast TV
- Hack 19. Analyze Elevation Profiles for Wireless Community Networks
- Hack 20. Make 3-D Raytraced Terrain Models
- Hack 21. Map Health Code Violations with RDFMapper
Mapping Your World
- Hacks 22-34
- Hack 22. Digging to China
- Hack 23. Explore David Rumseys Historical Maps
- Hack 24. Explore a 3-D Model of the Entire World
- Hack 25. Work with Multiple Lat/Long Formats
- Hack 26. Work with Different Coordinate Systems
- Hack 27. Calculate the Distance Between Points on the Earths Surface
- Hack 28. Experiment with Different Cartographic Projections
- Hack 29. Plot Arbitrary Points on a World Map
- Hack 30. Plot a Great Circle on a Flat Map
- Hack 31. Plot Dymaxion Maps in Perl
- Hack 32. Hack on Base Maps in Your Favorite Image Editor
- Hack 33. Georeference an Arbitrary Tourist Map
- Hack 34. Map Other Planets
Mapping (on) the Web
- Hacks 35-46
- Hack 35. Search Local, Find Global
- Hack 36. Shorten Online Map URLs
- Hack 37. Tweak the Look and Feel of Web Maps
- Hack 38. Add Location to Weblogs and RSS Feeds
- Hack 39. View Your Photo Thumbnails on a Flash Map
- Hack 40. Plot Points on a Spinning Globe Applet
- Hack 41. Plot Points on an Interactive Map Using DHTML
- Hack 42. Map Your Tracklogs on the Web
- Hack 43. Map Earthquakes in (Nearly) Real Time
- Hack 44. Plot Statistics Against Shapes
- Hack 45. Extract a Spatial Model from Wikipedia
- Hack 46. Map Global Weather Conditions
Mapping with Gadgets
- Hacks 47-63
- How GPS Works
- Hack 47. Get Maps on Your Mobile Phone
- Hack 48. Accessorize Your GPS
- Hack 49. Get Your Tracklogs in Windows or Linux
- Hack 50. The Serial Port to USB Conundrum
- Hack 51. Speak in Geotongues: GPSBabel to the Rescue
- Hack 52. Show Your Waypoints on Aerial Photos with Terrabrowser
- Hack 53. Visualize Your Tracks in Three Dimensions
- Hack 54. Create Your Own Maps for a Garmin GPS
- Hack 55. Use Your Track Memory as a GPS Base Map
- Hack 56. Animate Your Tracklogs
- Hack 57. Connect to Your GPS from Multiple Applications
- Hack 58. Dont Lose Your Tracklogs!
- Hack 59. Geocode Your Voice Recordings and Other Media
- Hack 60. Improve the Accuracy of Your GPS with Differential GPS
- Hack 61. Build a Map of Local GSM Cells
- Hack 62. Build a Car Computer
- Hack 63. Build Your Own Car Navigation System with GpsDrive
Mapping on Your Desktop
- Hacks 64-77
- Hack 64. Mapping Local Areas of Interest with Quantum GIS
- Hack 65. Extract Data from Maps with Manifold
- Hack 66. Java-Based Desktop Mapping with Openmap
- Hack 67. Seamless Data Download from the USGS
- Hack 68. Convert Geospatial Data Between Different Formats
- Hack 69. Find Your Way Around GRASS
- Hack 70. Import Your GPS Waypoints and Tracklogs into GRASS
- Hack 71. Turn Your Tracklogs into ESRI Shapefiles
- Hack 72. Add Relief to Your Topographic Maps
- Hack 73. Make Your Own Contour Maps
- Hack 74. Plot Wireless Network Viewsheds with GRASS
- Hack 75. Share Your GRASS Maps with the World
- Hack 76. Explore the Effects of Global Warming
- Conclusion
- Hack 77. Become a GRASS Ninja
Names and Places
- Hacks 78-86
- Hack 78. What to Do if Your Government Is Hoarding Geographic Data
- Hack 79. Geocode a U.S. Street Address
- Hack 80. Automatically Geocode U.S. Addresses
- Hack 81. Clean Up U.S. Addresses
- Hack 82. Find Nearby Things Using U.S. ZIP Codes
- Hack 83. Map Numerical Data the Easy Way
- Hack 84. Build a Free World Gazetteer
- Hack 85. Geocode U.S. Locations with the GNIS
- Hack 86. Track a Package Across the U.S.
Building the Geospatial Web
- Hacks 87-92
- Hack 87. Build a Spatially Indexed Data Store
- Hack 88. Load Your Waypoints into a Spatial Database
- Hack 89. Publish Your Geodata to the Web with GeoServer
- Hack 90. Crawl the Geospatial Web with RedSpider
- Hack 91. Build Interactive Web-Based Map Applications
- Hack 92. Map Wardriving (and other!) Data with MapServer
Mapping with Other People
- Hacks 93-100
- Hack 93. Node Runner
- Hack 94. Geo-Warchalking with 2-D Barcodes
- Hack 95. Model Interactive Spaces
- Hack 96. Share Geo-Photos on the Web
- Hack 97. Set Up an OpenGuide for Your Hometown
- Hack 98. Give Your Great-Great-Grandfather a GPS
- Hack 99. Map Your Friend-of-a-Friend Network
- Hack 100. Map Imaginary Places
EAN: 2147483647
Pages: 172
