Conduct Data Collection
Overview
When thinking about kanban, many people get a cold shiver and fear that they will be changing over their production process every ten minutes with excessive scrap and downtime. They think this because they lack experience in kanban and they assume that kanban is an end unto itself. Kanban is an execution system that helps control the process schedule based on actual demand. Kanban is not a magic demon that makes you do dumb things against your will. If these fears do materialize, it is usually because the organization designed a system that was not based on the realities of their current operation.
Therefore, to avoid your own personal nightmare, start the kanban process by documenting your current state. Using the team, take a snapshot in time of your operating parameters, inventory, etc. Look at your organization as it is, not as you want it to be. When you have the data collected, summarize the data to understand the current state in preparation for calculating the kanban. We will use the data gathered in this chapter to calculate the size of the kanban in Chapter 4. Figure 3-1 graphically depicts this relationship.
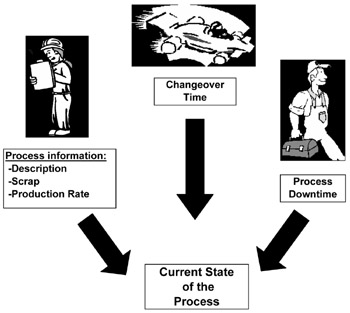
Figure 3-1: The Data Collection Process.
Use this two-step process to ensure you have the necessary data for sizing the kanban in Chapter 4:
- Gather data
- Analyze the data
To further assist in the data collection process, we will present a data collection form and two examples to help explain the process.
Gather Data
The process of developing the current status of kanban candidates begins with gathering the necessary data to help characterize the potential process. To adequately define the process you will need the following information:
- Number of parts produced by the process
- Changeover times
- Downtime
- Scrap levels
When collecting this data, be honest with yourselves. The data is intended to help you develop a usable design. If the data is inaccurate, then you will potentially doom the project to failure before it even starts. When starting the data collection process, use the following guidance to make sure the team collects the proper data:
- Be specific about the data required
- Assess the data to confirm that it matches the team's experience and knowledge of the process
If you discover that the data does not make sense, then review the data again and sort out the truth. Don't be afraid to collect new data!
Number of Parts Produced by the Target Process
Start the data collection process by identifying the parts to be produced by the target process. Begin by breaking the production down into individual part numbers. Do not combine part numbers just because they are part of a common family, the same size , the same configuration, or the same color . We will use these similarities later in Chapter 5 during the design process to address preferred operating sequences. At this point we need to understand the magnitude of the project, which we can only do by knowing all the part numbers .
Conversely, if a part is common at this stage, but it is transformed into different part numbers later, then it should be considered one part number. For example, a 4"8" plate that is produced by a stamping die in one process, but is turned into five unique pieces downstream through future processing, would be considered only one part number in the original stamping process.
Be descriptive when gathering data ”look for both differentiation and commonality in the parts being produced. Take the time to sort through the data to determine these items; don't let a mound of data overwhelm you. During the data collection phase, keep asking questions until you arrive at a list that makes sense. Before beginning data collection by part number, you also need to determine what your production-scheduling interval will be. Essentially, do you produce to the monthly, weekly, or daily production requirements? The answer to this question will tell you the interval for the replenishment cycle. All your calculations must then be scaled to this interval, such as pieces per week, available time per week, etc.
Once you have selected a scheduling interval, then you need to determine the required parts for this interval. The required parts are the number of parts you use over the predetermined interval ”per day, per week, or even per month. These quantities represent the parts consumed by the "customer" at regular intervals, which you must regularly replenish to keep the customer supplied. (We use "customer" to refer to both internal and external customers.)
In conjunction with identifying the products that will be produced by the kanban system, you must also determine the rates of production. Review each product's production rate for realism . If you receive a blanket rate answer, use the team's experience to ask: Does everything really run at the same rate? Also, make sure you use consistent units and measurement systems for the production rate and description. Once again, the wrong rates will skew your numbers when creating the kanban design.
Changeover Times
Changeover time is the time from the last good production piece of the previous production run to the first good piece in the new production run. Many people cheat when they report changeover time by reporting the time from the last good production piece of the previous production run to the time the line starts up on the new production run. They conveniently decide to omit the time it takes to debug the start-up and begin running continuously. This subtly can be very important if you are trying to optimize the run quantities.
Don't fall into this trap. The kanban quantities and calculated replenishment cycle must be based on the time the process runs at the planned production rate.
Just like the part's description, consider the different products produced by the process and verify the changeover time for each changeover. Avoid broad-brushing the times and underestimating or overestimating the total changeover time.
Downtime
Downtime, or rather unplanned downtime, is the total time the process is scheduled to be producing parts, but it isn't. Basically, how many hours is the process not producing product but was scheduled to do so. Examples of unplanned downtime include shutting down for breakdowns or for lack of raw material. Unplanned downtime should not be confused with planned downtime, such as time allocated for breaks, lunches, maintenance, or cleanup. Scheduling the line down because of no production requirements is also considered planned downtime.
Realistically, look at the process's downtime. Determine an average for the downtime using experience as well as historical data. However, when looking at the historical downtime, don't let recent process improvements be overshadowed by the data. (Once again ”be honest and look at it as it is, not as you wish it were.)
Scrap Levels
Next, determine the system scrap rates for each product produced by the target process. System scrap is the process scrap rate plus the scrap rate of downstream processes. The system scrap rate will let you calculate the adjusted production requirements for each product. When calculating the adjusted production requirements you must account for the total amount needing to be produced. In Chapter 4 we will show you how to calculate the adjusted production requirements. If your plant tracks scrap by the process scrap and the downstream (or customer) scrap, then you will need to incorporate both numbers into the adjusted production requirement calculation.
To illustrate the impact of scrap on the adjusted production requirements let's look at the example in Figure 3-2. (Don't worry about the equations ”we'll discuss them in detail in Chapter 4.) In this example, to produce 100 parts with a process scrap level of 8 percent and a downstream scrap of 2 percent, we would need to produce 119 parts. This number is slightly larger than the 111 parts we would need to produce if we had calculated the required parts as a combined scrap rate of 10 percent.
|
A plant produces a part in a process with 8% scrap and the downstream scrap for processes that use the part are 2%. To meet a daily production demand of 100 for this part, how many parts would need to be run? |
||
|
Adjusted process demand |
= |
100/(1 “8%) |
|
= |
100/0.92 |
|
|
= |
108.7 or 109 |
|
|
Total adjusted demand |
= |
109/(1 “2%) |
|
= |
109/0.98 |
|
|
= |
118.5 or 119 |
|
|
Total adjusted demand for 10% |
= |
100/(1 “10%) |
|
= |
111.1 |
|
Figure 3-2: Example of Calculating Adjusted Demand Scrap When Measuring Scrap by Process Scrap and Downstream Scrap.
When looking at the scrap levels, check to see if your current schedule quantities already account for system scrap rates. If they do, then no further calculations will be required.
Document Your Findings
Once you have collected the data, compile it into a usable format to make decisions. Figure 3-3 contains a worksheet for recording the process information. You can use this form to record your data.
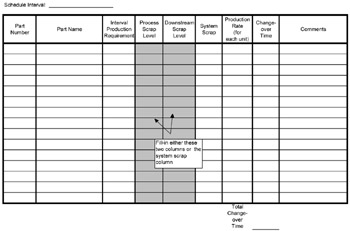
Figure 3-3: Process Information Summary Sheet.
In Chapter 1 we alluded to value stream mapping as a product that would help in the selection of a target process. If your plant has not done value stream mapping, then this might be a golden opportunity to do so after you have collected all the above data. The value stream mapping process asks an organization to assess its current situation in the form of a "Current State" map. The organization then asks itself what it wants to become by developing its "Future State" map. When done properly with real data, the Future State map becomes a powerful roadmap to the future.
For the purposes of this book, we have not used value stream mapping to document the current production process, because value stream mapping asks the organization to look at and utilize all the Lean tools. Kanban is just one of those tools. We will assume that the organization has decided to implement kanban as part of its strategic plan (regardless of how the organization arrived at the plan).
Analyze the Data
Once you have the data consolidated, then it's time to take a look at the data. Analyze the data for:
- Consistency
- Accuracy
- Realism
By consistency , we mean:
- Are the units correct and are the numbers consistent with your expectations?
- Is everything recorded in the same measurement system, i.e., English or metric?
- Are the units mixed?
- Are the entries in the same dimensionse.g., seconds versus minutes?
Nothing slows down the kanban design process like trying to decipher unit problems.
When considering accuracy , consider these items:
- Are these the true scrap numbers, changeover numbers, downtime numbers?
- Have we overinflated the numbers?
- Have we lumped all the parts into the same category by giving them all the same changeover time or scrap rate?
Also, look at the data for realism. Does the data really reflect how we run our process?
Make sure the numbers are consistent, accurate, and real. If you have misstated the numbers, it will become evident in the next phase when you calculate the kanban. You will see the errors when the calculated numbers tell you to increase inventory, or worse , when the errors tell you that you can cut your inventory in half. As the old computer saying goes: garbage in, garbage out!
Two Examples
Let's work through two examples to make sure everyone understands the data collection process and how to use the forms. The first example, shown in Figure 3-4, is a simple two-part number kanban for two plastic injection molded parts . Figure 3-5 shows the summarized data. The second example, shown in Figure 3-6, is a process line that makes ten-part numbers ”some that require changeovers and some that do not. Figure 3-7 shows the summarized data.
Example 1: A plastic injection molding machine makes plastic rings for carnival games . Two different colors are produced ”red (part A) and blue (part B). The machine makes 2 rings at a time with a mold cycle of 30 seconds. The process has a system scrap of 3%. The mold is not changed when switching between colors, but the raw material hopper must be cleaned out between colors. This color change takes 15 minutes.
The plastic molding pellets are delivered daily and the supplier has never missed a delivery. The rings must cool for 15 minutes. They are made to order for 5 different customers.
The company has steady weekly orders of 2,500 red rings and 4,000 blue rings. The company promises next -day delivery of any order.
The company produces the rings 1 shift per day, 5 days per week. The plant has two 10-minute breaks and a 30-minute lunch . Each day the shift has a 10-minute shift starter meeting and 5 minutes/day is allocated for the monthly kaizen meeting, 5s activities, and a safety meeting. The plant does not have a preventive maintenance program so they experience 1 hour of downtime each day for minor breakdowns and adjustments.
”Use this information to fill in the process information summary sheet.
Figure 3-4: Example 1: Two-Part Number Kanban.
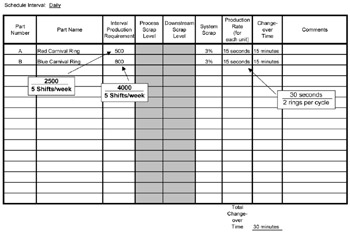
Figure 3-5: Example 1: Process Information Summary Sheet.
Example 2: A plastic extrusion process line extrudes 10 different profiles. Each profile is unique and is assigned a unique part number ”3502 through 3512. The profiles are used in a downstream process where they are mold spliced to create environmental seals for the company's main consumer product ”electronic component carrying cases. The extrusion process experiences 5% scrap and 2% scrap in the mold splicing process. All profiles have a changeover time of 35 minutes. The demand and speeds for each profile is as shown:
Part Number
Component Case Demand
Part Length (in mm)
Production Rate (ft/min)
3502
500
500
50
3503
750
588
50
3504
350
1200
50
3505
250
300
60
3506
500
300
60
3507
500
585
60
3508
1200
690
60
3509
1000
1250
45
3510
900
400
45
3511
100
400
45
The process line averages 95% uptime. The process line is scheduled 5 days per week for 1 shift. All PMs and 5s activities are handled while the operation is running or on overtime.
The plastic molding pellets are delivered daily, but the supplier misses about 15% of their deliveries. The extruded profiles require no further cure time once they are extruded and cooled in the production process.
Figure 3-6: Example 2: Ten-Part Number Kanban.
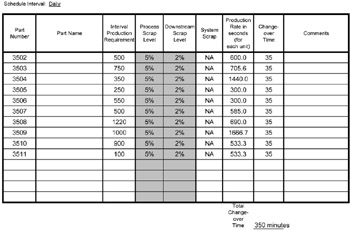
Figure 3-7: Example 2: Process Information Summary Sheet.
Take a close look at Figure 3-7 and perform the recommended analysis. Did you find the incorrect numbers? Did you see flags for follow-up? What about the mixed units? Figure 3-8 highlights the errors and flags in Figure 3-7. Figure 3-9 shows the corrected table. This example shows the necessity to carefully analyze your numbers to make sure you have the correct data to correctly calculate the kanban quantities .
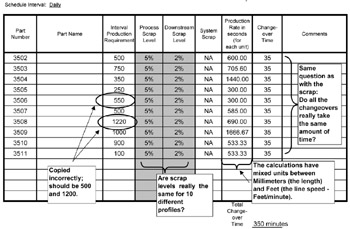
Figure 3-8: Example 2: Errors in the Original Data Collection Form.
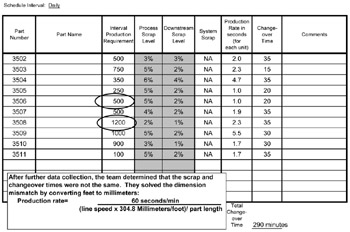
Figure 3-9: Example 2: Corrected Process Information Summary Sheet.
Using the Workbook
For individuals and groups that are using the CD-ROM Workbook , Chapter 3 on data collection contains a blank form for data collection. We have also included the two examples for reference purposes. Use the data collection form to collect the data for your kanban. In a meeting setting, you may want to make an overhead of the blank form and fill it in as you review the data.
Summary
The process of implementing kanban scheduling begins by collecting data on the target process. The data that needs to be collected includes number of parts to be produced by the process, changeover times, downtime, and scrap levels.
Use your team to collect this data. The team should follow the guidelines in the chapter to ensure you get the data needed to calculate the kanban's size .
Once you have collected the data, then use the data collection form to organize the data into a format for analysis. When you have the completed data sheet, then review the data to make sure the units are consistent, correct, and realistic. Look for errors in the data, such as tabulation errors, recording errors, and unit errors. Use the two examples provided at the end of the chapter to help illustrate the data summation and analysis process.
Preface
- Introduction to Kanban
- Forming Your Kanban Team
- Conduct Data Collection
- Size the Kanban
- Developing a Kanban Design
- Training
- Initial Startup and Common Pitfalls
- Auditing the Kanban
- Improving the Kanban
- Conclusion
- Appendix A MRP vs. Kanban
- Appendix B Kanban Supermarkets
- Appendix C Two-Bin Kanban Systems
- Appendix D Organizational Changes Required for Kanban
- Appendix E EOQ vs. Kanban
- Appendix F Implementation in Large Plants
- Appendix G Intra-Cell Kanban
- Appendix H Case Study 1: Motor Plant Casting Kanban
- Appendix I Case Study 2: Rubber Extrusion Plant
- Appendix J Abbreviations and Acronyms
EAN: 2147483647
Pages: 142
- Connecting to a Named Instance of SQL Server or Microsoft Data Engine (MSDE)
- Getting an Identity Column Value from SQL Server
- Avoiding Referential Integrity Problems When Updating the Data Source
- Binding Data to .NET User Interfaces
- Using a Single Stored Procedure to Update Multiple Changes to a SQL Server Database
