Monitoring Network Performance
Problem
Can I use Snort to determine my network performance?
Solution
Snort includes several tools to help determine how your network is performing. Chapter 4 discussed one of these tools: the performance monitor preprocessor, perfmonitor. The perfmonitor preprocessor logs its data in a comma-separated format file in the Snort log directory. The perfmon-graph tool can display this data to a web page, or you can even generate a text-based chart using the perfstats.c script in the Snort contrib directory. For the brave who want to create a rolling graph of protocol use, you can use the flow log preprocessor STDOUT logging mechanism to pull that information out of Snort to a dynamic interface (ESM/SIM anyone?). Fianlly, you can use Snort in binary mode then replay the packets to a file so you can pull all the data you wantsuch as top talkers, protocol use, etc.through the use of custom scripts. The only reason to seek the last option is if the others can't help solve your problem.
Discussion
The perfmonitor preprocessor has been a part of the Snort code since Snort 1.9.0. This preprocessor was originally built to help debug and test Snort, but the developers decided to enable it with the open source code to help the community. This preprocessor has to be enabled at compile time with --enable-perfmonitor added to your configure statement. Chapter 4 gives examples of the full set of configuration options for the preprocessor in the snort.conf file. However, this information is logged to the Snort log directory in a CSV format file. This file can then be pulled over to a central machine for display, such as on a status board for your analysts to look at using perfmon-graph. Using the data from the perfmonitor preprocessor, we get a chart like that shown in Figure 7-1 to be displayed.
Figure 7-1. Example of perfmon-graph tool
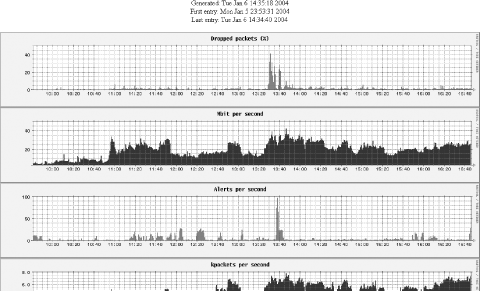
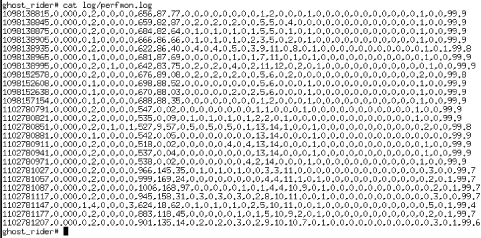
This might be a little more helpful to your security team and management than the information provided in Figure 7-2, which shows how the perfmonitor logs are written.
Figure 7-2. Raw perfmonitor output log example
To use the perfmon-graph tool, you will need at least the Round Robin Database (RRD) Perl libraries installed. The link to the tool can be found in the "See Also" section. RRD was originally built as a replacement for the operational tool MRTG. However, for the perfmon-graph tool, it needs only the Perl modules installed. These modules enable perfmon-graph to use the graphing components of RRD to plot Snort data without needing to install the full tool. As this tool needs to add modules to the Perl libraries on the system, it needs to be installed with user root.
Root# ./configure --   ( none are usually needed )

root# make site-perl-install
This tells RRD to install only the Perl libraries needed to graph data in image type PNG graph format. One example for organizations that have more than one sensor could be to use the machine that displays ACID or some other web frontend as the collection point for these files. Have the perfmonitor logfiles pulled regularly using SCP if you are security conscious or FTP if you are more comfortable with your sensors' connection to this machine. Then create another script to take the raw perfmonitor files, as in Figure 7-2 and use the perfmon-graph tool to create the files in a web directory. The following script could be used to pull all the perfmon.log and session.log files over to a specific directory on a collection machine using SSH trusted keys. This could be used as a secondary collection of evidence in case one or more of your sensors is compromised. This could also be the directory that the perfmon-graph tool pulls data from to generate hourly, daily, or weekly graphs.
# START OF EXAMPLE SCRIPT

#!/bin/sh

#

# Simple script to collect needed information from the sensors

# using a trusted key pair from a non-root account called `scripts'

# that is placed on all of the sensors and collection server.

# This script uses SCP to transfer the files and therefore needs

# a trusted (public/private key pair) to be use from a local account

# on both collection machine and the sensors.

#

# Create a timestamp file to be pulled to determine when this script

# was last run

mytime=`date `

echo "This is the last time the script was run $mytime " > /logs/LASTTIME

#

#

# SENSORS

#

# INTERNAL -

scp
Installing Snort from Source on Unix
- Installing Snort from Source on Unix
- Installing Snort Binaries on Linux
- Installing Snort on Solaris
- Installing Snort on Windows
- Uninstalling Snort from Windows
- Installing Snort on Mac OS X
- Uninstalling Snort from Linux
- Upgrading Snort on Linux
- Monitoring Multiple Network Interfaces
- Invisibly Tapping a Hub
- Invisibly Sniffing Between Two Network Points
- Invisibly Sniffing 100 MB Ethernet
- Sniffing Gigabit Ethernet
- Tapping a Wireless Network
- Positioning Your IDS Sensors
- Capturing and Viewing Packets
- Logging Packets That Snort Captures
- Running Snort to Detect Intrusions
- Reading a Saved Capture File
- Running Snort as a Linux Daemon
- Running Snort as a Windows Service
- Capturing Without Putting the Interface into Promiscuous Mode
- Reloading Snort Settings
- Debugging Snort Rules
- Building a Distributed IDS (Plain Text)
- Building a Distributed IDS (Encrypted)
Logging to a File Quickly
- Logging to a File Quickly
- Logging Only Alerts
- Logging to a CSV File
- Logging to a Specific File
- Logging to Multiple Locations
- Logging in Binary
- Viewing Traffic While Logging
- Logging Application Data
- Logging to the Windows Event Viewer
- Logging Alerts to a Database
- Installing and Configuring MySQL
- Configuring MySQL for Snort
- Using PostgreSQL with Snort and ACID
- Logging in PCAP Format (TCPDump)
- Logging to Email
- Logging to a Pager or Cell Phone
- Optimizing Logging
- Reading Unified Logged Data
- Generating Real-Time Alerts
- Ignoring Some Alerts
- Logging to System Logfiles
- Fast Logging
- Logging to a Unix Socket
- Not Logging
- Prioritizing Alerts
- Capturing Traffic from a Specific TCP Session
- Killing a Specific Session
How to Build Rules
- How to Build Rules
- Keeping the Rules Up to Date
- Basic Rules You Shouldnt Leave Home Without
- Dynamic Rules
- Detecting Binary Content
- Detecting Malware
- Detecting Viruses
- Detecting IM
- Detecting P2P
- Detecting IDS Evasion
- Countermeasures from Rules
- Testing Rules
- Optimizing Rules
- Blocking Attacks in Real Time
- Suppressing Rules
- Thresholding Alerts
- Excluding from Logging
- Carrying Out Statistical Analysis
Detecting Stateless Attacks and Stream Reassembly
- Detecting Stateless Attacks and Stream Reassembly
- Detecting Fragmentation Attacks and Fragment Reassembly with Frag2
- Detecting and Normalizing HTTP Traffic
- Decoding Application Traffic
- Detecting Port Scans and Talkative Hosts
- Getting Performance Metrics
- Experimental Preprocessors
- Writing Your Own Preprocessor
Managing Snort Sensors
- Managing Snort Sensors
- Installing and Configuring IDScenter
- Installing and Configuring SnortCenter
- Installing and Configuring Snortsnarf
- Running Snortsnarf Automatically
- Installing and Configuring ACID
- Securing ACID
- Installing and Configuring Swatch
- Installing and Configuring Barnyard
- Administering Snort with IDS Policy Manager
- Integrating Snort with Webmin
- Administering Snort with HenWen
- Newbies Playing with Snort Using EagleX
Generating Statistical Output from Snort Logs
- Generating Statistical Output from Snort Logs
- Generating Statistical Output from Snort Databases
- Performing Real-Time Data Analysis
- Generating Text-Based Log Analysis
- Creating HTML Log Analysis Output
- Tools for Testing Signatures
- Analyzing and Graphing Logs
- Analyzing Sniffed (Pcap) Traffic
- Writing Output Plug-ins
Monitoring Network Performance
- Monitoring Network Performance
- Logging Application Traffic
- Recognizing HTTP Traffic on Unusual Ports
- Creating a Reactive IDS
- Monitoring a Network Using Policy-Based IDS
- Port Knocking
- Obfuscating IP Addresses
- Passive OS Fingerprinting
- Working with Honeypots and Honeynets
- Performing Forensics Using Snort
- Snort and Investigations
- Snort as Legal Evidence in the U.S.
- Snort as Evidence in the U.K.
- Snort as a Virus Detection Tool
- Staying Legal
Index
EAN: 2147483647
Pages: 167
