Example Problem Solution
| Time Estimates (weeks) | |||
|---|---|---|---|
| Activity | a | m | b |
| 1 | 5 | 8 | 17 |
| 2 | 7 | 10 | 13 |
| 3 | 3 | 5 | 7 |
| 4 | 1 | 3 | 5 |
| 5 | 4 | 6 | 8 |
| 6 | 3 | 3 | 3 |
| 7 | 3 | 4 | 5 |
Solution
| Step 1. | Compute the Expected Activity Times and Variances Using the following formulas, compute the expected time and variance for each activity:
| ||||||||||||||||||||||||
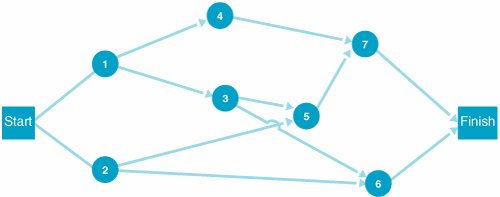
| Step 2. | Determine the Earliest and Latest Times at Each Node The earliest and latest activity times and the activity slack are shown on the following network: 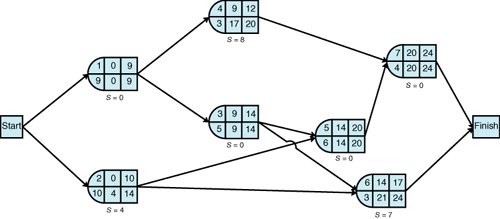 | ||||||||||||||||||||||||
| | |||||||||||||||||||||||||
| Step 3. | Identify the Critical Path and Compute Expected Project Completion Time and Variance After observing the foregoing network and those activities with no slack (i.e., S = 0), we can identify the critical path as 1  3 5 7. The expected project completion time ( t P ) is 24 days. The variance is computed by summing the variances for the activities in the critical path: 3 5 7. The expected project completion time ( t P ) is 24 days. The variance is computed by summing the variances for the activities in the critical path: | ||||||||||||||||||||||||
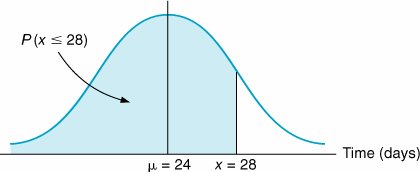
| Step 4. | Determine the Probability That the Project Will Be Completed in 28 Days or Less The following normal probability distribution describes the probability analysis: P ( x  28) = .9633 28) = .9633 |


Introduction to Management Science (10th Edition)
ISBN: 0136064361
EAN: 2147483647
EAN: 2147483647
Year: 2006
Pages: 358
Pages: 358
Authors: Bernard W. Taylor