Formatting Report Sections
The earlier chapters introduced the concept of report sections such as the detail section and the group header and footer sections. Report sections segment reports into logical areas to facilitate logical report design. Report sections are identified by name on the left side of the design environment, and, by default, each report includes a Report Header and Footer, Page Header and Footer, and Details section. If you have inserted any groups into your report, you also have a Group Header and Footer for each defined group item. As reports have been created in the previous chapters, objects such as database fields, text fields, and corporate logo images have been placed into the various report sections and organized based on the report design requirements.
Each section has unique display properties and printing characteristics that can be modified. For example, if a report object, such as an image, is placed in the Report Header section, the image displays and prints only once per report, on the first page. If the same image is placed in the Page Header section, the image then displays and prints once for every single page of the report. The same principals hold true for other custom sections, such as Group Headers and Footers. Finally, the Detail section implies that whatever is placed in this section displays, and prints, once for each and every row retrieved from the data source.
NOTE
The Crystal Reports design environment is built on a paper metaphor with pages the driving concept in structuring the presentation of report information. This page metaphor applies when referencing report printing and with respect to various presentation characteristics of report formatting.
Using the report created in Chapter 6, take a closer look at how to format report sections. The following exercises demonstrate how to format sections such as the Group Header and Group Footer to improve the overall presentation of a Crystal Report. In addition to modifying display properties, conditional logic is also applied that modifies the behavior of the Page Header section based on the result of the defined condition (format formula). The Section Expert is the central location for working with all report section properties, and it is used to view and modify the properties of each report section throughout the following exercises.
NOTE
As you might have noticed, long names (descriptive names) of each section are provided to the left of the design environment within the Design tab, whereas only the short names (abbreviated names) of sections are presented while viewing reports from the Preview tab. This maximizes the report viewing space while working in the Preview tab. The long names can, however, be accessed by either hovering the mouse cursor over the section or by right-clicking on the section name (or label).
There are three distinct ways to access the Section Expert; these include
- Right-clicking on the name of the section you want to work with and selecting Section Expert from the pop-up menu.
- Clicking on the Section Expert toolbar button located on the Expert Tools toolbar.
- Selecting the Format menu and choosing Report, Section Expert.
To start the hands-on learning, follow these steps:
- Open the report you created in Chapter 6. Alternatively, open the report entitled Ch07start.rpt (available by searching for the book's ISBN0-7897-3113-4 at Que Publishing's Web site, www.quepublishing.com).
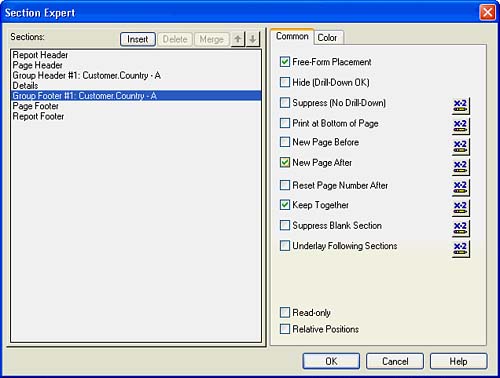
- Open the Section Expert. From either the Design or Preview mode, right-click on the Group Header #1 section and select Section Expert from the pop-up menu. This presents the Section Expert dialog displayed in Figure 7.4.
Figure 7.4. The Section Expert provides access to a variety of section formatting properties, as well as enabling the specification of what happens before and after each section is printed.
Now apply a background color to your Group Header #1 report section so that the report consumers can quickly distinguish between country sections and determine which customer contacts belong to each country.
- In the Section Expert, select the Group Header #1 item from the Sections list on the left, and then click on the Color tab on the right. Click on the Background Color box so that it is activated and select Navy from the drop-down list of color options. Click OK to continue.
TIP
From within the Section Expert, you can easily navigate from modifying the properties of one report section to another without closing this dialog window. Regardless of how you open the Section Expert dialog window, you can quickly toggle to other report sections, providing a central location to access and modify the properties of all report sections.
- Select the Preview tab to view your report display.
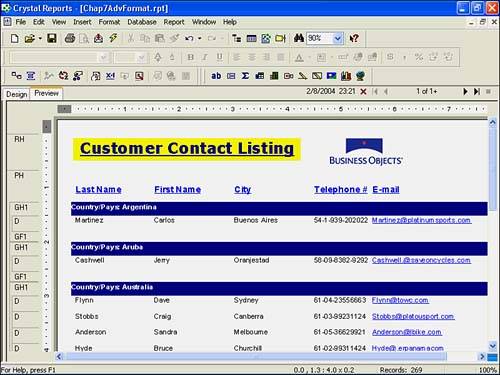
- The Red font used for the object in the Group Header #1 does not look good against the Navy background color. To resolve this, highlight the text objectactually a combined object consisting of a text object and a database field objectand change its font color to White, as shown in Figure 7.1.
Figure 7.1. Formatting a report section can make reports more readable and friendly to end users.
- To complement the current report grouping on the Country field, add a summary count of the contacts for each country in the Group Footer #1 section. To do this, select Summary from the Insert menu to present the Insert Summary dialog and select the following items:
- Customer.Contact Last Name field from the Choose the Field to Summarize drop-down list
- Count from the Calculate This Summary drop-down list
- Group #1: Customer.Country from the Summary Location drop-down list
NOTE
To access the Insert Summary dialog so that you can add a summary field to your report, you can use the Summary command from the main Insert menu, you can use the Insert Summary button located on the Insert toolbar, or you can simply right-click on any report field already in the report and access the Insert Summary menu option from the right-click menu. This last option prepopulates the Choose the Field to Summarize drop-down box and saves you a few needless steps.
- After you have made these selections from the Insert Summary dialog, click OK to continue.
- You should now see the Count Summary field listed in the Group Footer #1 section of your report. To align the field values to the left and make them noticeable, use the Align Left and Font buttons located on the Formatting toolbar to apply the desired alignment and a Red font color.
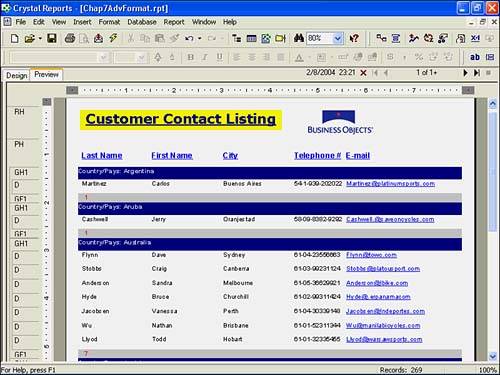
- Now add additional report section formatting to the Group Footer #1 section. From the Report menu, select the Section Expert command to present the Section Expert dialog. From the Sections list on the left, select Group Footer #1 and then select the Color tab on the right. Specify a Silver background color for this section and click OK to return to the report preview, shown in Figure 7.2.
Figure 7.2. Section formatting can be applied specifically to the various sections of your report for a more meaningful report presentation.
- As a final step, change the font color of the database field column titles. From either the Design or Preview view, right-click on the Page Header section title and choose Select All Section Objects from the pop-up menu. After all the column title objects are highlighted, select Teal from the formatting toolbar Font Color button.
As you have seen, formatting the various sections of your report is very straightforward. Each section has unique and specific properties that can be modified and used collectively to enhance the presentation quality of the entire report.
TIP
To quickly remove blank space within report sections and tighten up the alignment of the objects positioned within the sections, you can use the Fit Section command. The Fit Section command is available from the right-click menu of each report section. This raises the bottom boundary line and reduces unnecessary space within the section.
Part I. Crystal Reports Design
Creating and Designing Basic Reports
- Creating and Designing Basic Reports
- Introducing the Crystal Reports Designer
- Understanding Data and Data Sources
- Introduction to the Data Explorer
- Adding Database Objects to Your Report
- Joining Database Objects Together
- Understanding the Different Join Types
- Using the Report Creation Wizards
- Understanding the Crystal Reports Gallery
- Using the Standard Report Creation Wizard
- Creating a Report Without Wizards
- Troubleshooting
Selecting and Grouping Data
- Selecting and Grouping Data
- Introduction
- Understanding Field Objects
- Working with Groups
- Understanding Drill-down Reports
- Troubleshooting
Filtering, Sorting, and Summarizing Data
- Filtering, Sorting, and Summarizing Data
- Introduction
- Filtering the Data in Your Report
- Learning to Sort Records
- Working with the Sort Expert
- Creating Effective Summaries
- Troubleshooting
Understanding and Implementing Formulas
- Understanding and Implementing Formulas
- Introduction
- Using the Formula Workshop
- Using the Workshop Formula Editor
- Creating Formulas with the Formula Expert
- Using the Formula Extractor to Create Custom Functions
- The Multi-Pass Reporting Process of the Crystal Reports Engine
- Troubleshooting
Implementing Parameters for Dynamic Reporting
- Implementing Parameters for Dynamic Reporting
- Introduction
- Understanding the Value of Parameters
- Creating and Implementing Parameters Fields
- Using Parameters with Record Selections
Part II. Formatting Crystal Reports
Fundamentals of Report Formatting
- Fundamentals of Report Formatting
- Introduction
- Positioning and Sizing Report Objects
- Modifying Object Properties for Formatting Purposes
- Exploring the Format Editor Dialog Common Options
- Combining and Layering Report Objects
- Configuring Report Page and Margin Properties
Working with Report Sections
- Working with Report Sections
- Introduction
- Formatting Report Sections
- Modifying Report Section Properties
- Using Multiple Report Sections
- Troubleshooting
Visualizing Your Data with Charts and Maps
- Visualizing Your Data with Charts and Maps
- Introduction to Charts and Maps
- Using the Chart Expert
- Using the Map Expert
- Modifying Chart and Map Properties
- Troubleshooting
Custom Formatting Techniques
- Introduction
- Making Presentation-Quality Reports
- Common Formatting Features
- Conditional Formatting Using Data to Drive the Look of a Report
Part III. Advanced Crystal Reports Design
Using Cross-Tabs for Summarized Reporting
- Using Cross-Tabs for Summarized Reporting
- Introduction to Cross-Tabs
- Benefits of Cross-Tabs
- Using the Cross-Tab Wizard
- Using Top N with Cross-Tabs Reports
- Using Advanced Cross-Tab Features
Using Record Selections and Alerts for Interactive Reporting
- Using Record Selections and Alerts for Interactive Reporting
- Creating Advanced Record Selection Formulas
- Adding Alerting to Your Reports
- Performance Monitoring and Tuning
Using Subreports and Multi-Pass Reporting
- Using Subreports and Multi-Pass Reporting
- Understanding Subreports
- Understanding Linked Versus Unlinked Subreports
- Considering Subreport Execution Time and Performance
- Using Variables to Pass Data Between Reports
- Emulating Nested Subreports
- Troubleshooting
Using Formulas and Custom Functions
- Using Formulas and Custom Functions
- Becoming More Productive with Formulas
- Choosing a Formula Language: Crystal Versus Basic Syntax
- Using Brackets in Formulas
- Using Characters in Formulas
- Recent Improvements to Formulas
Designing Effective Report Templates
- Designing Effective Report Templates
- Understanding the Importance of Reuse in Reporting
- Understanding Report Templates
- Using Report Templates
- Using Existing Crystal Reports as Templates
- Understanding How Templates Work
- Creating Useful Report Templates
- Using Template Field Objects
- Using Report Templates to Reduce Report Creation Effort
- Applying Multiple Templates
Additional Data Sources for Crystal Reports
- Additional Data Sources for Crystal Reports
- Understanding the Additional Crystal Reports Data Sources
- Connecting to COM-based Data Sources
- Connecting to Java-based Data Sources
- Understanding Solution Kits for Crystal Enterprise
- Troubleshooting
Multidimensional Reporting Against OLAP Data with Crystal Reports
- Multidimensional Reporting Against OLAP Data with Crystal Reports
- Introduction to OLAP
- OLAP Concepts and OLAP Reporting
- Recently Added or Changed OLAP Features in Crystal Reports
- Using the OLAP Report Creation Wizard and OLAP Expert
- Advanced OLAP Reporting
- Introduction to Crystal Analysis
Part IV. Enterprise Report Design Analytic, Web-based, and Excel Report Design
Introduction to Crystal Repository
- Introduction to Crystal Repository
- What Is the Crystal Repository?
- Why Implement the Crystal Repository?
- Installing the Crystal Repository
- Adding Objects to and from the Repository
- Migration of the Crystal Enterprise Repository
- Troubleshooting
Crystal Reports Semantic Layer Business Views
- Crystal Reports Semantic Layer Business Views
- Introduction to Business Views
- Why Implement Business Views?
- Performance and Implementation Considerations
- Business Views Architecture and Implementation
- Troubleshooting
Creating Crystal Analysis Reports
- Creating Crystal Analysis Reports
- Introduction
- Introducing Crystal Analysis
- Accessing OLAP Data with Crystal Analysis
- Designing Crystal Analysis Reports and Applications
- Adding Crystal Analysis Objects to a Report
- Troubleshooting
Advanced Crystal Analysis Report Design
- Advanced Crystal Analysis Report Design
- Introduction
- Advanced Crystal Analysis Designer Tools
- Custom Calculations and Advanced Data Analysis
- Setting Report Options
- Troubleshooting
- Crystal Analysis in the Real World MDX
Ad-Hoc Application and Excel Plug-in for Ad-Hoc and Analytic Reporting
- Ad-Hoc Application and Excel Plug-in for Ad-Hoc and Analytic Reporting
- Introducing Ad-Hoc Reporting Conceptually
- Introducing the Crystal Enterprise Ad-Hoc Reporting Application
- Crystal Reports Excel Plug-in
- Crystal Analysis Excel Plug-in
Part V. Web Report Distribution Using Crystal Enterprise
Introduction to Crystal Enterprise
- Introduction to Crystal Enterprise
- What Is Crystal Enterprise?
- Why Implement a Crystal Enterprise Solution?
- Versions of Crystal Enterprise
- Understanding the Core Functions of Crystal Enterprise
Using Crystal Enterprise with Web Desktop
- Using Crystal Enterprise with Web Desktop
- Introduction
- Crystal Enterprise User Launchpad
- Crystal Enterprise Web Desktop
- Customizing the Web Desktop and Report Viewers
- Publishing to the Web Desktop
- Customizing the Web Desktop
- Troubleshooting
Crystal Enterprise Architecture
- Crystal Enterprise Architecture
- Introduction
- Crystal Enterprise Architecture Overview
- The Client Tier
- The Application Tier
- The Server Tier: Introduction to the Crystal Enterprise Framework
- The Server Tier: Overview of the Crystal Enterprise Services
- The Data Tier
- The Crystal Enterprise Architecture in Action
- Taking Advantage of the Crystal Enterprise Distributed Architecture
- Extending Crystal Enterprise
Planning Considerations When Deploying Crystal Enterprise
- Planning Considerations When Deploying Crystal Enterprise
- Ensuring a Successful Crystal Enterprise Implementation
- Approaching the Project
- Identifying Business Pain
- Establishing Project Requirements
- Understanding Organizational Reporting Requirements
- Troubleshooting
Deploying Crystal Enterprise in a Complex Network Environment
- Deploying Crystal Enterprise in a Complex Network Environment
- Introduction
- Understanding Network Protocols
- Understanding Firewall Types
- Configuring the Crystal Enterprise Architecture for Your Network Environment
- Interaction Between the WCS and the WC
- Deploying Crystal Enterprise with an IP Packet Filtering Firewall
- Using Crystal Enterprise with NAT
- Exploring the NAT and Crystal Enterprise Relationship
- Crystal Enterprise and Proxy Servers
Administering and Configuring Crystal Enterprise
- Introduction
- Using the Crystal Management Console
- Managing Accounts
- Managing Content
- Introducing Servers
- Managing Crystal Enterprise System Settings
- Using the Crystal Configuration Manager
Part VI. Customized Report Distribution Using Crystal Reports Components
Java Reporting Components
- Java Reporting Components
- Overview of the Crystal Reports Java Reporting Component
- Understanding the Java Reporting Components Architecture
- Differences with the Java Reporting Engine
- Configuring the Application Server
- Delivering Reports in Web Applications
- Using the Crystal Tag Libraries
- Exporting Reports to Other File Formats
- Printing Reports from the Browser
- Common Programming Tasks
- Troubleshooting
Crystal Reports .NET Components
- Crystal Reports .NET Components
- Understanding Microsofts .NET Platform
- Understanding the Different Crystal .NET Components
- An Overview of the Crystal Reports 10 .NET Components
- The Report Designer
- The Report Engine Object Model
- Delivering Reports with the Windows Forms Viewer
- Delivering Reports with the Web Forms Viewer
- Database Credentials
- Setting Parameters
- Troubleshooting
COM Reporting Components
- COM Reporting Components
- Understanding the Report Designer Component
- Building Reports with the Visual Basic Report Designer
- Programming with the Report Engine Object Model
- Delivering Reports Using the Report Viewer
- Troubleshooting
Part VII. Customized Report Distribution Using Crystal Enterprise Embedded Edition
Introduction to Crystal Enterprise Embedded Edition
- Introduction to Crystal Enterprise Embedded Edition
- Introduction to Crystal Enterprise Embedded Edition
- Understanding Crystal Enterprise Embedded Edition
- Crystal Enterprise Embedded Edition Samples
- DHTML Report Design Wizard
- Troubleshooting
Crystal Enterprise Viewing Reports
- Crystal Enterprise Viewing Reports
- Viewing Reports over the Web
- Introduction to the Crystal Report Viewers
- Understanding the Report Source
- Implementing the Page Viewer
- Implementing the Part Viewer
- Implementing the Interactive Viewer
- Implementing the Grid Viewer
- Troubleshooting
Crystal Enterprise Embedded Report Modification and Creation
- Introduction
- Deploying RAS Environments
- Loading Report Files
- Locating RAS Components in a Network Architecture
- Installing the RAS SDK
- Best Practices in RAS Exception Handling
- The RAS SDK in Action
Part VIII. Customized Report Distribution Using Crystal Enterprise Professional
Introduction to the Crystal Enterprise Professional Object Model
- Introduction to the Crystal Enterprise Professional Object Model
- Understanding the Crystal Enterprise Object Model
- Establishing a Crystal Enterprise Session
- Querying the Crystal Enterprise Repository
- Viewing Reports
- The Crystal Enterprise Java SDK
- Accessing the Java SDK
- Troubleshooting
Creating Enterprise Reports Applications with Crystal Enterprise Part I
- Creating Enterprise Reports Applications with Crystal Enterprise Part I
- Advanced Scenarios with the Crystal Enterprise Object Model
- Scheduling Reports
- Scheduling to a Destination
- Using Crystal Enterprise Notifications
- Scheduling to a Server Group
- Scheduling to a Specific Format
- Setting Database Credentials
- Troubleshooting
Creating Enterprise Reporting Applications with Crystal Enterprise Part II
- Creating Enterprise Reporting Applications with Crystal Enterprise Part II
- Querying the Crystal Enterprise InfoStore
- Creating and Responding to Crystal Enterprise Alerts
- Creating Schedulable Program Objects
- Troubleshooting
Appendix A. Using Sql Queries In Crystal Reports
Creating Enterprise Reporting Applications with Crystal Enterprise Part II
EAN: 2147483647
Pages: 341
