Process Internals
This section describes the key Windows 2000 process data structures. Also listed are key kernel variables, performance counters, and functions and tools that relate to processes.
Data Structures
Each Windows 2000 process is represented by an executive process (EPROCESS) block. Besides containing many attributes relating to a process, an EPROCESS block contains and points to a number of other related data structures. For example, each process has one or more threads represented by executive thread (ETHREAD) blocks. (Thread data structures are explained in the section "Thread Internals" later in this chapter.) The EPROCESS block and its related data structures exist in system space, with the exception of the process environment block (PEB), which exists in the process address space (because it contains information that is modified by user-mode code).
In addition to the EPROCESS block, the Win32 subsystem process (Csrss) maintains a parallel structure for each Windows 2000 process that executes a Win32 program. Also, the kernel-mode part of the Win32 subsystem (Win32k.sys) has a per-process data structure that is created the first time a thread calls a Win32 USER or GDI function that is implemented in kernel mode.
Figure 6-1 is a simplified diagram of the process and thread data structures. Each data structure shown in the figure is described in detail in this chapter.

Figure 6-1 Data structures associated with processes and threads
First let's focus on the process block. (We'll get to the thread block in the section "Thread Internals" later in the chapter.) Figure 6-2 shows the key fields in an EPROCESS block.

Figure 6-2 Structure of an executive process block
EXPERIMENT
Displaying the Format of an EPROCESS BlockFor a list of most of the fields that make up an EPROCESS block and their offsets in hexadecimal, type !processfields in the kernel debugger. (See Chapter 1 for more information on the kernel debugger.) The output looks like this:
The !processfields command shows the format of a process block, not its contents. (The !process command actually dumps the contents of a process block. An annotated example of the output from this command is included later in this section.) Although some of the field names are self-explanatory, the output doesn't give the data type of the fields, nor does it show the format of the structures that are included within or pointed to by the EPROCESS block, such as the kernel process block (Pcb), quota block (QuotaBlock), and so on. By examining the offsets, however, you can at least tell the length of a field. (Hint: Fields that are 4 bytes long and refer to some other structure are likely pointers.)
You can also use the !strct command (in the secondary kernel debugger extension library Kdex2x86.dll) to display the format of a process block. This command displays every field and its data type (whereas the !processfields command displays only some of the fields and doesn't display data type information). A portion of the output follows:
Table 6-1 explains some of the fields in the preceding experiment in more detail and includes references to other places in the book where you can find more information about them. As we've said before and will no doubt say again, processes and threads are such an integral part of Windows 2000 that it's impossible to talk about them without referring to many other parts of the system. To keep the length of this chapter manageable, however, we've covered those related subjects (such as memory management, security, objects, and handles) elsewhere.
Table 6-1 Contents of the EPROCESS Block
| Element | Purpose | Additional Reference |
|---|---|---|
| Kernel process (KPROCESS) block | Common dispatcher object header, pointer to the process page directory, list of kernel thread (KTHREAD) blocks belonging to the process, default base priority, quantum, affinity mask, and total kernel and user time for the threads in the process. | Thread scheduling |
| Process identification | Unique process ID, creating process ID, name of image being run, window station process is running on. | |
| Quota block | Limits on nonpaged pool, paged pool, and page file usage plus current and peak process nonpaged and paged pool usage. (Note: Several processes can share this structure: all the system processes point to the single systemwide default quota block; all the processes in the interactive session share a single quota block Winlogon sets up. | |
| Virtual address descriptors (VADs) | Series of data structures that describes the status of the portions of the address space that exist in the process. | Memory management (Chapter 7) |
| Working set information | Pointer to working set list (MMWSL structure); current, peak, minimum, and maximum working set size; last trim time; page fault count; memory priority; outswap flags; page fault history. | Memory management (Chapter 7) |
| Virtual memory information | Current and peak virtual size, page file usage, hardware page table entry for process page directory. | Memory management (Chapter 7) |
| Exception local procedure call (LPC) port | Interprocess communication channel to which the process manager sends a message when one of the process's threads causes an exception. | Local procedure calls (Chapter 3) |
| Debugging LPC port | Interprocess communication channel to which the process manager sends a message when one of the process's threads causes a debug event. | Local procedure calls (Chapter 3) |
| Access token (ACCESS_TOKEN) | Executive object describing the security profile of this process. | Security (Chapter 8) |
| Handle table | Address of per-process handle table. | Object handles (Chapter 3) |
| Device map | Address of object directory to resolve device name references in (supports multiple users). | Object manager (Chapter 3) |
| Process environment block (PEB) | Image information (base address, version numbers, module list), process heap information, and thread-local storage utilization. (Note: The pointers to the process heaps start at the first byte after the PEB.) | |
| Win32 subsystem process block (W32PROCESS) | Process details needed by the kernel-mode component of the Win32 subsystem. |
The kernel process (KPROCESS) block, which is part of the EPROCESS block, and the process environment block (PEB), which is pointed to by the EPROCESS block, contain additional details about the process object. The KPROCESS block (which is sometimes called the PCB, or process control block) is illustrated in Figure 6-3. It contains the basic information that the Windows 2000 kernel needs to schedule threads. (Page directories are covered in Chapter 7, and kernel thread blocks are described in more detail later in this chapter.)

Figure 6-3 Structure of the kernel process block
The PEB, which lives in the user process address space, contains information needed by the image loader, the heap manager, and other Win32 system DLLs that need to be writable from user mode. (The EPROCESS and KPROCESS blocks are accessible only from kernel mode.) The PEB is always mapped at address 0x7FFDF000. The basic structure of the PEB is illustrated in Figure 6-4 and is explained in more detail later in this chapter.

Figure 6-4 Fields of the process environment block
EXPERIMENT
Examining the PEBYou can dump the PEB structure with the !peb command in the kernel debugger. The following example, which uses LiveKd, shows the PEB for the LiveKd process:
Kernel Variables
A few of the key kernel global variables that relate to processes are listed in Table 6-2. These variables are referred to later in the chapter, when the steps in creating a process are described.
Table 6-2 Process-Related Kernel Variables
| Variable | Type | Description |
|---|---|---|
| PsActiveProcessHead | Queue header | List head of process blocks |
| PsIdleProcess | EPROCESS | Idle process block |
| PsInitialSystemProcess | Pointer to EPROCESS | Pointer to the process block of the initial system process (process ID 2) that contains the system threads |
| PspCreateProcessNotifyRoutine | Array of pointers | Array of pointers to routines to be called on process creation and deletion (maximum of eight) |
| PspCreateProcessNotifyRoutineCount | DWORD | Count of registered process notification routines |
| PspLoadImageNotifyRoutine | Array of pointers | Array of pointers to routines to be called on image load |
| PspLoadImageNotifyRoutineCount | DWORD | Count of registered image-load notification routines |
| PspCidTable | Pointer to HANDLE_TABLE | Handle table for process and thread client IDs |
Performance Counters
Windows 2000 maintains a number of counters with which you can track the processes running on your system; you can retrieve these counters programmatically or view them with the Performance tool. Table 6-3 lists the performance counters relevant to processes (except for memory management and I/O-related counters, which are described in chapters 7 and 9, respectively).
Table 6-3 Process-Related Performance Counters
| Object: Counter | Function |
|---|---|
| Process: % Privileged Time | Describes the percentage of time that the threads in the process have run in kernel mode during a specified interval. |
| Process: % Processor Time | Describes the percentage of CPU time that the threads in the process have used during a specified interval. This count is the sum of % Privileged Time and % User Time. |
| Process: % User Time | Describes the percentage of time that the threads in the process have run in user mode during a specified interval. |
| Process: Elapsed Time | Describes the total elapsed time in seconds since this process was created. |
| Process: ID Process | Returns the process ID. This ID applies only while the process exists because process IDs are reused. |
| Process: Creating Process ID | Returns the process ID of the creating process. This value isn't updated if the creating process exits. |
| Process: Thread Count | Returns the number of threads in the process. |
| Process: Handle Count | Returns the number of handles open in the process. |
Relevant Functions
For reference purposes, some of the Win32 functions that apply to processes are described in Table 6-4. For further information, consult the Win32 API documentation in the MSDN Library.
Table 6-4 Process-Related Functions
| Function | Description |
|---|---|
| CreateProcess | Creates a new process and thread using the caller's security identification |
| CreateProcessAsUser | Creates a new process and thread with the specified alternate security token |
| CreateProcessWithLogonW | Creates a new process and thread with the specified alternate security token, allowing the user profile to be loaded |
| OpenProcess | Returns a handle to the specified process object |
| ExitProcess | Ends a process and notifies all attached DLLs |
| TerminateProcess | Ends a process without notifying the DLLs |
| FlushInstructionCache | Empties the specified process's instruction cache |
| GetProcessTimes | Obtains a process's timing information, describing how much time the process has spent in user and kernel mode |
| GetExitCodeProcess | Returns the exit code for a process, indicating how and why the process shut down |
| GetCommandLine | Returns a pointer to the command-line string passed to the current process |
| GetCurrentProcessId | Returns the ID of the current process |
| GetProcessVersion | Returns the major and minor versions of the Windows version on which the specified process expects to run |
| GetStartupInfo | Returns the contents of the STARTUPINFO structure specified during CreateProcess |
| GetEnvironmentStrings | Returns the address of the environment block |
| GetEnvironmentVariable | Returns a specific environment variable |
| Get/SetProcessShutdownParameters | Defines the shutdown priority and number of retries for the current process |
| GetGuiResources | Returns a count of User and GDI handles |
Relevant Tools
A number of tools for viewing (and modifying) processes and process information are available. These tools are included within Windows 2000 itself and within the Windows 2000 Support Tools, Windows 2000 debugging tools, Windows 2000 resource kits, the Platform SDK, and the DDK. The trouble is, you can't get all the information you need with one single tool. However, most information is available from more than one tool, but the data is sometimes identified by different names (and sometimes assigned different values) in each of the tools. To help you determine which tool to use to get the basic process information you need, consult Table 6-5. This table isn't a comprehensive list of all the information available about a process—for example, you'll find out what tools you can use to gather memory management information in Chapter 7—but if you need the basics, you'll find them here.
Table 6-5 Process-Related Tools

The following experiments illustrate the various views of process information you can obtain with some of these tools.
EXPERIMENT
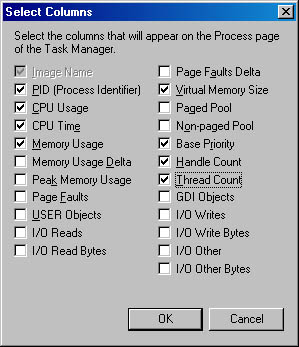
Viewing Process Information with Task ManagerThe built-in Windows 2000 Task Manager provides a quick list of the processes running on the system. You can start Task Manager in one of three ways: (1) press Ctrl+Shift+Esc, (2) right-click on the taskbar and select Task Manager, or (3) press Ctrl+Alt+Delete and click the Task Manager button. Once Task Manager has started, click the Processes tab to see the list of running processes. Notice that processes are identified by the name of the image of which they are an instance. Unlike some objects in Windows 2000, processes can't be given global names. To display additional details, choose Select Columns from the View menu and select additional columns to be added, as shown here:

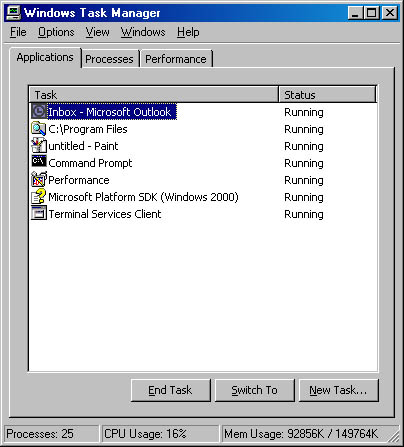
Although what you see in the Task Manager Processes tab is clearly a list of processes, what the Applications tab displays isn't as obvious. The Applications tab lists the top-level visible windows on all the desktops in the interactive window station. (By default, there are two desktop objects—you can create more by using the Win32 CreateDesktop function.) The Status column indicates whether or not the thread that owns the window is in a Windows message wait state. "Running" means the thread is waiting for windowing input; "Not Responding" means the thread isn't waiting for windowing input (for example, the thread might be running or waiting for I/O or some Win32 synchronization object).

From the Applications tab, you can match a task to the process that owns the thread that owns the task window by right-clicking on the task name and choosing Go To Process.
EXPERIMENT
Viewing the Process TreeOne unique attribute about a process that most tools don't display is the parent or creator process ID. You can retrieve this value with the Performance tool (or programmatically) by querying the Creating Process ID. The Windows 2000 Support Tools command tlist /t uses the information in the attribute to display a process tree that shows the relationship of a process to its parent. Here's an example of output from tlist /t:
Tlist indents each process to show its parent/child relationship. Processes whose parents aren't alive are left-justified, because even if a grandparent process exists, there's no way to find that relationship. Windows 2000 maintains only the creator process ID, not a link back to the creator of the creator, and so forth.
To demonstrate the fact that Windows 2000 doesn't keep track of more than just the parent process ID, follow these steps:
- Open a Command Prompt window.
- Type start cmd (which runs a second Command Prompt).
- Bring up Task Manager.
- Switch to the second Command Prompt.
- Type mspaint (which runs Microsoft Paint).
- Click the intermediate (second) Command Prompt window.
- Type exit. (Notice that Paint remains.)
- Switch to Task Manager.
- Click the Applications tab.
- Right-click on the Command Prompt task, and select Go To Process.
- Click on the Cmd.exe process highlighted in gray.
- Right-click on this process, and select End Process Tree.
- Click Yes in the Task Manager Warning message box.
The first Command Prompt window will disappear, but you should still see the Paintbrush window because it was the grandchild of the Command Prompt process you terminated; and because the intermediate process (the parent of Paintbrush) was terminated, there was no link between the parent and the grandchild.
EXPERIMENT
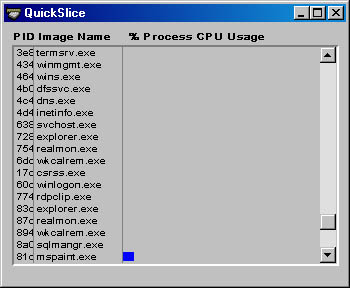
Viewing Thread Activity with QuickSliceQuickSlice gives a quick, dynamic view of the proportions of system and kernel time that each process currently running on your system is using. On line, the red part of the bar shows the amount of CPU time spent in kernel mode, and the blue part shows the user-mode time. (Although reproduced in the window below in black and white, the bars in the online display are always red and blue.) The total of all bars shown in the QuickSlice window should add up to 100 percent of CPU time. To run QuickSlice, click the Start button, choose Run, and enter Qslice.exe (assuming the Windows 2000 resource kit is in your path). For example, try running a graphics-intensive application such as Paint (Mspaint.exe). Open QuickSlice and Paint side by side, and draw squiggles in the Paint window. When you do so, you'll see Mspaint.exe running in the QuickSlice window, as shown here:

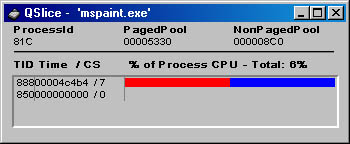
For additional information about the threads in a process, you can also double-click on a process (on either the process name or the colored bar). Here you can see the threads within the process and the relative CPU time each thread uses (not across the system):

EXPERIMENT
Viewing Process Details with Process ViewerThe Process Viewer (Pviewer.exe) that comes with the Windows 2000 Support Tools permits you to view information about the running processes and threads as well as to kill processes and change process priority classes. You can use this tool to view processes both on the local computer and across the network on remote machines running Windows 2000. This tool is also available in the Platform SDK (where it's called Pview.exe.) The Process Viewer is well documented in the Windows 2000 Support Tools help file, but here's a quick overview of the options available to you. The basic display of the Process Viewer looks like this:

Here's what the various options do:
- The Computer text box displays the name of the computer whose processes are currently displayed. Click the Connect button to browse for another computer.
- The Memory Detail button shows memory management details about the selected process, such as the amount of memory committed to the process, the size of the working set, and so forth.
- The Kill Process button kills the selected process. Be very careful which process you kill, since the process will have no chance to perform any cleanup.
- The Refresh button refreshes the display—the Process Viewer doesn't update the information unless you request it.
- The Processor Time columns in the Process and Thread(s) list boxes show the total processor time the process or thread has used since it was created.
- The Priority collection of radio buttons regulates the selected process's priority class (the Real-time priority class isn't shown), and the Thread Priority collection displays the relative thread priorities of the threads within a process.
- At the bottom of the window, the number of context switches and the thread's dynamic priority, start address, and current PC are displayed.
To see the other displays of process and thread information, try running Tlist.exe (Support Tools), Pstat.exe (Platform SDK or www.reskit.com), Pmon.exe (Support Tools), or Pulist.exe (resource kit).
EXPERIMENT
Using the Kernel Debugger !process CommandThe !process command for the kernel debugger (described in Chapter 1) displays a subset of the information in an EPROCESS block. This output is arranged in two parts for each process. First you see the information about the process, as shown below. (Not all the fields in the output are labeled—only the parts germane to this experiment.)

After the basic process output comes a list of the threads in the process. That output is explained in the experiment "Using the Kernel Debugger !thread Command.." Other commands that display process information include !handle, which dumps the process handle table (described in more detail in the section "Object Handles and the Process Handle Table" in Chapter 3). Process and thread security structures are described in Chapter 8.
Another command that dumps an EPROCESS block is the !strct command. See the experiment "Displaying the Format of an EPROCESS Block" for more information on this command.
EAN: 2147483647
Pages: 121
- Structures, Processes and Relational Mechanisms for IT Governance
- Linking the IT Balanced Scorecard to the Business Objectives at a Major Canadian Financial Group
- Measuring ROI in E-Commerce Applications: Analysis to Action
- Technical Issues Related to IT Governance Tactics: Product Metrics, Measurements and Process Control
- Governing Information Technology Through COBIT