Diagnostic Commands and Tools
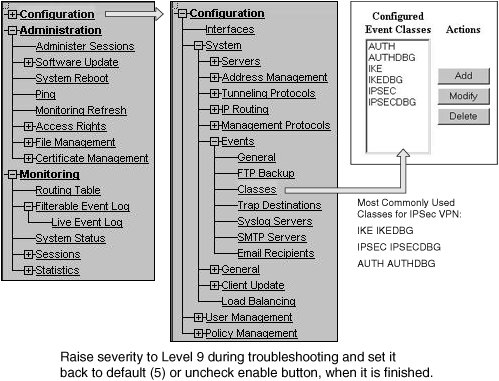
| Troubleshooting IPsec VPN on the VPN 3000 Concentrator is very handy due to its useful debug and monitoring tools. This section discusses both of these tools in greater detail, and this discussion forms the foundation for the rest of the chapter. Debug ToolEvent log is the debug tool in the VPN 3000 Concentrator, which is used to capture and view relevant debug messages for IPsec tunnel. Various event classes correspond to Internet Key Exchange (IKE), IPsec negotiation events, extended user authentication (x-auth) and Mode configuration (mode-config) information for VPN tunnel. If you are not yet sure what to look for, you can set all events classes to a specific severity level by going to Configuration > System > Events > General, which is good for a general view of the problem. Use syslog for bulk logging when you have a busy system with higher severities configured. Console logging is the most CPU-intensive, so be careful when turning on higher-level logging for all classes. Remember to turn logging back to defaults when you are finished collecting debug information. Once you have some idea of the problem you are experiencing with the General events, enable more specific logging by using classes and going into Configuration > System > Events > Classes. Classes can be used to disable certain messages and for enabling a specific subset of event messages. Some of the most commonly used event classes are shown in Figure 8-1. Figure 8-1. Viewing the Debug in the Event Filter Window Configuring event classes and turning them on is a fairly simple process, and is the first step required to get the debug information. Once you log in to VPN concentrator using the browser, follow these steps to configure event classes:
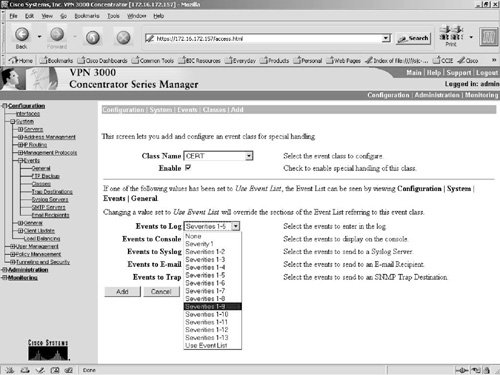
Figure 8-2 shows the configuration of the event class cert with Events to Log set to 9 so that it will show the debug information of a certificate-related message. As you can see, you can control the number of messages you receive for a specific class based on the severity level, so it's important that you understand the meaning and level of detail you will receive based on the severity level. You will typically find yourself using severity level 1-9, as that is most appropriate for debugging. If you run into problems where packet level details are required by Cisco Developer, you may need to run it at severity level 1-13, because with a severity level of 10-13 you will see packet-level detail messages, which are usually analyzed by developers. Table 8-1 defines the various severity levels available for different classes. Note Raise the severity of classes to level 9 during troubleshooting and set it back to the default of (5) or uncheck the Enable button of classes when you are finished with troubleshooting. Level 10-13 is most useful with Authdecode and RADIUS. Once you configure the event classes, the next and final step to view the log is to go to the Monitoring tab. See the following section, Monitoring Tool, for more details on how to view the event log. Monitoring ToolThe Monitoring Tool produces results that are equivalent to the output of different show commands for an IPsec session on the router or PIX firewall. Additionally, this tool presents the debug level output for the classes configured in the previous section, and statistics pertaining to the VPN Concentrator itself. The Monitoring Tool produces statistics, which display, on various activities that are going through or to the Concentrator. These statistics are invaluable first-hand information to isolate the problem fairly quickly. The most important information under the Monitoring section is the Event Log, which, as mentioned before, is equivalent to debug output on the router or PIX firewall. You can view the events for the event classes configured in the "Debug Tool" section in two ways: Filterable Event Log or Live Event Log. For the Live Event Log, you merely click on Live Event Log and messages will be displayed in real time. The Live Event Log window scrolls very quickly with huge amounts of events being generated by the Concentratorevents that pertain to the VPN tunnel build-up process. You may, therefore, find this Live Event Log useful only in a few circumstances, and only if you are very familiar with the packet flow of VPN tunnel build-up process. Quite often you may want to use the Filterable Event Log option to capture the debug for the following reasons:
Figure 8-3. Viewing Debug Output for IKE in Event Log Window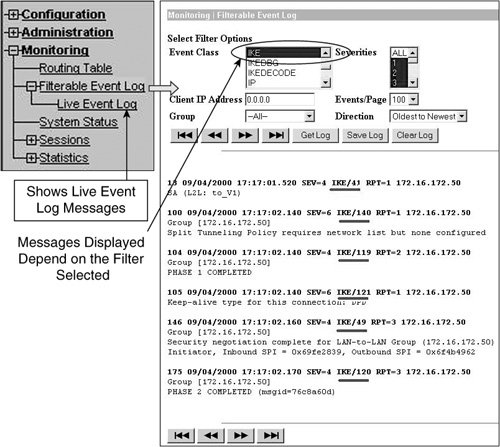 Capturing the debug for a failure of tunnel build-up process will not help unless you know how to properly read and interpret the log message that is being captured. Figure 8-4 is an attempt to show you how to read one of the lines taken from the event log shown in Figure 8-3 (the previous figure). Figure 8-4. Event Log: Message Header Explained Whether you are troubleshooting LAN-to-LAN or Remote Access VPN, always analyze the log on both sides of the tunnel. In the case of LAN-to-LAN, you need to analyze the log messages of the other side (it can be another VPN Concentrator, IOS router, PIX firewall, and so on). In the case of Remote Access VPN, you need to get and analyze the VPN client logs (see the "VPN Client Log" section for details on this). Under some rare circumstances, you may be able to isolate the problem merely by looking at the log from one side of the IPsec tunnel. However, to isolate the issue efficiently and in a timely manner, analyzing the log on both sides of the tunnel end points is a must. There are numerous problems, which you might not be able to analyze just by analyzing one side of the log. As mentioned before in this section, the Monitoring Tool produces some very valuable statistics in addition to the debug level log for different classes. Following is a list of some very important statistics available under the Monitoring tab that help in isolating the connectivity issues of the IPsec tunnel and in finding out statistics on the health of the VPN concentrator itself:
Administer SessionsYou can use the Administration > Administer Sessions window on the VPN Concentrator to find out if the VPN tunnel is getting built up, and processing data across the tunnel by looking at counters for both Bytes Tx (Transmit), and Bytes Rx (Receive). This helps in quickly identifying if the problem is with the tunnel not coming up, or with the inability to pass any data across the tunnel. You can also find out which side of the tunnel device is causing the problem. The following example illustrates this point. Assume that in your Concentrator, you see that Bytes Tx is incrementing over time, but Bytes Rx is staying at zero or at the same number over a period of time. You know that your Concentrator is processing and sending the data over the tunnel, but the other Concentrator may not be responding. The problem could be a drop in transit by another device that is sitting between the Concentrators. Or for some reason the other side of the VPN Concentrator could be failing to respond to your Concentrator. You can confirm what is actually happening by looking at the Bytes Rx and Bytes Tx counters. In theory, these two counters should be exactly opposite each other. The Bytes Tx of your side should be the Bytes Rx of the other side and vice versa, assuming there are no packet drops in transit. Merely by looking at these statistics, you can cut the scope of the problem analysis phase in half by ensuring that your Concentrator is not causing the problem. This means that you do not have to troubleshoot the Concentrator on your side. Figure 8-5 shows an IPsec LAN-to-LAN tunnel that has both Bytes Tx and Bytes Rx counters, which is an indication that the tunnel is processing data traffic properly. Figure 8-5. Administer Sessions Window Showing an IPsec LAN-to-LAN Tunnel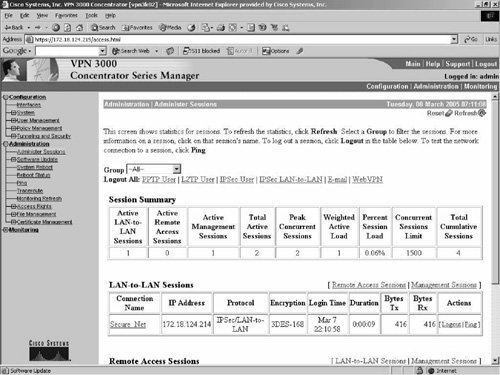 In addition to the tunnel statistics for troubleshooting, Administer Sessions windows also allow you to terminate any VPN session. Configuration FilesThe VPN Concentrator saves the current boot configuration file with both the name CONFIG and the previously running configuration as CONFIG.BAK in flash memory. The location of these files is Administration > File Management. These files can be used for troubleshooting, especially when you need to send these files to the Cisco Support Team or for offline analysis. LED IndicatorsUnder normal operations, LED indicators on the VPN Concentrator are green. The usage gauge LEDs are normally blue. LEDs that are amber or off may indicate an error condition. NA means not applicable; that is, the LED does not have that state. If you have different LED colors, you might be experiencing hardware issues. Consult the Cisco Support Team for additional analysis. Crash Dump FileIf the VPN Concentrator crashes during operation, it saves internal system data in nonvolatile memory (NVRAM), and then automatically writes this data to a CRSHDUMP.TXT file in flash memory when it is rebooted. This file contains the crash date and time, software version, tasks, stack, registers, memory, buffers, and timers, which are helpful to Cisco support engineers. The location of the file is Administration > File Management > Files. If your VPN Concentrator crashes, send the CRSHDUMP.TXT file to the Cisco Support Team for analysis. VPN Client LogAs mentioned before, while troubleshooting Remote Access VPN connection, you need to analyze the log from both sides of the tunnel: VPN Concentrator log and the VPN client log. Just as with the VPN Concentrator, the Cisco VPN client has monitoring capability and a fairly robust debug capability (called Log Viewer). To open Log Viewer, open the VPN Client window by going to Start > Programs > Cisco Systems VPN Client > VPN Client. In the opened VPN Client, you can click on the Log tab or bring up a separate log window by clicking on Log Window. By default the logging is turned on, and you can disable it by clicking on Disable. Click on Log Settings to change the log level of different classes as shown in Figure 8-6. It is recommended to turn all classes of the VPN client log to high and remember to disable event logging when you have finished troubleshooting. Figure 8-6. Turning on Debug Logging for Different Classes on VPN Client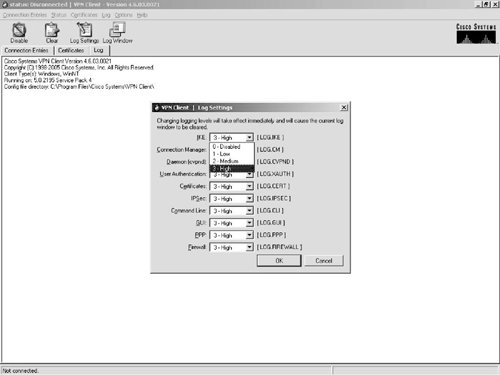 Table 8-2 shows how to read an IKE message collected from the Log Viewer.
Details on the VPN Client GUI Error Lookup Tool and location can be found at the following URL: http://www.cisco.com/warp/public/471/vpn-clnt-err-dict.html Log Viewer shows only the debug messages relating to the VPN tunnel. To view the statistics of the tunnel, for example, whether the packets are encrypted and decrypted or not, you need to right-click on the VPN Client Icon > Statistics. These statistics are important for troubleshooting any data packet transmission issue after the tunnel is built up. Release notes of the VPN clients can be found in the following location: http://www.cisco.com/univercd/cc/td/doc/product/vpn/client/index.htm VPN client software can be downloaded from the following location: http://www.cisco.com/cgi-bin/tablebuild.pl/vpnclient-3des |
EAN: 2147483647
Pages: 190
