Drawing a Line Chart
Charts are useful for representing numeric data in a graphical way. There are several different types of charts, including pie, line, and bar charts. In this section we will learn how to use GDI+ and ASP.NET to draw a line chart from data entered by a user.
A line chart is a set of continuous lines. In the example presented in this section, we will read the size of the chart and data points and draw a chart based on the points. Our discussion will focus first on the ChartComp component, and then on the client application.
12.5.1 The ChartComp Component
ChartComp is a class that defines the functionality to add points to the chart and draw the chart. The client application (discussed in Section 12.5.2) is a Web application that calls the chart's members to add points to the chart and draw it.
The code for the ChartComp class is given in Listing 12.8. The constructor of the class takes the type, color, size, and a page to which this chart belongs. The overloaded InsertPoint method adds a point to the array of points, and the DrawChart method draws the points stored in the array. DrawChart first draws a rectangle, and then it draws points toward the x- and y-axes.
Listing 12.8 The ChartComp class
// Chart component
class ChartComp
{
 public Bitmap curBitmap;
 public ArrayList ptsArrayList =
 new ArrayList();
 public float X0 = 0, Y0 = 0;
 public float chartX, chartY;
 public Color chartColor = Color.Gray;
 // chartType: 1=Line, 2=Pie, 3=Bar.
 // For future use only.
 public int chartType = 1;
 private int Width, Height;
 private Graphics g;
 private Page curPage;
 struct ptStructure
 {
 public float x;
 public float y;
 public Color clr;
 }
 // ChartComp constructor
 public ChartComp(int cType, Color cColor,
 int cWidth, int cHeight, Page cPage)
 {
 Width = cWidth;
 Height = cHeight;
 chartX = cWidth;
 chartY = cHeight;
 curPage = cPage;
 chartType = cType;
 chartColor = cColor;
 curBitmap = new Bitmap(Width, Height);
 g = Graphics.FromImage(curBitmap);
 }
 // Destructor. Disposes of objects.
 ~ChartComp()
 {
 curBitmap.Dispose();
 g.Dispose();
 }
 // InsertPoint method. Adds a point
 // to the array.
 public void InsertPoint(int xPos,
 int yPos, Color clr)
 {
 ptStructure pt;
 pt.x = xPos;
 pt.y = yPos;
 pt.clr = clr;
 // Add the point to the array
 ptsArrayList.Add(pt);
 }
 public void InsertPoint(int position,
 int xPos, int yPos, Color clr)
 {
 ptStructure pt;
 pt.x = xPos;
 pt.y = yPos;
 pt.clr = clr;
 // Add the point to the array
 ptsArrayList.Insert(position, pt);
 }
 // Draw methods
 public void DrawChart()
 {
 int i;
 float x, y, x0, y0;
 curPage.Response.ContentType="image/jpeg";
 g.SmoothingMode = SmoothingMode.HighQuality;
 g.FillRectangle(new SolidBrush(chartColor),
 0, 0, Width, Height);
 int chWidth = Width-80;
 int chHeight = Height-80;
 g.DrawRectangle(Pens.Black,
 40, 40, chWidth, chHeight);
 g.DrawString("GDI+ Chart", new Font("arial",14),
 Brushes.Black, Width/3, 10);
 // Draw x- and y-axis line, points, positions
 for(i=0; i<=5; i++)
 {
 x = 40+(i*chWidth)/5;
 y = chHeight+40;
 string str = (X0 + (chartX*i/5)).ToString();
 g.DrawString(str, new Font("Verdana",10),
 Brushes.Blue, x-4, y+10);
 g.DrawLine(Pens.Black, x, y+2, x, y-2);
 }
 for(i=0; i<=5; i++)
 {
 x = 40;
 y = chHeight+40-(i*chHeight/5);
 string str = (Y0 + (chartY*i/5)).ToString();
 g.DrawString(str, new Font("Verdana",10),
 Brushes.Blue, 5, y-6);
 g.DrawLine(Pens.Black, x+2, y, x-2, y);
 }
 // Transform coordinates so that point (0,0)
 // is in the lower left corner
 g.RotateTransform(180);
 g.TranslateTransform(-40, 40);
 g.ScaleTransform(-1, 1);
 g.TranslateTransform(0, -(Height));
 // Draw all points from the array
 ptStructure prevPoint = new ptStructure();
 foreach(ptStructure pt in ptsArrayList)
 {
 x0 = chWidth*(prevPoint.x-X0)/chartX;
 y0 = chHeight*(prevPoint.y-Y0)/chartY;
 x = chWidth*(pt.x-X0)/chartX;
 y = chHeight*(pt.y-Y0)/chartY;
 g.DrawLine(Pens.Black, x0, y0, x, y);
 g.FillEllipse(new SolidBrush(pt.clr),
 x0-5, y0-5, 10, 10);
 g.FillEllipse(new SolidBrush(pt.clr),
 x-5, y-5, 10, 10);
 prevPoint = pt;
 }
 curBitmap.Save(curPage.Response.OutputStream,
 ImageFormat.Jpeg);
 }
}
12.5.2 The Client Application
The client application is a Web page that is used to get input from the user. The main form of the application is shown in Figure 12.14. The user can enter his/her chart size, and values for five points, including the color of each one.
Figure 12.14. Entering points on a chart
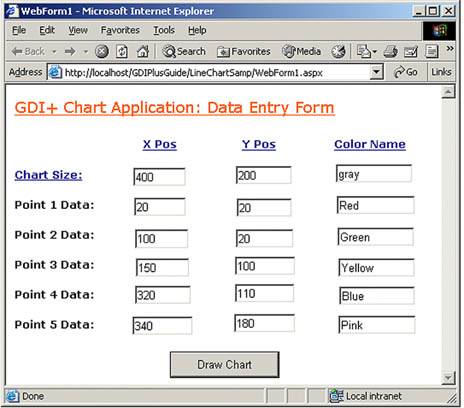
The Draw Chart button draws a line chart. Code for the Draw Chart button click is given in Listing 12.9, where we create an object of type ChartComp and call its InsertPoint and DrawChart methods. InsertPoint adds a point to the chart. DrawChart draws a line chart from the first point to the last point entered by the user.
Listing 12.9 The Draw Chart button click event handler
private void Button1_Click(object sender,
 System.EventArgs e)
{
 // Get the chart background color
 Color clr = Color.FromName(TextBox3.Text);
 // Create a ChartComp object
 ChartComp chart =
 new ChartComp(1, clr, 400, 300, this.Page);
 chart.X0 = 0;
 chart.Y0= 0;
 chart.chartX = Convert.ToInt16(TextBox1.Text);
 chart.chartY = Convert.ToInt16(TextBox2.Text);
 // Add points to the chart
 chart.InsertPoint(Convert.ToInt16(TextBox4.Text),
 Convert.ToInt16(TextBox5.Text),
 Color.FromName(TextBox6.Text) );
 chart.InsertPoint(Convert.ToInt16(TextBox7.Text),
 Convert.ToInt16(TextBox8.Text),
 Color.FromName(TextBox9.Text) );
 chart.InsertPoint(Convert.ToInt16(TextBox10.Text),
 Convert.ToInt16(TextBox11.Text),
 Color.FromName(TextBox12.Text) );
 chart.InsertPoint(Convert.ToInt16(TextBox13.Text),
 Convert.ToInt16(TextBox14.Text),
 Color.FromName(TextBox15.Text) );
 chart.InsertPoint(Convert.ToInt16(TextBox16.Text),
 Convert.ToInt16(TextBox17.Text),
 Color.FromName(TextBox18.Text) );
 // Draw chart
 chart.DrawChart();
}
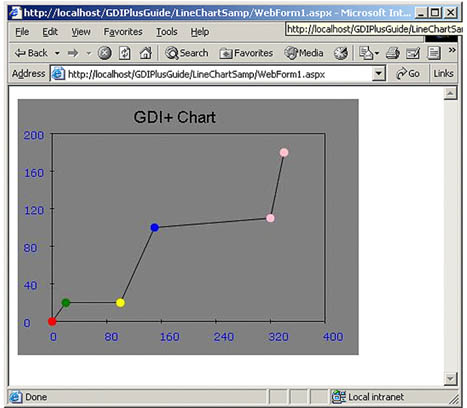
Now if you use the data entered in Figure 12.14 and click the Draw Chart button, the output will look like Figure 12.15.
Figure 12.15. A line chart in ASP.NET
GDI+: The Next-Generation Graphics Interface
- GDI+: The Next-Generation Graphics Interface
- Understanding GDI+
- Exploring GDI+ Functionality
- GDI+ from a GDI Perspective
- GDI+ Namespaces and Classes in .NET
- Summary
Your First GDI+ Application
- Your First GDI+ Application
- Drawing Surfaces
- The Coordinate System
- Tutorial: Your First GDI+ Application
- Some Basic GDI+ Objects
The Graphics Class
- The Graphics Class
- Graphics Class Properties
- Graphics Class Methods
- The GDI+Painter Application
- Drawing a Pie Chart
Working with Brushes and Pens
- Working with Brushes and Pens
- Understanding and Using Brushes
- Using Pens in GDI+
- Transformation with Pens
- Transformation with Brushes
- System Pens and System Brushes
- A Real-World Example: Adding Colors, Pens, and Brushes to the GDI+Painter Application
Colors, Fonts, and Text
- Colors, Fonts, and Text
- Accessing the Graphics Object
- Working with Colors
- Working with Fonts
- Working with Text and Strings
- Rendering Text with Quality and Performance
- Advanced Typography
- A Simple Text Editor
- Transforming Text
Rectangles and Regions
- Rectangles and Regions
- The Rectangle Structure
- The Region Class
- Regions and Clipping
- Clipping Regions Example
- Regions, Nonrectangular Forms, and Controls
Working with Images
- Working with Images
- Raster and Vector Images
- Working with Images
- Manipulating Images
- Playing Animations in GDI+
- Working with Bitmaps
- Working with Icons
- Skewing Images
- Drawing Transparent Graphics Objects
- Viewing Multiple Images
- Using a Picture Box to View Images
- Saving Images with Different Sizes
Advanced Imaging
- Advanced Imaging
- Rendering Partial Bitmaps
- Working with Metafiles
- Color Mapping Using Color Objects
- Image Attributes and the ImageAttributes Class
- Encoder Parameters and Image Formats
Advanced 2D Graphics
- Advanced 2D Graphics
- Line Caps and Line Styles
- Understanding and Using Graphics Paths
- Graphics Containers
- Reading Metadata of Images
- Blending Explained
- Alpha Blending
- Miscellaneous Advanced 2D Topics
Transformation
- Transformation
- Coordinate Systems
- Transformation Types
- The Matrix Class and Transformation
- The Graphics Class and Transformation
- Global, Local, and Composite Transformations
- Image Transformation
- Color Transformation and the Color Matrix
- Matrix Operations in Image Processing
- Text Transformation
- The Significance of Transformation Order
Printing
- Printing
- A Brief History of Printing with Microsoft Windows
- Overview of the Printing Process
- Your First Printing Application
- Printer Settings
- The PrintDocument and Print Events
- Printing Text
- Printing Graphics
- Print Dialogs
- Customizing Page Settings
- Printing Multiple Pages
- Marginal Printing: A Caution
- Getting into the Details: Custom Controlling and the Print Controller
Developing GDI+ Web Applications
- Developing GDI+ Web Applications
- Creating Your First ASP.NET Web Application
- Your First Graphics Web Application
- Drawing Simple Graphics
- Drawing Images on the Web
- Drawing a Line Chart
- Drawing a Pie Chart
GDI+ Best Practices and Performance Techniques
- GDI+ Best Practices and Performance Techniques
- Understanding the Rendering Process
- Double Buffering and Flicker-Free Drawing
- Understanding the SetStyle Method
- The Quality and Performance of Drawing
GDI Interoperability
Miscellaneous GDI+ Examples
- Miscellaneous GDI+ Examples
- Designing Interactive GUI Applications
- Drawing Shaped Forms and Windows Controls
- Adding Copyright Information to a Drawn Image
- Reading and Writing Images to and from a Stream or Database
- Creating Owner-Drawn List Controls
Appendix A. Exception Handling in .NET
