Identifying Project Schedule Risk
Overview
"Work expands so as to fill the time available for its completion.''
—C. NORTHCOTE PARKINSON, Parkinson's Law
Although Parkinson's observation was not backed up with any empirical data, the truth of his "law'' is rarely questioned. It seems particularly appropriate for technical projects, because, in addition to all the obvious reasons that people have for using up the time available to complete their work, on technical projects there is an additional reason. Most people who are drawn to technical projects are very analytical, and they like to be precise, accurate, and thorough. If there is time available to attempt to make something perfect, most engineers will try.
Projects, however, are rarely about perfection. They are about pragmatism, delivering a result that is "good enough.'' Practicality is not particularly motivating, and it is rarely much fun, so technical projects often diverge from the direct path and out into the weeds. Thoroughly identifying schedule risks requires awareness of this, and disciplined use of project management planning tools to create appropriate schedules that avoid overengineering.
In the previous chapter, factors that make projects literally impossible were considered. In this chapter, and in Chapter 5, concerning resource risks, the focus is on constraints—factors that transform otherwise reasonable projects into failures. Project processes for scheduling and resource planning provide a fertile source for discovery of project risks that arise from these constraints.
Much of the content of this chapter falls into the "Project Time Management'' segment of the PMBOK Guide. In particular, the principal project schedule risk ideas covered in this chapter include:
- Sources of schedule risk
- Activity definition
- Estimating activity duration
- Activity sequencing
Sources of Schedule Risk
Schedule risks are the most numerous in the Project Experience Risk Information Library (PERIL) database, representing well over a third of the records. They fall into three categories: delays, dependencies, and estimates. Delays occurred whenever something expected by the project—a part, a decision, a piece of information—was late. Schedule dependency risks relate to unanticipated linkages or missing inputs that affect primarily the project timeline (dependencies that affect primarily the project deliverables or the work are grouped with the risks associated with scope changes). The other category of schedule risk comes from duration estimates that are insufficient for completion of scheduled project activities. The summary:
|
SCHEDULE RISKS |
COUNT |
CUMULATIVE IMPACT (WEEKS) |
AVERAGE IMPACT (WEEKS) |
|---|---|---|---|
|
Delay |
46 |
134 |
2.9 |
|
Dependency |
21 |
102 |
4.9 |
|
Estimates |
15 |
70 |
4.7 |
Project problems sorted by subcategories within the three categories are summarized in Figure 4-1. As shown, the largest total impact came from various sources of dependency and delay. Although delay risk caused more problems overall, dependencies on other project work was the dominant subcategory.
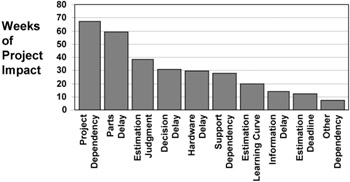
Figure 4-1: Schedule risks in the PERIL database.
Delay Risks
Delay risk represents more than half of the schedule risks and nearly a sixth of all the risks in the PERIL database. Impact from delays was lower on average than for other risks, slightly less than three weeks. Most of the reported delays related to parts that were required for the project deliverable or hardware that was required to do project work. Delivery and availability problems were a common root cause for the delay, but there were also quite a few issues around international shipping, including customs, paper-work, and other associated concerns. Delays were also a result of parts or other hardware that arrived on time but were found to be defective. Time required to replace or repair things that did not work properly was a significant source of project slip. Delay of parts caused both the largest number of the delay risks and the most severe impact, almost four weeks on average.
Slow decisions caused quite a few project slips. Almost a quarter of the delay examples were due to inaction by managers or other stakeholders who did not act as quickly as necessary to keep the project on schedule. Sometimes the cause was poor access to the decision makers, or their lack of interest in the project. For other projects, delays were the result of extended debates, discussions, or indecision. Projects facing these issues lost nearly three weeks on average waiting for a response to a project request.
Projects also were delayed because they lacked information. Some of the delay was due to time differences separating parts of global project teams. Losing one or more days on a regular basis was common, due to misunderstandings and communication time lags. In other cases, access to information was poor, or delivery of needed reports was interrupted.
Potential delay risks may be difficult to anticipate, and many of them seem to be legitimately "unknown'' risks. Thorough analysis of the input requirements at each stage of the project plan, however, will highlight many of them.
Dependency Risks
Dependencies are the most severe category of schedule risk in the PERIL database, averaging almost five weeks of impact per incident. There are a number of dependency types, but the most numerous ones in the database are dependencies on other projects and on project support.
Dependency risks from other projects are not only the most numerous of the dependency risks; they also are the most damaging, with an average of more than five weeks. In larger projects (often classified as programs), a number of smaller projects interact and link to one another. In addition to providing one another with information and deliverables that meet well-defined specifications (which is a scope risk exposure), each project within a larger program must also synchronize the timing of schedule dependencies to avoid being slowed down by (or slowing) other projects. Managing all these connections is difficult in complex programs, and the amount of damage increases with time; many of these risks in the PERIL database were noticed only late in the project. Even for the interfaces that were defined in advance, delay was fairly common because of the uncertainty in each project and the likelihood that at least one of the related projects would encounter some sort of difficulty. With so many possible failure modes, it becomes almost certain that something will go wrong. Analysis of the connections and interfaces between projects is a key aspect of program management, and many of the risks faced by the projects become visible through interface management techniques.
Other dependencies that interfere with project schedules in the PERIL database are support problems. These include interruption of hardware services, such as computer systems or networks required by the project, and inadequate access to resources such as help desks, system support, and people who understood older but necessary applications. Several projects were delayed by outages for maintenance that was scheduled in advance but unknown to the project team. One project had severe impact when the legal and paperwork requirements for international shipments changed abruptly. Monitoring the environment of the project and its infrastructure for planned or likely changes can forewarn of many of these potential problems.
Estimating Risks
Of all the types of schedule risk found in technical projects, estimating seems to be the most visible. People who work on technical projects are usually well aware of how inadequate their estimates are and freely admit it. Despite this, the number of misestimated incidents in the PERIL database is not large, and their impact is about equal to the average for the database as a whole. One source of difficulty with estimating in technical projects is the relatively rapid change in the work, which makes the standard advice offered for improvement less useful. Good estimates, we are told, rely on history. If the environment is in constant flux, history may not seem so useful (more on this later in the chapter).
The most frequent type of estimating problem reported in the PERIL database is related to judgment. For a good number of projects, the issue was estimates that were consistently overoptimistic. Some estimates reported were too short by factors of three and four. Dealing with this source of estimating risk requires thorough planning, with appropriate understanding and decomposition of the work, so that the effort and steps required are known. It also requires good record-keeping. Metrics and project data archives are invaluable in creating future estimates that are more consistent with reality than past estimates have been, even for projects where things change rapidly. Having some data always beats having to guess. Another powerful tool in revealing and combating optimistic estimates is worst-case analysis. Not only will the answer to the question "What might go wrong?'' reveal something about the likely duration; it will also uncover new potential sources of risk.
A small number of cases of estimating risk involve learning curve issues. The impact of this was well above the average for the database, nearly seven weeks. The quality of the estimates when new technologies or new people (or, even worse, new technologies and new people) are involved is not good. The portions of project work that require staff to do things they have never done before are always risky, and thorough analysis of the work can show which parts of the project plan are most exposed. Training plans must be established for the project whenever new skills and capabilities are necessary, and these need to be explicit in the project timeline and budget.
There are also a number of cases in the PERIL database where the estimates used by the project were poor, but the root cause was outside the project. Technical projects frequently have aggressive deadlines determined in advance for them with little or no input from the project team. Even when the project plan shows the deadline to be unrealistic, the objective is retained. These projects are often doomed from the start; they represent a common type of overconstrained project.
Schedule risks are generally uncovered through planning processes. Creating a comprehensive schedule using better processes for estimating, more thorough analysis of linkages and dependencies, and careful worst-case analysis will reveal many of the schedule exposures.
Activity Definition
Building a project schedule starts with defining project work at an appropriate level of decomposition. Both estimating and sequencing of work in a project are most easily and appropriately done using small parts of the project. Where the entire project may be big, complicated, and confusing, the principle of "divide and conquer'' allows independent consideration of each little piece and lets the project team bring order out of chaos. The starting point for most schedule development (as well as resource planning) is the project work breakdown structure (WBS). If the work described at the lowest level of your WBS is consistent with the "two to twenty day'' guideline, it may be used as it is to create your schedule. If your WBS decomposition is not yet to that level of granularity, you need to do further analysis and decomposition. The ultimate goal of the process, however you approach it, is small, self-contained, deliverable-oriented bits of work that you can estimate, schedule, track, and generally use to manage your project.
Unfortunately, although the processes for developing a project schedule are generally consistent for various types of technical projects, the terminology is not. In project management literature, scheduling tools, and methodologies, many different terms are used to describe small pieces of project work. In "Project Time Management,'' the PMBOK Guide refers to these pieces of work as activities, defined there as "an extension to the WBS.'' Other common terms for project work at the lowest WBS level are "work packages'' and "tasks,'' and in practice all of this terminology tends to be used interchangeably with "activities,'' the term used generally throughout the rest of this book. In agile software methodologies such as extreme programming, work decomposed to the level used for scheduling is called a "story.''
As noted in Chapter 3, what you name these bits of project work matters little. What matters a great deal for risk management, though, is that you do define them. In most project methodologies, activities (or whatever name you prefer) are defined by the lowest levels of the project WBS. Project activities, once defined, provide the foundation for project planning and risk identification.
Both estimating and sequencing of activities are necessary processes for creating a project schedule. Which of these planning tasks is undertaken first is largely a matter of personal preference. The PMBOK Guide shows these two processes in parallel, which is realistic. Both estimating and sequencing project activities are iterative, and there is a good deal of interaction between these two processes when building a project plan. If starting to sequence project activities prior to estimating them seems more natural to your projects, use the material in this chapter in that order. What is most important is that both processes be conducted thoroughly, as each reveals different schedule risks during project planning.
Estimating Activity Duration
Estimating risk provides a substantial number of the entries in the PERIL database. A good estimating process is a powerful tool for identifying this type of schedule risk. When the estimates that are precise can be separated from those that are uncertain, the risky parts of the project are more visible. When estimates are "top-down,'' or based on guesses, the exposures in the project plan remain hidden. Quite a few failed projects are the result of inaccurate estimates.
In the dictionary, an estimate is "a rough or approximate calculation.'' Projects require approximations of both time and cost. The focus of this section is on the risks associated with time estimates. However, project estimates are all related. A number of concepts introduced here are expanded in Chapter 5 and used there to identify resource risks through the process of refining estimates of effort and cost. Estimates of varying accuracy are derived throughout a project, from the "rough-order-of-magnitude'' estimates used to initiate projects to fairly precise estimates that are refined as the project runs to control and execute the work in the project plan. Single-point estimates imply accuracy that is rarely justified in technical projects. Estimates that make risk visible are therefore stated as ranges, or include percentages (plus and minus) to indicate the precision, or specify a probability distribution of expected possibilities.
Estimation Pitfalls
As mentioned before, estimating project work is challenging, and most people admit that they do not do it very well. Understanding the factors that make accurate estimating hard to do for technical projects provides insight into sources of project risk, and it may also indicate how to improve future estimates. Four key impediments to estimating well are:
- Avoidance
- Optimism
- Lack of information
- Granularity
Probably the most significant problem with estimating is that people who work on technical projects do not like to estimate, and they avoid it. The appeal of technical projects is the work— designing, programming, engineering, building, and other activities that the analytical people on these projects like to do. People avoid estimating (and planning in general) because it is seen as overhead, or boring "administrivia.'' Estimates are done quickly, and only grudgingly. Most technical people have little estimating experience or training for estimating, so their skill level is low. Few people like doing things that they are not very good at. To make matters worse, since the estimates provided are so often inaccurate, most of the feedback they get is negative. It is human nature to avoid activities that are likely to result in criticism and punishment.
Too much optimism is another enemy of good estimates. In the PERIL database, the most common cause for risk due to estimating is judgment. Estimates that are too short create many additional project problems including severe increases in late-project work and deadline slippage. Excessive optimism stems from a number of causes, but one of the most common is top-down pressure. Far too many projects are undertaken with unrealistically short estimates for project activities because the sponsors and stakeholders impose unrealistic time constraints on the project. These constraints force the project team to create estimates in their plans on the basis of the time available ("schedule to fit''), not based on the reality of the work. Other sources of optimistic estimates are reliance on best-case scenario analysis (each activity is scheduled assuming that everything goes well), assumptions about the amount of time that people will have available to do project work, and overconfidence in the talent and speed of the project team.
A third issue is a lack of information. Initial project estimates are the product of early analysis, when the amount and quality of available project information is still low. Often, scope definition is still changing and incomplete, and significant portions of the work are poorly understood when these estimates are done. Compounding this, on most technical projects there is little (or no) historical information to use in estimating, and there are no defined estimating processes used. One method used far too often is "guessing.''
A fourth factor that contributes to poor estimates is the granularity of the work. Early estimates are often done for projects on the basis of descriptions of the work and the deliverables without much detail. Estimates are chronically inaccurate when they are based on high-level project deliverables that lack acceptance criteria. The quality of estimates for long duration project activities is also poor. Guidelines for project planning and decomposing project effort into a WBS recommend activities of roughly two weeks in duration, or in a range of "two to twenty work days'' at the activity level. People are generally unable to assess and estimate work with much accuracy when the duration extends beyond a month.
To recap, metrics, well-defined estimating procedures, clear scoping, disciplined planning, and periodic review of the project are all instrumental in improving estimates and decreasing estimation risk.
The Overall Estimating Process
Before you can work on your estimate, you will need many inputs. A comprehensive list of project activities is one input. Another is the resource plan, information about the people and other resources available to the project. The resource plan is part of the "Project Resource Management'' segment of the PMBOK Guide, and it is a major topic in Chapter 5. (The resource plan also requires activity duration estimates as an input, so each of these processes is a required input for the other. As with most project planning processes, resource planning and scheduling are iterative; they proceed in parallel and are not actually caught in a loop.)
One key purpose of defining the people and other resources available to the project was mentioned in Chapter 3: identifying owners for the work at the lowest level of the project WBS. Having a single owner for each activity is one way to ensure clear responsibility, and the activity owner is generally responsible for the initial activity duration estimate. The activity owner is also responsible for the planning, execution, and completion of the activity. Whether the owner is the only contributor, is leading a team, or serves as a liaison to another group who will do the work, the estimate is an important determinant of the ultimate success or failure of the work, and that is the owner's responsibility. For larger activities performed by a team, the other contributors should also participate in establishing the initial estimates.
Accurate estimates require clear, specific information about each activity. It is important to document and use any information regarding constraints on activity durations or project assumptions that might affect the estimates. You need to clearly and concisely define the deliverables for each activity. Activities with more than one deliverable may be easier to manage, and have less risk, if they are broken down further, creating a new, smaller activity associated with each deliverable. As part of the documentation for each activity, capture acceptance criteria and any other requirements in unambiguous, measurable terms. If the specifications for any activity deliverables are not defined or are unclear, note this as a risk.
Project time estimates may be measured in duration (work time), in calendar duration (elapsed time), or in effort (a combination of people and time, such as "engineer-days''). Within your project, establish a single standard for the units of each type of estimate to make it easier to compare all the information and to build the schedule. Each of these types of estimate has its value in the planning process. Effort estimates are a large component of project cost. Duration estimates are used for input to computer scheduling tools and for the initial schedule analysis, and calendar durations support accurate tracking.
For each identified activity, the estimating process usually starts with either a duration estimate or an effort estimate and then proceeds to derive the other two types of estimates through a series of logical steps. The final output of the process, actual calendar time, defines the project timeline. Whatever sequence you prefer for developing estimates, only use bottom-up analysis of the project data for your initial estimates. For project planning and preliminary schedule development, avoid "pegged-date'' or politically specified arbitrary estimates. Building a plan with unrealistic estimates conceals risks and undermines your ability to negotiate necessary project changes.
Some project leaders prefer to derive duration estimates first and then develop the effort estimates when other planning data, such as activity sequencing information, becomes available. Effort estimates are then used to validate or adjust the duration estimates, based upon the accumulating project information. The approach of starting with effort estimates is usually slightly more efficient and is described here. A graphical summary of the process described appears in Figure 4-2. Whatever sequence you use to develop estimates, the same issues, factors, and risks are involved.
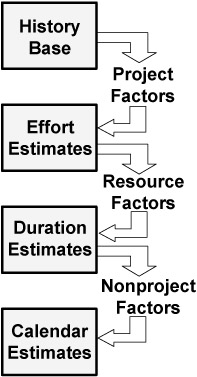
Figure 4-2: Overall estimation process.
Effort Estimates and Project-Specific Factors
All estimating methods (even guessing) start with information derived in some way from history and experience. The history you use can be anecdotal, stored in a metrics database, built into formulas, jotted down in lab notebooks, or found in myriad other sources. Specific sources and common techniques for obtaining this data follow. On the basis of the initial historical data, effort estimates may be derived by considering project-specific variables. Project-specific information is used to adjust initial historical information, on the basis of specific differences between the current project and earlier work. Project-specific factors include:
- Clarity of the project specifications
- Likelihood of significant specification change
- New resource requirements
- Longer expected project duration
- Unusual technical complexity
- New required technology
- Extreme requirements for reliability
- Geographic separation and cultural diversity on the project team
- Infrastructure and environment differences
- Training requirements
Every lowest-level activity in your WBS requires an effort estimate, measured in person-hours (or contributor-days, or some other unit combining people and time). In addition to providing input for adjusting historical data, some of these project-specific factors may also represent significant project risks and should be noted as such.
Effort estimates themselves also reveal risks. Any activities with estimates that no one is very sure of are risky. However, lack of confidence in an estimate is a symptom of risk, not the risk itself. Whenever any of your project estimates seem untrustworthy, probe for why, and note the root cause as the risk. Two common sources of low-confidence estimates are lack of experience with the work and activities that may have several different outcomes, such as an investigation. Also risky are any activities that resist your best efforts to break them down and remain too large to estimate accurately (generally, more than 120 person-hours or twenty days of duration).
Duration Estimates and Resource Factors
Effort estimates, combined with project information on people and teams, provide the basis for duration estimates. Initial resource plans provide information on resource factors, such as:
- The amount of time each day each team member has for project work
- The number people contributing to each activity
- The skills, experience, and productivity of each team member
- Training and mentoring requirements
- Nonproject responsibilities for each person
- Communication lags and other consequences of distributed teams
- Expected turnover or attrition of staff during the project
- The number and duration for project (and other) meetings
- The amount of project communication and reporting
- Travel requirements
- The number of required people not yet assigned to the project
The first factor in the list, the number of project hours in a day, is a very common cause of underestimation. Not every hour that people work is available for project activities. Meetings, communication (both formal and informal), breaks, meals, and other interruptions take time. Even the common assumption of "five to six'' hours per day for project activities is significantly higher than the reality available to many projects. Productivity is also a source of variation. For most types of project work, a ten-to-one difference in productivity between the most and the least competent people is common. All estimates of effort or duration made in advance of assigning the specific people who will do the work are risky. These and other resource-related risks are discussed in greater detail in Chapter 5.
By considering the effort required by each activity in light of the resource factors, you can determine activity durations in workdays (or some other suitable units). Duration estimates are used for most schedule analysis and are required inputs for computer scheduling tools. Computer tools are becoming universal on technical projects, and they are where much of the other project information is stored, including activity names (and the higher levels of the WBS, as well), information about owners and project staffing, activity sequencing information, and even detailed descriptions and project assumptions.
Quite a few terms are used in project management practice to describe a database of project information, including a WBS dictionary, an ETVX (Entry, Task, Validation, eXit) analysis, a project spreadsheet, or simply "the project database.'' Whatever you call it, for effective risk management this information should be in a format and location easily accessed by the project team members who need to refer to it. Increasingly, network or Internet-enabled software provides timely, current information to the whole project team and all the stakeholders, wherever they are located and whenever they may need it.
Calendar Estimates and Nonproject Factors
The final stage of estimation is to translate duration estimates into calendar estimates. If duration information is entered in a computer scheduling tool, much of this transformation will be done for you. Nonproject factors such as holidays may be put into the calendar database, and the software will do the calculations. To translate workday estimates into elapsed-time estimates, all the days that are not available for project work must be accounted for. Some of the nonproject factors are:
- Holidays
- Weekends
- Vacations and other paid time off
- Other projects
- Other nonproject work
- Lengthy nonproject meetings
- Equipment downtime
- Interruptions and shut-downs
- Scheduled medical leave
Calendar estimates account for the number of total days between the start and end of each activity. Specific dates for each activity are derived by combining duration estimates, nonproject factors, and the activity sequencing information that is discussed later in this chapter. One particular risk common for global projects is a result of differences in scheduled time off for geographically separate parts of the project team. Frequent loss of some of the project team to various national and religious holidays is disruptive enough, but all too often these interruptions come as a surprise to the project leader, who may be aware only of local holidays. These nonproject factors may differ for each member of the project team, and collecting information about everyone, wherever he or she may be, is an important part of project planning.
Estimating Techniques
Most of the estimating risks in the PERIL database are categorized as judgment problems. Compared to their plans, the affected projects saw significant delays due to estimates that were unrealistically short. While a few of the cases involved one-time issues that were unlikely to recur, several chronic problems affected project after project. Some projects failed to account for the increasing complexity they encountered as the system components and the number of interfaces grew. Another project always estimated international shipments to take three weeks less than the actual average time they took. Better processes and more attention to performance data will at least identify many of these risks, if not eliminate them.
Effective estimating techniques all rely on history. The best predictor of effort or duration for work on a project is the measurement made of the same (or similar) work done earlier. Project estimating either uses historical data directly or applies processes that have history as a foundation. Sources of appropriate data are essential to estimating well and reducing estimating risk. Discussion of some effective techniques follows.
Finding and Using Historical Data
The simplest technique for estimating is to "look up the answer.'' For activities that vary little from project to project, this may be the only technique necessary. Even on high-tech projects, many activities are repeated with little variation project after project—things such as creating documentation and conducting standard reviews and tests.
One particularly significant aspect of the extreme programming (XP) methodology, which is increasingly applied to small software projects, is the recognition that the estimates used must be based on experience. In XP this principle is called "yesterday's weather,'' from the observation that today's weather will match yesterday's weather more times than not. Strict use of data collection and application of productivity information to estimate future work is one of the reasons that XP delivers more predictable results than earlier evolutionary software methodologies. Schedules developed for XP projects never commit to deliver more in the next development cycle than was actually completed in the last cycle.
The most useful historical information, for projects of all types, is solid empirical data, collected with discipline and care during earlier work. Unfortunately for most project leaders, project metric databases are still fairly rare for technical projects, so global standards and norms often cannot simply be looked up. While there may be no convenient online database where you can retrieve good estimating information, even for the more routine activities in the project, almost always some usable data are available. For example, potential sources of activity effort and duration information for projects can be found by reviewing data from:
- Postproject analysis reports (or lessons learned, or project retrospectives, or postmortems) from earlier projects
- Personal notes and status reports from your projects or projects done by peers
- Notes from team members on related earlier activities
- Engineering or other published technical data (either inside your organization or public) from conference proceedings, papers, or articles
- Published reference materials
- Engineering or other technical standards
- The Web (generally the most plentiful, as well as the least reliable, source)
Anecdotal historical information is all around you; everyone likes to share stories. Your own experiences and memories and the recollections of the rest of the project team are anecdotal history. Other sources are discussions with peers, industry experts, consultants, service suppliers, and anyone else who you think may have experiences that could supplement your team's insight into the work.
Written historical data tends to be more reliable but may be difficult to find. Anecdotal information is relatively easy to get but may not be very trustworthy. (After some time passes, recollections concerning data on activity durations may not be very accurate.) Either source can serve as a good foundation for preliminary estimating and planning, though, especially if the data are recent, relevant, and credible.
Another approach you can use when there are no historical data is to create some. Begin by breaking the activity to be estimated into even smaller pieces of work, and choose a representative portion. Then, perform this part of the work and measure the duration (or effort) required to complete it. Using your assessment of the approximate percentage of the entire activity the completed part represents, you can extrapolate from the measurement and estimate the remainder of the activity. This idea is most easily applied to very repetitive work (to estimate the digging of a one-hundred-meter trench, get out a shovel and time how long it takes to dig the first meter), but it may also be applied to complex, technical projects. By selecting and implementing an average software module or a typical hardware assembly out of a complex system, you can create an estimate of the whole based on factual information, even when the system involves new or changing technology. This technique is basically equivalent to the "yesterday's weather'' estimating method used for XP projects. In applying this technique, if you select a portion of the work where you have feasibility issues, it may also assist you in assessing (and managing) scope risk.
In any event, lack of documented history is a problem that is easy to fix. Measurement and productivity analysis are essential to ongoing management of estimation risk, so resolve to begin, or continue, collecting actual activity data at least for your projects. Metrics useful for risk management are covered in detail in Chapter 9.
Experts and Expert Judgment
Historical information need not be personal to be useful. Even when no one on the project has relevant experience or data, there may be others who do, outside your project. One source may be peers, managers, and technical talent elsewhere in your organization. Another possibility is to seek out the opinions of colleagues in professional societies who do similar work for other companies. Outside consultants in technical or management fields may have useful information that they will share, for a fee. Even quotations and proposals from service suppliers may contain useful data that you can use for estimating project work.
Experience-Based Rules and Parametric Formulas
When a type of work is repeated often, the data collected over time may evolve into useful formulas for effort or for duration. These formulas may be informal "rules of thumb'' providing approximate estimates that relate to measurable aspects of activity output, or they may be elaborate, precise (or at least precise-looking) analytical equations derived by regression analysis using data from past projects. In both of these cases, the parameters used as input in the formulas are independent variables relating to the size of the activity deliverables. The outputs of these formulas are dependent variables, calculated to provide estimates for the project plan. Experiential rules include statements such as "It takes one day per page to deliver new documentation (half a day to complete a page of modified documentation)'' and "Plan to spend one day developing each hour of training material.'' These rules can be very accurate if the foundation information is both current and relevant.
Parametric formulas are also widely used, especially where there is a solid base of data and consistency between your project and the projects on which the formulas were derived. There are parametric formulas that use activity outputs at a very low level, such as "noncommented source statements'' in software projects or counts of components in hardware projects. For software projects, most low-level parametric formulas are related to the Constructive Cost Model (COCOMO), developed several decades ago by Barry Boehm at TRW, or to the more recent COCOMO II effort undertaken by Boehm and others at the University of Southern California. These formulas relate code size to effort (in "engineering months'') and to duration (in "calendar months''). While there are examples where these formulas work well, for many projects it is nearly as difficult to estimate parameters such as lines of code during project planning as it is to estimate activity durations. It has been often observed that the first time you know for sure how many lines of code there are in a software system is the day you deliver it (and sometimes, not even then). The end of the project is a little late to derive project estimates.
There are also formulas that use information at higher levels of abstraction. For hardware projects, you could use system block diagrams or complexity analysis. For software projects, formulas are often based on "function points'' or related concepts. Function points were developed at IBM in the 1970s and have been extended over the years by many others for use with a spectrum of programming languages and in a wide variety of software applications. This higher-level input data may be easier to assess early in your project than low-level "size'' data such as components or lines of code, but the formulas tend to have high uncertainty.
There are numerous examples of these size-based estimation methods, and one (or several) may be appropriate for the work in projects of any kind. Even if the initial formulas come from published or borrowed information, you will get the best results if you collect your own, local data and normalize the formulas and experiential rules for your own environment. Every project is different, and someone else's formulas are unlikely to predict what will happen on your project. Reassessment throughout projects, using increasingly more accurate size information, minimizes your estimating risk.
Delphi Group Estimating
The Delphi process was not initially developed to do project estimates. It was first used for a type of estimate where people have historically been even more inaccurate—sales forecasts. The process uses inputs from several people (a minimum of four, ranging up to as many as twelve) to establish ranges and stimulate discussion. The Delphi method relies on the fact that, although no one person may be able to confidently provide reliable estimates, the middle range of estimates drawn from a population of stakeholders is frequently a realistic predictor for numeric results.
The process is relatively simple. You begin by selecting a suitable small group that will be the estimating team. Include "experts,'' project team members, and people from whom you will need buy-in. The process works best when all the people involved have some experience with the project and the activities to be estimated and the group is not so large as to require a lot of overhead or stifle discussions. Ideally, you should gather this team for a face-to-face meeting, but Delphi can also be done with distributed teams through teleconferencing or even by using cycles of electronic mail. Delphi begins with an overview of the process for anyone not familiar with it and a brief description of the project activities that need estimates. The activity descriptions may include any information about the work—expected deliverables, known problems, skills required and people available, assumptions—but never any indication concerning the estimate. The point of Delphi is to probe what each individual thinks is the answer to the question, in this case an estimate, and access to other opinions distorts the outcome. For the first cycle, each person on the team quickly provides his or her own estimates, with no help from anyone else.
All the estimates are collected and sorted into three roughly equal groups: shortest, most likely, and longest. The whole group then discusses the merits of the value calculated by averaging the inputs of the middle group, exploring reasons to support or modify it. It is important to hear from those who supplied much higher or lower estimates. The optimists may have insight into better methods, clever shortcuts, or other approaches to the work that realistically justify their shorter estimates. The pessimists are worth hearing from, as they are often the people who have the most experience with the work being considered and know details and requirements that others may be unaware of.
You may repeat this estimation process through one or more additional cycles—collecting estimates, sorting, and discussing—to build consensus. For project activities, Delphi estimates generally converge quickly.
Delphi is a "group intelligence'' way to tap into subconscious historical data that would otherwise be unavailable. It is also a collaborative team technique and contributes to group buy-in, ownership, and motivation. Delphi estimates are not seen as imposed by one individual; the estimates belong to the team, and the team will be motivated to do whatever they can to deliver on them.
Further Decomposition
For activities where there are few or no relevant historical data, further decomposition may reveal portions of the work for which you do have data, or which are at least small enough to think through clearly. The same process used to do a WBS for the project may be applied to project activities that are hard to estimate, decomposing the activities into smaller, sequential subactivities (much smaller than would usually be planned or tracked). One approach is to break activities into phases as might be done with the whole project: investigation, analysis, development, documentation, testing. Other ideas are to work using subcomponents of the activity deliverable or from activity completion and acceptance criteria.
Project Level Estimates
Once every activity in the project WBS has an effort estimate, you can calculate the effort required in each project phase and total project effort. The "shape'' of projects is generally consistent over time, so the percentages of effort for each project phase derived from your planning process ought to be consistent with the measured results from earlier projects. Whatever the names and contents of the actual project phases, any significant deviation in the current plan compared with historical norms is good reason for skepticism. Any plan that shows a lower percentage of effort in a given project phase than is normal has either missed some necessary activities or underestimated the activities identified.
Published industry norms may be useful, but the best information to use for comparison is local. How projects run in different environments varies a great deal, even for projects using a common life cycle or methodology. Historical data from peers can be helpful, but data directly from projects that you have run are better. Disciplined collection of project metrics is essential for accurate estimation, better planning, and effective risk management. If you have personal data, use them. If you lack data from past projects, here is yet another good reason to start collecting them.
Not all project phases are as accurately planned as others, because some project work is more familiar and receives more attention. The middle phases of most project life cycles contain most of the work that defines "what we do.'' Programmers program; hardware engineers build things; tech writers write; and, in general, people do what it says on their business card. Whatever the "middle'' phases are called (e.g., development, implementation, execution), it is during this portion of the work that project contributors use the skills in which they have the most background and experience. These phases of project work are generally planned in detail, and activity estimates are often quite accurate. The phases that are earlier (e.g., investigation, planning, analysis, proposal generation) and later (e.g., test, roll-out, integration, ramp-up) are generally less accurate. Using the life-cycle norm data, and assuming the "development'' portion of the plan is fairly accurate, it is possible to detect whether project work may be missing or underestimated in the other phases. If this analysis shows inadequate effort allocated to the early (or late) phases when compared to historical profiles for effort, it is a good idea to find out why.
Effort profiles for projects also vary with project size. By mapping the data from a large number of projects with various life cycles into a very simple, generic life cycle, you find a significant trend. The simplified project life cycle in Figure 4-3 is far less detailed than any you are likely to use, but all life cycles and methodologies define phases or stages that map into these three broad categories:
- Thinking—all the initial work on a project, such as planning, analysis, investigation, initial design, proposal generation, specification, and preparation for the business decision to commit to the project.
- Doing—the work that generally defines the project, including development. This is where the team rolls up their sleeves and digs into the creation of the project deliverable.
- Checking—testing the results created by the project, searching for defects in the deliverable(s), correcting problems and omissions, and achieving project closure.
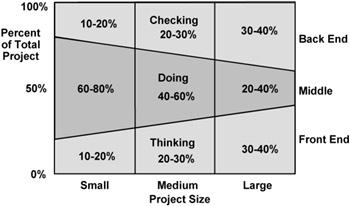
Figure 4-3: Effort by project phase.
As projects increase in size and complexity, the amount of work grows very rapidly. Project effort tends to expand geometrically as projects increase in time, staffing, specifications, or other parameters. In addition to this overall rise in effort, the effort spent in each phase of the project, as a percentage, also shifts. As projects become larger, longer, and more complex, the percentage of total project effort increases for both early front-end project work and for back-end activities at the end of the project. A graphical summary of this, based on data from a wide range of projects, is in Figure 4-3.
In small projects (less than six months, most work done with a small co-located team), people spend nearly all their effort in "doing''—creating the deliverable. For medium projects (six to twelve months long, with more than one team of people contributing), the team might spend about half of its effort in other work. People on projects that are still larger (one year or longer, with several distributed and/or global teams) spend only about a third of the total effort developing project deliverables. This rise in effort both in the early and the late stages of project work stems from the increased amount of information and coordination required and from the significantly larger number of possible failure modes (and, therefore, statistically expected) in these more difficult projects. Fixing defects in complex systems requires a lot of time and effort. The software consultant Fred Brooks (author of The Mythical Man-Month) states that a typical software project is one-third analysis, one-sixth coding, and one-half testing.
All this bears on project risk, and failure-prone projects, for at least two reasons. The first is chronic underestimation of late project effort. If a complex project is planned with the expectation that 10 percent of the effort will be in up-front work, followed by 80 percent in development, the final phase will rarely be the expected 10 percent. It will balloon to another 80 percent (or more). This is a primary cause of the all-too-common "late project work bulge.'' Many entirely possible projects fail to meet their deadline (or fail altogether) due to underinvestment in early analysis and planning.
The second reason that life-cycle norms are valuable is found in the symmetry of Figure 4-3. The total effort required for a project tends to be lower when the initial and final phases of the work are roughly in balance. If the life-cycle norms for typical projects reveal that very little effort is invested up front and a massive (generally unexpected) amount of effort is necessary at the end, then all projects are taking longer and costing more than necessary. Most projects that fail or are late due to end-of-project problems would benefit greatly from additional up-front work and planning.
Applying Estimating Techniques
Figure 4-4 summarizes estimation techniques that are applicable in various situations. For each project activity, either the team has experience or it does not. For the type of work involved, either there are relevant metrics available or there are none.
|
Relevant Metrics Exist |
No Data Available |
|
|---|---|---|
|
Prior Activity Experience |
|
|
|
No Activity Experience |
|
|
Figure 4-4: Estimation techniques.
The worst case is the lower right quadrant: no experience and no data. This case is far from unusual; on technical projects, it may be true for a number of activities you need to estimate. The most frequent methods used for estimating involve some sort of guessing, sometimes with arcane rules, and in this situation a guess may be your only option. You can also consider alternatives such as getting someone who does have experience to consult on your project or even replanning the work to use a different approach to the activity where your team does have experience.
Only slightly better than this is the case where you have no experience but you have found some external information. Estimates based on someone else's measurements are better than nothing, but, unless your project is very similar to the project where the measurements were made, the data may not be very relevant. In either of these cases, when a project activity requires work for which you lack experience, estimation risk is high, and your activity duration estimates belong on the project risk list.
The upper right quadrant is for activities that have been done before but for which no data exist. Although this should not happen, it remains fairly common on technical projects. Thorough analysis and estimating methods such as Delphi may provide adequate estimates, but the results of these processes still contain estimation risk. Over time, more disciplined data collection will help you better manage this risk.
The best case is the upper left quadrant. The existence of both experience and measurements should provide credible, reliable estimates for project activities. Eventually, proactive risk management and disciplined application of other project processes will move many, if not most, activities here, even on high-tech projects.
One other significant source of estimation risk arises from the people who are assigned to do the work. "Good'' estimates need to be believable, which means that they are derived from data and by methods that make sense. This is a good foundation, but even the best estimating techniques are unreliable unless the project team is involved. To be accurate, estimates also must be believed. No matter how many data go into creating estimates, if the people who will do the work have not "bought into'' the estimate, it remains a risk. Good estimates are both believable and believed.
Estimates Adjusted for Uncertainty
All the techniques just discussed generate deterministic, single-point estimates for project activities. This type of estimate implies a precision that is far from reality. To better deal with uncertainty and risk, the Program Evaluation and Review Technique (PERT) methodology was developed during the late 1950s by the U.S. military. PERT uses an estimate range, using three estimates for each activity: an optimistic estimate, a most likely estimate, and a pessimistic estimate. (PERT may also be used for both time and cost analysis. This discussion concerns only time analysis.) These estimates define a distribution of outcomes similar to Figure 4-5, and they can be used to calculate an expected activity duration using the formula:
te = (to + 4tm + tp)/6, where
te is the calculated "expected'' duration—the mean
to is the "optimistic'' duration (the "best case'')
tm is the "most likely'' duration (the peak of the distribution)
tp is the "pessimistic'' duration (the "worst case'')
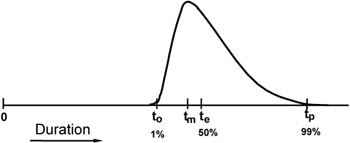
Figure 4-5: Estimates for PERT analysis.
In addition to the "expected'' estimate, PERT also assesses estimation risk quantitatively. For PERT methodology, the range of possible outcomes allows you to calculate the standard deviation for each activity:
One standard deviation = (tp - to)/6
Traditionally, PERT assumed a bell-type distribution that could skew toward either the optimistic or pessimistic estimate, similar to the distribution in Figure 4-5. A Beta distribution was most commonly used, but current PERT implementations can use a wide variety of continuous or discrete distributions to model expectations for estimates.
The theory behind PERT is fine, but in practice PERT analysis has not always proved very useful. The three most common problems people have in using PERT are the time and effort required for the analysis, data quality, and misuse of the data collected.
PERT uses computer simulation and Monte Carlo sampling techniques to assess project schedules, and a common criticism in the 1950s, when computers were much slower, was that a typical project analysis took only a little longer than the project itself. Computers today are more than fast enough to simulate project schedules hundreds, or even thousands, of times to create beautiful histograms, and there are dozens of computer tools available. (Some of the tools are listed in Chapter 9, where PERT is covered in more detail.) While the speed required for simulations is no longer an issue, for some project leaders the time required to collect, enter, and interpret PERT output still may still exceed the apparent value of the results.
And the other two problems persist. The data quality problem results from the difficulty of determining the three estimates with any accuracy. The PERT initially defined "optimistic'' and "pessimistic'' as "1-percent tails,'' requesting people to imagine doing an activity 100 times and setting the range estimates so that only once would the duration fall below the optimistic estimate and only once would it lie above the pessimistic estimate. For most activities, the estimates were unreliable (or, worse, wild guesses), which was reflected in the output. As the saying goes, "Garbage in, garbage out.''
The problem of misusing PERT data is also an ongoing issue, which may be the biggest reason that PERT is not more widely used in technical projects. Many organizations use PERT for a time before they run into this problem. Everything starts out well. Project teams do their best to figure out what the three estimates might be for each activity, using difficult-to-understand definitions involving Beta distributions and 1-percent tails (or 5-or 10-percent tails—there are many variants). PERT analysis of projects proceeds for a while, and some insight into the nondeterministic nature of projects begins to emerge. This continues until some bright midlevel manager starts noticing the optimistic estimates. Because the project teams have admitted that these estimates are not completely impossible, managers begin to insist that schedules be based only on the most aggressive estimates, and these define the project deadlines. The statistical underpinnings of PERT predict that such schedules have essentially no chance of success, and experience invariably proves it. If any interest in PERT remains after all of this, the battered project teams start to use very different definitions for the optimistic estimate in self-defense.
There is a simpler way to apply the concept of PERT to project risk analysis that involves two estimates instead of three— dispensing with the troublesome optimistic estimate. This PERT-like analysis uses the most likely estimate twice, along with the pessimistic estimate, in the PERT formulas. This technique does not cause much distortion, and your initial estimate for each activity will serve as the most likely estimate, so you already have half the data you need.
The PERT formula still requires a pessimistic estimate, and seeking this estimate is an excellent way to identify schedule risk. To collect this data, you do not need to describe complicated scenarios involving doing activities over and over or exotic distributions. Once you have determined the most likely estimate, simply ask, "What might go wrong in this activity that could affect the estimate, and what would the impact be?'' The response will provide two pieces of important project risk data. The amount of impact you estimate may be used to determine the pessimistic estimate for PERT analysis. Even more revealing, the source of the potential slip is a project schedule risk that should be added to your list of identified risks. The use of worst-case estimates in PERT formulas is a fairly good way to determine "expected'' durations, as they will represent a weighted average of the two estimates provided, largely based on the initial estimate but with some adjustment based on the worst case. The inferred distribution is similar to Figure 4-6, where the optimistic and most likely estimates are assumed to be equal, and the formula for expected duration becomes te = (5tm + tp)/6.
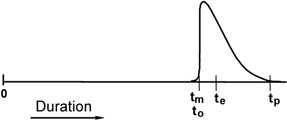
Figure 4-6: "PERT''-like estimating.
While PERT techniques may be used for estimating activities, PERT analysis was created primarily as a tool for project risk assessment. This use of PERT and PERT tools is explored in Chapter 9.
Activity Sequencing
Additional scheduling risks become visible as you develop your project schedule by combining sequencing information with the activity estimates. Activity sequencing requires you to determine the dependencies for each project activity, and these linkages reveal many potential sources of project delay. Delay risks are responsible for most of the scheduling risks in the PERIL database.
One effective method for minimizing schedule risk related to sequencing is to break long, complex projects into a series of much shorter ones. This principle is fundamental to evolutionary, or cyclic, software development methodologies. If the cycles are sufficiently short—two to four weeks are a common cycle in methodologies such as XP—the dependencies either become irrelevant or are sufficiently simple that managing them is trivial. For the most part, XP ignores dependencies except as special cases within each iteration. The same principle applies generally; the shorter the overall arc of a project is, the fewer complications and risks there will be due to dependencies.
In more complex projects, there are many possible types of dependencies that may connect project activities, but most are linked by finish-to-start relationships—once one activity or a collection of activities is complete, other project activities can begin. Occasionally, some activities might need to be synchronized by either starting or finishing at the same time, and the logic of project work may also depend on interruptions and lags of various kinds. Although project plans may include some of these more exotic dependencies, the majority of the dependencies in a typical project network are finish-to-start linkages, and it is these sequential-activity dependencies that are most likely to cause delay risk. In addition to revealing these potential schedule risks, logical project networks also provide the foundation of both critical path and PERT analysis (which is why project activity networks are often referred to as PERT charts).
Project dependencies are a significant source of schedule risks, and discovering them requires construction of a logical network for your project that has no gaps. Define the logical flow of work for your project so that all project activities, without exception, have a continuous path backward to your initial project milestone and a continuous path forward the final project deadline. Determine both predecessors and successors for every activity (and milestone) in your project, and inspect the resulting network for missing linkages and logical problems. Project analysis and risk identification will be incomplete (and possibly worthless) if you leave any gaps or dangling connections. For project planning using a computer tool, you should never use features such as "must start on'' and "must end on'' pegged-date logic. The software will generate a Gantt chart that looks a lot like a project plan, but you will not be able to perform schedule analysis, do proper project tracking, or effectively identify schedule risk.
Critical Path Methodology
Critical path methodology (CPM) analysis combines activity estimates with dependency information and calculates the duration for the project on the basis of these data. CPM also identifies schedule risks. You can do this analysis manually for small projects, but CPM calculations for larger networks of activities are extremely tedious. Fortunately, CPM has been automated in computer scheduling tools. Once all your activities, duration estimates, and dependencies are entered into the database of a scheduling tool, the software evaluates the resulting project network and locates the sequence (or sequences) of project activities with the longest total duration. All activities that make up the longest sequence are flagged as "critical,'' and the entire flow of work from the initial milestone to the project deadline is defined as a project critical path. Computer tools helpfully color all the critical activities an appropriately scary red color. Each of these red activities carries schedule risk, because if one is not completed within the time estimated for it, everything that follows it in the project can also be expected to slip, including the project deadline.
CPM also provides information on activities on "noncritical'' paths, because the calculations used to find the critical activities determine the earliest and latest schedules for every activity in the project. The difference between the late and the early schedules for an activity is labeled "float'' or "slack,'' and it represents one type of risk associated with each activity. If float is zero (or, even worse, negative—indicating the project must be completed by a date that is earlier than the current plan shows is possible), the activity is risky, colored red, and on a critical path. If float is small—a day or two—the activity is also risky, as it would take only a small slip to make the activity critical. Even project activities that have a large amount of float can be risky if their worst-case estimates exceed the calculated float.
Using computer scheduling tools, it is easy to do "what if'' scenarios to identify the activities that represent schedule risk in addition to those on the project critical path. The first step is to make a copy of the database for the project (so that you can manipulate the copy and leave your initial data intact). You can then begin editing the database copy to locate other risks. You can delete all the critical activities in your project (relinking any resulting broken dependencies as you go) to see what the project looks like without them. All activities that are critical in this analysis are also potential schedule risks, especially if the resulting schedule is not significantly shorter than the one you started with. Repeating this analysis by deleting the resulting critical activities through multiple levels may be necessary to identify the riskiest activities on complex projects.
A second way to use a copy of the database to identify schedule risk involves replacing your initial estimates with worst-case estimates to see how these changes will impact the overall schedule. When you do this one activity at a time, you discover how sensitive the overall project is to each individual problem. If you enter all of your worst-case estimates, you get a version of the plan that shows a far longer schedule than is probable, but the end point displays just how bad things might get if everything goes wrong. (And, remember, your analysis is based on only known risks; if there are significant unknown project risks, even your worst-case schedule might be optimistic.)
In reality, every activity in the project represents at least a small level of schedule risk. Any piece of work in the plan could be the one that causes a project to fail. CPM and related calculations can be used to prioritize the schedule risks to determine which activities have risks that are sufficiently significant to add to your risk list.
Multiple Critical Paths
Projects can and often do have more than one critical path. Parallel sequences of activities that are equal in duration to the project are all critical, and when this happens, it increases schedule risk even more. If all the estimates used in a project schedule are assumed to be "expected'' durations calculated with the weighted-average PERT formula described earlier, the chance of an activity's finishing early (or on time) is the same as the chance of the activity's finishing late. In a project with one critical path, the project as a whole has the same probabilities—50/50. (This assumes that all events and activities are independent—more on this later.) What about the project in Figure 4-7 with two critical paths?
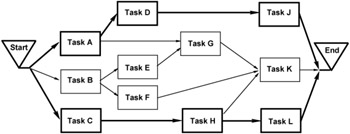
Figure 4-7: Project with two critical paths.
Both paths "A-D-J'' and "C-H-L'' are critical, and all activities are estimated using "expected'' (50 percent) estimates. The expectation for each path is therefore also 50 percent, so each of the two paths is expected to either meet or beat the project estimate half of the time (the infinitesimal probability associated with "exactly on time'' is included with "early'') and to be late the other half of the time. If the two paths are assumed to be independent, the matrix in Figure 4-8 shows the probabilities for each possible outcome. The project has only one chance in four of finishing early or on time, the same probability as flipping two coins and getting "heads'' twice.
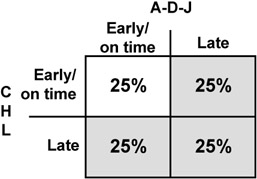
Figure 4-8: Result matrix for project.
Only when both paths complete early or on time will the project complete on time, and three times in four—75 percent of the time—the project will be late. If there are more than two critical paths, the situation gets even worse. With three critical paths, the chances fall to one in eight, and the fraction shrinks by a factor of two with each additional critical path. The more potential failure modes there are, the more likely it is that the project will be late.
Although this picture is bleak, most real technical projects face even larger risks. Few projects are planned using estimates that are equally likely to be slightly early or slightly late. Aggressive estimates are common on technical projects for all the reasons discussed earlier in the chapter, including overconfidence, lack of experience, and political pressure. If the estimates are actually 10 percent likely to be early or on time and 90 percent likely to be late, a matrix similar to Figure 4-8 for two critical paths will calculate only one chance of success in one hundred.
In addition, this analysis assumes statistical independence of all events. The assumption of independence may be valid for some work on projects, but on real projects, all the work is done by a small team of people who have complicated relationships with one another. Assuming that the outcome of one activity will have no effect on succeeding activities is unrealistic. Project problems tend to cascade, and correlation between project activities further decreases the overall likelihood of success. The upshot of all this is that schedule risk increases very significantly when there are multiple parallel possibilities for project slippage.
Scheduling Risky Work
The timing of activities may also increase project risk. Whenever an activity has high uncertainty, it is human nature to schedule it to start late in the project. If an activity requires the invention of something new, or the specifics of the work are far from obvious, you may be tempted to defer the work until later in the project, reasoning that the delay might give you a chance to figure it out. Also, scheduling risky work toward the end of your project will allow you to write at least a few weekly status reports that are not filled with bad news associated with the more problematic activities.
Tempting though this is, don't do it. Deferring riskier activities until late in the project can lead to increases in both project risk and cost. By scheduling risky activities earlier, you can learn faster, and frequently with less effort, whether there are any "show-stoppers''—activities that make your whole project impossible. When you discover the problems earlier, project decision makers have more options, including shifting the objective, using the time still available to seek alternate ways to proceed with the project, or even abandoning the work altogether. If a risky activity is left until late in the project, it may be impossible or very costly to shift the objective, and there will be little or no time left to find another approach. Perhaps the worst case of all is to discover that the project is not feasible and to cancel it after having spent months (or even years) of money and effort. When risky work is scheduled earlier, a decision to cancel can be made after only a small portion of the project budget has been spent, instead of nearly all of it. In addition to being a waste of money, late cancellation is very demotivating for the project team and will make it difficult to find enthusiastic staff for future projects.
Schedule Path Convergence
Another project exposure is "fan-in.'' Most of the time, the places in a project network that have the largest number of predecessor dependencies are milestones, but any point of convergence in a project network represents schedule risk. Since project work stops at a milestone or activity whenever any of the preceding activities are incomplete, each additional path in the fan-in represents a possible failure mode, and it increases the probability of delay. Milestones, phase exits, stage gates, and other life-cycle check-points are often held up in large programs by a single missing requirement; even when all the other work is satisfactorily completed, the work halts to wait for the final dependency.
The largest fan-in exposure for many projects is the final milestone, which usually has a large number of predecessor activities. Even in the very simple project network in Figure 4-7, there are three predecessor dependencies for the finish milestone.
Interfaces
Dependency risks outside the project are also substantially represented in the PERIL database. Dependencies of all kinds may represent schedule risks, but interfaces—dependencies that connect one or more projects—are particularly problematic; the impact of these risks was the highest for all schedule risks in the PERIL database, averaging more than five weeks per project. Connections between projects are most common for projects that are part of a larger program. As each project team plans its work, dependencies on other projects arise. Dependencies that are wholly within a project carry schedule risk, but interfaces are even riskier. For an interface, each project contains only half of the linkage, the predecessor or the successor. The deliverables can be components, services, information, software, or almost anything that one project creates that is required by another project team. The project that expects to receive the deliverable potentially faces both schedule and scope risk. If the hand-off is late, the dependent project may slip. Even when it is on time, if the deliverable is not acceptable, the project (and the whole program) may be in trouble. Interfaces are particularly important to identify and manage because of the limited visibility of progress in the project responsible for the deliverable.
An interface between projects is depicted graphically in Figure 4-9. The interface is partly in each project and partly in "no man's land.'' In analyzing these interproject linkages, the terminology of producers and consumers is useful. For linkages that terminate in your project, you are a consumer. For linkages that start in your project, you are the producer.
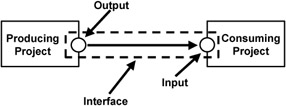
Figure 4-9: Interface connecting two projects.
Interfaces are usually first identified by the consumer project, as part of the planning process. Inputs from other projects that may stop or slow your project represent the greatest risks. It is also useful to start a list of activity outputs within your plan that you expect to provide to other projects.
Interface management depends on collecting information in writing on the interfaces—the inputs and the outputs—among all projects in the overall program. Project inputs are generally collected first, as they are the easiest to identify. For the whole program, each input must be matched with a corresponding output. For any required input with no identified output, you must either identify an appropriate producer project or change the scope of the consumer project(s) to resolve the need internally.
The interface planning process seeks agreement and commitments consistent with the overall program plan. The program manager coordinates reconciliation, resolves conflicts, finds owners for outputs not claimed, and eliminates activities that create outputs that are not used. As the process proceeds, the projects involved align both the timing and the specifications of the interfaces. Interfaces are best managed with formality—by treating each agreement as a contract. Even for interfaces entirely within the same organization, you should get written agreement between the producer and the consumer(s).
Even when interfaces are documented and well managed, they are risky. Add each project interface where your project is the consumer to your list of project risks.
Planning Horizon
Yet another source of schedule risk relates to the length of the schedule. When you drive an automobile at night on a dark road with no illumination other than your headlights, you can only see a limited distance ahead. The reach of the headlights is several hundred meters, so you must stay alert and frequently reexamine the road ahead to see new things as they come into view.
Similarly, projects have a limited distance of visibility. Projects vary a good deal in how much accurate planning is possible, but all projects have a limit. For some projects, planning even three months in advance is difficult. For others, the planning horizon might be longer, but technical project planning is rarely accurate for work more than six to nine months in the future. The uncertainty inherent in work planned more than a few months in the future is a source of significant schedule risk on any lengthy project. Make specific note of any unusual, novel, or unstaffed activities more than three months into the project. On a regular basis, include explicit activities in the project plan to review estimates, risks, assumptions, and other project data. Risk management relies on periodic recommendations for project plan adjustments based on the results of these reviews.
Project reviews are most useful at natural project transitions: the end of a life-cycle phase, a major milestone or check-point, a significant change to the project objective, whenever key contributors leave or are added to the project team, or following business reorganizations. At a minimum, schedule reviews for longer projects at least every three to six months. A process for project review is detailed in Chapter 11.
Document the Risks
Schedule risks become visible throughout the planning and scheduling processes. The specific instances discussed in this chapter are all project risks:
- Long-duration activities
- Significant worst-case (or pessimistic "PERT'') estimates
- High-uncertainty estimates
- Overly optimistic estimates
- All critical path (and near-critical path) activities
- Multiple critical paths
- Convergence points in the logical network
- External dependencies and interfaces
- Deadlines further out than the planning horizon
- Cross-functional and subcontracted work
Augment the list of project scope risks, adding each schedule risk identified with a clear description of the risk situation. The list of risks continues to expand throughout the project planning process and serves as the foundation for project risk analysis and management.
Key Ideas for Identifying Schedule Risks
- Determine the root causes of all uncertain estimates.
- Identify all estimates not based on historical data.
- Note dependencies that pose delay risks, including all interfaces.
- Find any differences between project effort requirements and life-cycle norms.
- Identify risky activities and schedule them early in the project.
- Ascertain risks associated with multiple critical (or near-critical) paths.
- Note risks associated with lengthy projects.
Panama Canal Planning (1905 1907)
Early in his work in Panama, John Stevens spent virtually all of his time among the workers, asking questions. His single-minded pursuit was planning the project well and thoroughly. Stevens put all he learned into the plans, setting the foundation required to get the project moving forward.
The primary tool for construction was one Stevens was very familiar with: the railroad. He recognized that digging enormous trenches was only part of the job. Excavated soil had to be moved out of the cut in central Panama where someday ships would pass, and it had to be deposited near the coasts to construct the required massive earthen dams. In the rain forests of Panama at the turn of the twentieth century, the railroad was not only the best way to do this; it was also the only practical way. Much of the planning that Stevens did centered on using the railroad, and, by early in 1906, he had documented exactly how this was to be done. When excavation resumed, his elaborate, "ingeniously elastic'' use of the railroad enabled work to progress at a vigorous pace, and it continued virtually nonstop through project completion.
Once Stevens had broken the work down into smaller, easily understood activities, the canal project began to look possible. Each part of the job was now understood to be something that had been done, somewhere, before. It became a matter of getting it all done, one activity at a time.
For all his talents and capabilities, John Stevens never considered himself fully qualified to manage the entire project. His experience was with surveying and building railroads. The canal project involved building massive concrete locks (like enormous bathtubs with doors on each end) that would raise ships nearly thirty meters from sea level and then lower them back again— twelve structures in all. The project also required a great deal of knowledge of hydraulics; moving enormous amounts of water quickly was essential to efficient canal operation. Stevens had no experience with either of these types of engineering. These gaps in his background, coupled with his dislike of the hot, humid climate and the omnipresent (and still dangerous) insects, led him to resign as chief engineer after two years, in 1907.
This did not sit well with Theodore Roosevelt. Losing such a competent project leader was a huge risk to the schedule. Both of his project leaders had resigned before completing his most important project, and Roosevelt was determined that this would not happen again. To replace John Stevens, Roosevelt selected George Washington Goethals, an immensely qualified engineer. Goethals had been seriously considered for the job twice previously and was ideally qualified to build the Panama Canal. He had completed a number of similar, smaller projects, and he had a great deal of experience with nearly all the work required at Panama.
Theodore Roosevelt wanted more than competence, however. For this project, he wanted "men who will stay on the job until I get tired of having them there, or until I say they may abandon it.'' His new chief engineer and project leader could not resign; George Goethals was a major (soon to be lieutenant colonel) in the U.S. Army Corps of Engineers. If Goethals tried to resign, he could be court-martialed and sent to jail.
Introduction
- Why Project Risk Management?
- Planning for Risk Management
- Identifying Project Scope Risk
- Identifying Project Schedule Risk
- Identifying Project Resource Risk
- Managing Project Constraints and Documenting Risks
- Quantifying and Analyzing Activity Risks
- Managing Activity Risks
- Quantifying and Analyzing Project Risk
- Managing Project Risk
- Monitoring and Controlling Risky Projects
- Closing Projects
- Conclusion
- Appendix A Selected Detail From the PERIL Database
EAN: 2147483647
Pages: 130
