Optimizing: Reducing Parses
Optimizing Reducing Parses
Overview
Reducing parses can be an important part of optimizing the use of database resources and, hence, the reporting environment. Developers, including report developers, can reduce parses with little or no help from the DBA because parse reduction is almost entirely dependent on the way in which queries are constructed. The DBA may point out queries that appear to be causing memory or scalability problems, but modifying those queries, or optimizing them in the first place, is the job of the developer.
Reducing parses is especially important when optimizing transaction processing systems. Typically, in a transaction processing system, there will be many queries that return little or no data, so the proportion of time spent parsing to the time spent fetching can be significant.
In a reporting environment, each query usually returns a large amount of data so the proportion of the parsing time to the total processing time is smaller, and perhaps, in some cases, insignificant. However, it does not change the fact that each parsed cursor requires memory and uses CPU resources. A more important benefit may be the increased scalability made possible by reducing memory use in the shared pool and reducing CPU usage for parsing, rather than speed enhancement for any particular query.
Description of Parsing
SQL statements issued against an Oracle database are parsed and stored in a global memory area called the library cache, which is a component of the shared pool. Parsing is the operation of converting SQL text to an executable version and involves allocation of memory, validation of the SQL statement, and the creation of an execution plan. Parsing does not include actually getting the data and returning it.
Parsing consists of several steps: syntax checking, semantic analysis, check for existence in the shared pool, optimization, and plan generation. Only after the syntax checking and semantic analysis steps can a check be made to see if the SQL statement already exists in the shared pool. At that point, the statement has been checked for syntactic correctness and had any unqualified references resolved. A hard parse occurs when no match is found in the shared pool considering both the text of the statement and any environment settings that affect execution plans. In that case, the final two steps must occur. The statement must be optimized and a new plan will be generated for it. A soft parse is said to occur when the final two steps are not required.
SQL statements are maintained in the shared pool using a least recently used algorithm so they will age out over time. SQL statements stored in the shared pool can be shared by many users and across sessions. Assuming that the CURSOR_ SHARING parameter is set to its default of EXACT, to be considered identical, two statements must contain exactly the same text, character for character, including spaces, case, and comments. In addition, the environment of the sessions issuing the statements must be the same. For example, if one session is using the cost-based optimizer, so must the other session. In addition, if the objects in the statements are not explicitly qualified with a schema name, they must refer to an object in the same schema. If the SQL statements contain bind variables, the bind variables must have the same names, datatypes, and lengths.
Reducing Hard Parsing
The reduction of hard parsing is accomplished by making changes that will increase the number of reusable statements. You can do this by implementing bind variables or modifying instance parameters.
Looking at Oracle s V$SQL Dynamic Performance View
Oracle has a built-in view called V$SQL. This view contains each of the SQL statements that are currently in the library cache and includes statistics on the number of executions and parses of each SQL statement.
A very simple report, Supplier.rpt, is available for download in the Chapter 8 files. It uses the Suppliers table and has one parameter for inputting the desired supplier. The SQL query that Crystal Reports sends to Oracle is shown here if this report is run for supplier number 2:
SELECT "SUPPLIER"."SUPPLIER_ID", "SUPPLIER"."SUPPLIER_NAME",
 "SUPPLIER"."COUNTRY", "SUPPLIER"."PHONE"
 FROM "XTREME"."SUPPLIER" "SUPPLIER"
 WHERE "SUPPLIER"."SUPPLIER_ID"=2
Another report is included called Chapter 8Show_SQL_Stats.rpt. (Use Show_ SQL_Stats_8i.rpt for Oracle 8i.) Show_SQL_Stats takes a SQL statement (or the initial part of a SQL statement) and displays the V$SQL statistics for that statement. In order to run Show_SQL_Stats, you must have the SELECT privilege on the V$SQL dynamic performance view. Since V$SQL is a synonym, to grant access to it, you must grant access to the actual table name (which is V_$SQL) as follows:
GRAND SELECT ON V_$SQL TO xtreme;
Run the Supplier report several times. Use the same parameter value a few times and also several different parameter values. On the last run, choose Database | Show SQL Query and copy the text, up to the equal sign, to the clipboard. Then run the Show_SQL_Stats report, pasting the previously saved SQL statement into the parameter prompt. The resulting report will look something like Figure 8-1.
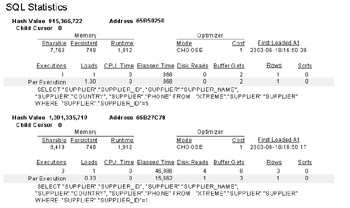
Figure 8-1: Example SQL stats results
Crystal Parameters and Parsing
Note that the Show_SQL_Stats report will show a different hash value for each different parameter value that was supplied for the Supplier report. This tells you that Oracle considers the query for Supplier=5 to be a completely different query than the one for Supplier=1, which results in a new hard parse for each value sent from Crystal Reports. Each query consumes memory.
The first detail line in the Show_SQL_Stats report displays the memory usage and optimizer values for the query. The second detail line displays the totals for a particular query. It shows the number of times the query was executed, total CPU time, elapsed time, disk reads, buffer gets, and rows processed. The third detail line, starting with Per Execution, computes the average values for each of those variables per execution. The first execution for any query will include the hard parse and hence will consume more CPU time, and other resources, than subsequent executions. Other variations in the statistics can be due to other conditions on the database. For example, the data required for the query may or may not be in the buffer cache.
| Note |
The CPU_Time and Elapsed_Time fields in V$SQL did not exist prior to Oracle 9i, and are therefore omitted from the 8i version of the report. |
The Loads column shows the number of times the query was loaded, or parsed. This number will increment only when Oracle needs to reparse the query. It might need to reparse if the query has been aged out of the library cache, the library cache has been cleared for some other reason, or a session parameter that affects the execution plan has been changed.
Subreport for SQL Statistics
The Show_SQL_Stats report is useful but somewhat awkward to use because you must paste or type in a very long string containing the SQL text of a query that has been executed previously. It would be convenient if the SQL statistics could be generated directly in the report in question as a subreport, without requiring any parameter from the user. You cannot insert the existing Show_SQL_Stats report as a subreport into the Supplier report, however, because that would require linking on the SQL query text, which is not possible in Crystal Reports. This means that another method to tie the main report query to the SQL statistics query must be implemented.
The V$Session dynamic performance view contains information about the current session, including the hash value of the query currently being executed and the hash value of the previously executed statement. If you link V$Session to V$SQL, you can determine which SQL query is being executed by which session. Then the only missing piece is determining the session ID of the main report.
| Note |
Much of the following discussion is identical to that covered in Chapter 7 regarding the linking of the execution plan subreport. |
The Oracle function USERENV(SessionID) will return the audit session ID for the current session and can be used to link the main report to the SQL statistics subreport. Note that Crystal will execute the main report first and then any subreports. Because the query backing the main report is finished before the query for the subreport is run, the main report session will have no currently executing SQL during subreport execution, its SQL_Hash_Value will be 0, its session will be INACTIVE, and its Prev_Hash_Value will contain the hash value for the main report’s query. This allows you to use the Prev_Hash_Value to link V$Session to V$SQL.
However, there is another complication. If you use the same database connection to log in to the subreport that you used for the main report, the main report and the subreport will be using the same database session. Then, running the subreport, as with the main report, will complete its query execution, leaving the SQL_Hash_Value 0. The session will be INACTIVE, and the Prev_Hash_Value will be the hash value of the query connected to the subreport, not the query connected to the main report.
To address this problem, you will have to ensure that the main report and the subreport use different sessions. Using more than one session per report should be avoided in most circumstances, but this situation is an exception and these guidelines should be used only during the development or optimization phases.
As we already discussed in Chapter 7, Crystal Reports will not allow more than one login to the same data source. However, convincing Crystal that two data sources are different is easy. If you are using ODBC, simply create two ODBC Data Source Names that point to the same database. If you are using the native driver, remember that you must create two TNS names that point to the same database. Here is an extract from a TNSNames.ora file showing two TNS names that point to the same database:
ORA.HOME =
 (DESCRIPTION =
 (ADDRESS_LIST =
 (ADDRESS = (PROTOCOL = TCP)(HOST = server)(PORT = 1521))
 )
 (CONNECT_DATA =
 (SERVICE_NAME = ORA.HOME)
 )
 )


ORA2.HOME =
 (DESCRIPTION =
 (ADDRESS_LIST =
 (ADDRESS = (PROTOCOL = TCP)(HOST = server)(PORT = 1521))
 )
 (CONNECT_DATA =
 (SERVICE_NAME = ORA.HOME)
 )
 )
Of course, you could also use a native connection for the main report and an ODBC connection for the subreport, or some other combination, to ensure two sessions.
Now you can modify the Show_SQL_Stats report so that it can be used as a subreport. Save Show_SQL_Stats as Show_SQL_Stats_Subreport. In order to run the new subreport, you must have the SELECT privilege on the V$SESSION dynamic performance view. Because V$SESSION is a synonym, to grant access to V$SESSION, you must grant access to the actual table name, V_$SESSION, as follows:
GRANT SELECT ON V_$SESSION TO xtreme;
Go to the Database Expert and add the V$Session dynamic performance view— you will find it in the PUBLIC folder if you have enabled Synonyms. Link from the Prev_SQL_Addr in V_Session to Address in V_SQL, and from Prev_Hash_Value in V_Session to Hash_Value in V_SQL, as shown in Figure 8-2.
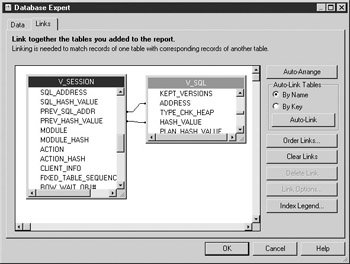
Figure 8-2: Linking V$Session to V$SQL
Modify the report to use whichever secondary data source you want to use, using the Database | Set Datasource Location dialog (this will prevent problems when adding this subreport to other reports). Remove the existing Selection formula that is dependent on the SQL text parameter. Delete the {?SQL Text} parameter and add a parameter for the audit ID, as shown in Figure 8-3.
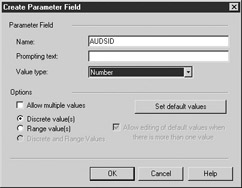
Figure 8-3: AUDSID parameter
Add a selection formula that uses the audit ID parameter, as shown in Figure 8-4.
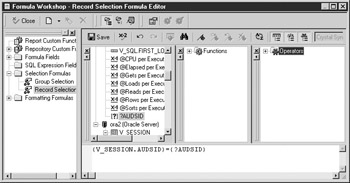
Figure 8-4: AUDSID selection formula
Add some of the V$Session fields to the report, if desired, as shown in Figure 8-5.
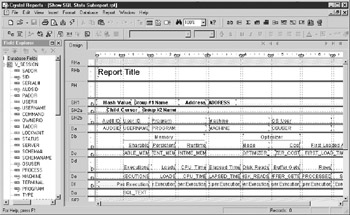
Figure 8-5: Add V$Session fields
Save the report. This completed report is available for download as Chapter 8Show SQL Stats Subreport.rpt and Chapter 8Show SQL Stats Subreport 8i.rpt for Oracle 8i.
Open the Supplier report and create a SQL Expression field called AUDSID with the following definition:
USERENV('SESSIONID')
Insert a subreport. Select Choose a Report and browse to the location of Show SQL Stats Subreport (or Show SQL Stats Subreport 8i). On the Link tab, choose the main report’s SQL Expression field, %AUDSID, as the field to link to. Choose the subreport’s parameter field, ?AUDSID from the Subreport Parameter Field To Use list (see Figure 8-6).
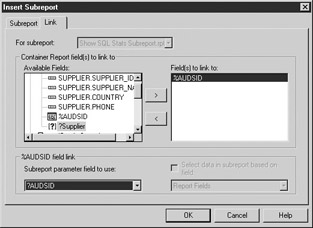
Figure 8-6: Linking the SQL stats subreport
Place the subreport in the report footer section of the main report. Right-click the subreport and choose Format Subreport. On the Subreport tab, set the Subreport Name to SQL Statistics, as shown in Figure 8-7. This completed report is available as Chapter 8Supplier with Statistics.rpt or Chapter 8Supplier with Statistics 8i.rpt.
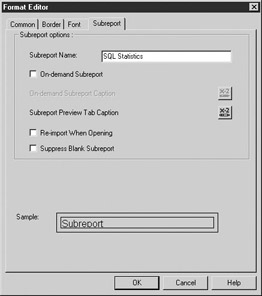
Figure 8-7: Set subreport name
Run the report. The SQL Statistics data should appear as shown in Figure 8-8.
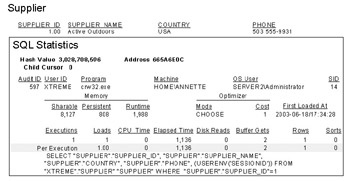
Figure 8-8: Supplier with SQL stats subreport
Now you have a subreport that can be added to any report you like, if you need to see the report’s SQL statistics. The only modification required to the main report is the addition of the SQL Expression field %AUDSID that contains the audit session ID needed for linking.
Oracle Bind Variables
One of Oracle’s recommendations for parse reduction is to use bind variables. Bind variables replace the literal values that change from query to query. In the example, you would send your Supplier query to Oracle with a bind variable such as in the following:
SELECT "SUPPLIER"."SUPPLIER_ID", "SUPPLIER"."SUPPLIER_NAME",
 "SUPPLIER"."COUNTRY", "SUPPLIER"."PHONE"
 FROM "XTREME"."SUPPLIER" "SUPPLIER"
 WHERE "SUPPLIER"."SUPPLIER_ID"= :Supp
If you could do this, Oracle will consider the SQL statement to be the same, no matter what value was entered for the :Supp bind variable.
Note that there is a possible tradeoff to the benefits of using bind variables: the cost-based optimizer can make better decisions about how to access the required data if it knows the actual value. For instance, say that a table has 100,000 rows. The value of a field called Country is “USA” for 90,000 rows, and “CAN” for 5 rows, and there is an index on Country. If a query containing WHERE country=“USA” were submitted, the cost-based optimizer would generate an execution plan using a full table scan. If a query containing WHERE country=“CAN” were submitted, then the cost-based optimizer would generate an execution plan using the index on Country. In Oracle 9i, if a query with a bind variable for Country is submitted, the cost-based optimizer will peek at the value of the bind variable on the first execution and choose an execution plan appropriate for that value. It will then use that execution plan, no matter what future values the bind variable takes on. In Oracle 8i, the optimizer will assume a level distribution of values. When attempting to optimize or reduce parsing, you should consider the expense of skewness in selection columns in relation to the expense of reparsing.
Skewness and selectivity are both measures of data variation in a field. Selectivity is a measure of the number of different values that a field might contain. In the example discussed, the selectivity is at least 3/100,000 given that there are at least three different values for Country; “USA”, “CAN”, and something else. Selectivity gives no information about the distribution of the different values, only the count of the different values over the total. If each of the different values showed up an equal number of times, then the field would not be skewed, which is what the 8i optimizer assumes. If one value showed up a much larger number of times than another value, then the field would be skewed to that value. That skewness is what causes the problem when using bind variables because it indicates different access methods for values that show up in a large portion of the rows (full table scan), versus values that show up in only a small portion of the rows (use index).
SQL Commands and Parsing
Do Crystal Reports parameterized SQL Commands create queries with bind variables? No. Unfortunately, creating a SQL Command with parameters does not generate a query with Oracle bind variables and therefore does not help with reparsing. You can verify this by creating such a SQL Command and using the SQL Statistics subreport.
Create a new report with a SQL Command like the following, including the Supplier ID parameter:
SELECT "SUPPLIER"."SUPPLIER_ID", "SUPPLIER"."SUPPLIER_NAME",
 "SUPPLIER"."COUNTRY", "SUPPLIER"."PHONE",
 (USERENV('SESSIONID')) AUDSID
 FROM "XTREME"."SUPPLIER" "SUPPLIER"
 WHERE "SUPPLIER"."SUPPLIER_ID"={?Supplier ID}
Place the Supplier_ID, Supplier_Name, Supplier.Country, and Supplier.Phone on the report. Add the SQL Statistics subreport, linking it on Supplier.AUDSID, and run the report.
In Figure 8-9 you will see that even though the report is based on a parameterized SQL Command, the query being sent to Oracle by Crystal Reports still has the literal value for the parameter embedded in it. Running the report with different Supplier_IDs will show different hash values and therefore different SQL statements that each requires parsing. This report is available for download as Chapter 8Supplier SQL Command with Statistics.rpt or Chapter 8Supplier SQL Command with Statistics 8i.rpt.
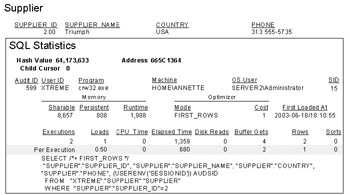
Figure 8-9: Supplier with SQL Command
Stored Procedures and Parsing
To investigate parsing and stored procedures, create the following stored procedure:
CREATE OR REPLACE PACKAGE "XTREME"."SUPPLIER_RPTS" AS


TYPE Supp_Rpt_Rec_Type IS RECORD
 (Supplier_ID Supplier.Supplier_ID%TYPE,
 Supplier_Name Supplier.Supplier_Name%Type,
 Country Supplier.Country%Type,
 Phone Supplier.Phone%Type,
 AUSID number);


TYPE Supp_Rpt_Type IS REF CURSOR RETURN Supp_Rpt_Rec_Type;


PROCEDURE Supplier_Report
 (Supp_Rpt_Cur IN OUT Supp_Rpt_Type,
 Supplier IN Supplier.Supplier_Id%TYPE);

END SUPPLIER_RPTS;
/
CREATE OR REPLACE PACKAGE BODY "XTREME"."SUPPLIER_RPTS" AS


PROCEDURE Supplier_Report
 (Supp_Rpt_Cur IN OUT Supp_Rpt_Type,
 Supplier IN Supplier.Supplier_Id%TYPE)
IS
 BEGIN
 Open Supp_Rpt_Cur for
 Select Supplier_ID, Supplier_Name,
 Country, Phone, userenv('sessionid') AUDSID
 from Supplier
 where Supplier_ID=Supplier;
 END Supplier_Report;


END SUPPLIER_RPTS;
Now create a report based on this stored procedure, add the Show_SQL_Stats_ Subreport, and link it to the AUDSID. Run the report.
No data shows up in the subreport. This is because, due to the manner in which the stored procedure is executed, the hash value for the main report query is still stored in the SQL_Hash_Value and has not been moved to the Prev_Hash_Value. Modify the links in the subreport to use SQL_Address and SQL_Hash_Value instead of Prev_SQL_Addr and Prev_Hash_Value (see Figure 8-10).
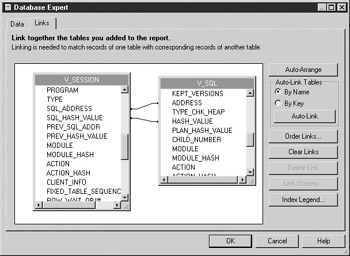
Figure 8-10: Subreport links for stored procedure
Refresh the report and the SQL Statistics will be populated, as shown in Figure 8-11. Note that the SQL text now contains a bind variable. Run the report with different Supplier IDs. You will see that the SQL statement does not change, so no reparsing is required. Using stored procedures guarantees that no reparsing is required due to changing parameter values. This report is available as Chapter 8Supplier Stored Procedure with Statistics.rpt or Chapter 8Supplier Stored Procedure with Statistics 8i.rpt.
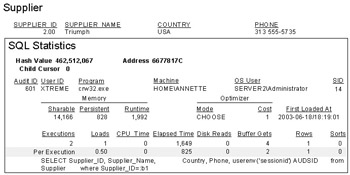
Figure 8-11: Stored procedure SQL stats
CURSOR_SHARING=FORCE
Prior to Oracle 9i, the initialization parameter CURSOR_SHARING could be set to EXACT or FORCE. EXACT was and still is the default value; it ensures that cursors will not be shared unless the SQL text is identical, as described in earlier sections. Setting CURSOR_SHARING to FORCE ensures that cursors will be shared if they differ only in the value of literals that could be replaced with bind variables.
To see the results of setting CURSOR_SHARING equal to FORCE, set CURSOR_ SHARING as shown. You must have ALTER SYSTEM privileges to change environment settings.
ALTER SYSTEM SET CURSOR_SHARING=FORCE;
Run the Supplier with Statistics or Supplier with Statistics 8i report twice; first with Supplier=1, then with Supplier=2. After the second run, you should see something like Figure 8-12. Notice that the literals in the SQL text have been replaced with system-generated bind variables. On the second execution, Oracle recognized that the second query was identical to the first query except for literals, so the parser replaced these literals with bind variables and parsed the new query. At this point, both queries have been hard parsed, so no reparsing resources have been saved.
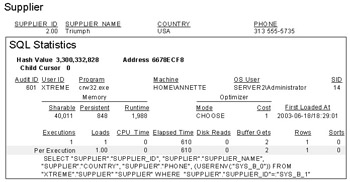
Figure 8-12: Supplier report results 1
Now run the report with Supplier=3. Notice, as shown in Figure 8-13, that the query has not changed and the execution count has increased. On each subsequent query execution, no reparsing will be required.
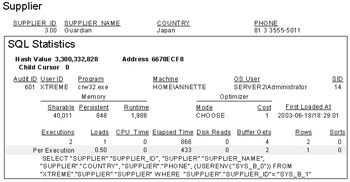
Figure 8-13: Supplier report results 2
Setting CURSOR_SHARING=FORCE seems like a good option for reporting environments where many reports are run that differ only in the parameter value chosen. However, there is one downside to this option.
To help you investigate, we have created a second subreport as described in Chapter 7. This subreport, called Show SQL Plan Subreport.rpt, shows the execution plan for the main report query. To run it, you must be using Oracle 9i and have the SELECT privilege on the V$SQL_PLAN dynamic performance view:
GRANT SELECT ON V_$SQL_PLAN TO xtreme;
First, set CURSOR_SHARING back to EXACT:
ALTER SYSTEM SET CURSOR_SHARING=EXACT;
If statistics have not been gathered, as shown in Chapter 7, do so now. Then open the Orders report (or Orders 8i), and run it for Shipped=1. Scroll to the end of the report, as shown in Figure 8-14.
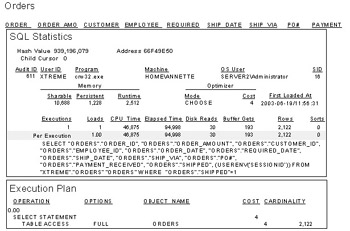
Figure 8-14: Orders report results 1
Notice that the execution plan includes a full table scan of the orders table. (The execution plan subreport is not available in the 8i version.)
Now run the report again for Shipped=0. Your results should look similar to Figure 8-15. Notice that the execution plan shows table access by an index.
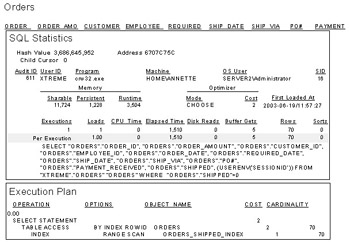
Figure 8-15: Orders report results 2
The two different parameter values generate two different execution plans because of the skewness of the Shipped column data. There are 2,192 total rows in the Orders table. Of those 2,192 rows, only 70 contain a 0, or Not Shipped, value in the Shipped column; the other 2,122 rows contain a 1, or Shipped, value. Thus, it is more efficient to use a full table scan when the query is going to return a large portion of the rows and more efficient to use an index when the query is going to return a small portion of the rows.
Note that the cost-based optimizer can only make decisions based on the skewness of column data if histograms have been created for those columns. The statistics gathering in Chapter 7 created a histogram for the Shipped column.
So, what will happen in this case if you set CURSOR_SHARING equal to FORCE?
In Crystal, log off all database connections, then flush the shared pool to remove the already parsed queries with literal parameter values:
ALTER SYSTEM FLUSH SHARED_POOL
Next, set CURSOR_SHARING to FORCE:
ALTER SYSTEM SET CURSOR_SHARING=FORCE;
Run the report for Shipped=1. Notice, as shown in Figure 8-16, that the literals have been replaced with bind variables and the execution plan involves a full table scan.
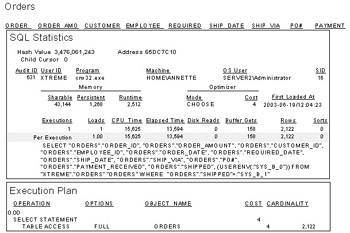
Figure 8-16: Orders report results 3
Run the report for Shipped=0. Notice, as shown in Figure 8-17, that the same query is executed a second time and that the execution plan is still doing a full table scan even though using an index would be less costly.

Figure 8-17: Orders report results 4
As you can see, the drawback to setting CURSOR_SHARING=FORCE is that the optimizer will share the cursor even when it does not produce an optimal execution plan.
CURSOR_SHARING=SIMILAR
A possible value of SIMILAR for the CURSOR_SHARING parameter was introduced in Oracle 9i to minimize the problems caused by the FORCE value and yet retain its positive aspects. Setting CURSOR_SHARING=SIMILAR tells Oracle to share cursors if SQL statements differ only in literals and their execution plans are the same.
| Note |
SIMILAR is only available in Oracle 9i. |
To see what will happen with our Orders report if you set CURSOR_SHARING equal to SIMILAR, log off all database connections in Crystal and flush the shared pool to remove the already parsed queries:
ALTER SYSTEM FLUSH SHARED_POOL
Then set CURSOR_SHARING to SIMILAR:
ALTER SYSTEM SET CURSOR_SHARING=SIMILAR;
Run the report for Shipped=1. Notice that, as shown in Figure 8-18, the literals have been replaced with bind variables, and the execution plan performs a full table scan, just as when CURSOR_SHARING was set to FORCE.
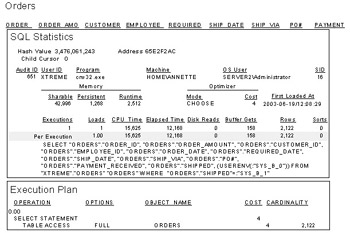
Figure 8-18: Orders report results 5
Now run the report for Shipped=0. Notice, as shown in Figures 8-19 and 8-20, you now have two Child Cursors. This happened because the two queries that you executed have the same SQL text, including the substitution of bind variables for literals, but they have two different execution plans.
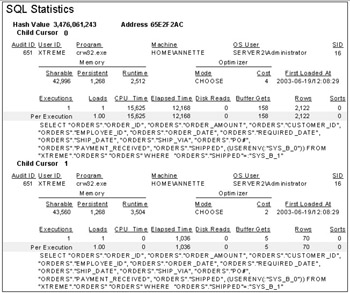
Figure 8-19: Orders report results 6: SQL Statistics
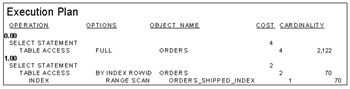
Figure 8-20: Orders report results 6: Execution Plan
Because CURSOR_SHARING is set to SIMILAR, Oracle considers the execution plan as well as the SQL text before determining statement equality. In this case, Child Cursor 1 is the one that was actually executed, as seen by examining the Loads and Executions columns for each child cursor. This is the desired outcome because Child Cursor 1 uses the index for table access.
Setting CURSOR_SHARING=SIMILAR seems to be the optimal process. However, there is a performance hit, as extra work is required to determine the similar statements and to compare their execution plans.
Choosing a Parse Reduction Method
Reducing parsing is always desirable. However, the proportional benefit of reduced parsing depends on the resource usage for parsing versus the resource usage for all other phases of execution. This varies depending on the query. Parse reduction benefits also depend on the server environment, including how much memory is available for the shared pool and how extensive your available CPU resources are.
Table 8-1 summarizes the pros and cons of the methods we have discussed for hard parse reduction.
|
Method |
Pro |
Con |
|---|---|---|
|
Stored procedures |
No extra work involved in parsing |
Doesn't always use optimal execution plan based on column skewness |
|
CURSOR_SHARING=FORCE |
Less extra work involved in parsing than CURSOR_SHARING=SIMILAR |
Doesn't always use optimal execution plan based on column skewness Some extra work involved in parsing |
|
CURSOR_SHARING=SIMILAR (9i only) |
Always uses optimal execution plan based on column skewness |
More extra work involved in parsing than CURSOR_SHARING=FORCE Only available in 9i |
Which, if any, of these methods that you employ, will depend on your particular environment and reports. If you have an environment that is experiencing memory shortages or scalability problems and you determine that these problems are due to many similar statements existing in the shared pool, you will want to employ one or all of these methods to alleviate those problems.
If your aim is to create an optimized reporting environment up front, you will need to make a system level decision about setting the CURSOR_SHARING parameter, and a report-by-report decision about a parse reducing method.
If you know that a majority of your reports are executed repeatedly with different parameter values, and that the selection fields involved are not highly skewed, your optimal choice would be to create a stored procedure to back up each report. This would ensure minimal parsing and cause no overhead. Your second choice, which would not require any rewrites to existing reports, would be to set CURSOR_SHARING equal to FORCE. Doing this would also ensure minimal parsing but add a small amount of overhead. If you are concerned that your environment contains some reports that use a skewed field for selection or sorting, you should set CURSOR_SHARING equal to SIMILAR. Though SIMILAR causes more overhead than FORCE, it is still a small amount and well worth the tradeoff of reduced hard parses.
Of course, the CURSOR_SHARING parameter will affect all queries made against the server and not just those that support reporting. You must weigh the reporting benefits of setting this parameter against any problems caused to nonreporting processes.
Once you make your decision about the system level setting for the CURSOR_ SHARING parameter, you will still need to evaluate each report to determine its optimal cursor sharing method. If CURSOR_SHARING is set to EXACT, your only report level option will be whether to use a stored procedure or not. If you use a stored procedure, the SQL statement will be reused in every case. If you do not use a stored procedure, each time the parameter values change, a new cursor will be parsed.
For an individual report, to override CURSOR_SHARING being set to SIMILAR or FORCE at the system level, you can use the CURSOR_SHARING_EXACT optimizer hint. (See the “Optimizer Hints” section in Chapter 7 for details on how to use optimizer hints.) This gives you the option of using a stored procedure or the hint. Either will ensure no reparsing, although they will not account for column skewness.
Caching Cursors
As with any optimization attempt, improving one process can reveal issues with another process. Reducing hard parses will, by definition, create more soft parsing. Soft parsing is significantly less resource intensive than hard parsing, so this is a desirable outcome. However, you can go one step further and attempt to reduce the impact of soft parsing as well.
A normal soft parse consists of a syntax check, a semantics check, and a search of the shared pool to find the already optimized statement and its execution plan. The session cursor cache, if enabled, saves pointers to the shared pool of parsed versions of the session’s SQL statements. The initialization parameter that sets the number of cursors saved is the Session_Cached_Cursors parameter. If a cursor is needed again by a session and exists in the cursor cache, some resources that would otherwise have been required by the parse will be saved.
The default value of Session_Cached_Cursors is zero, and they can be set either dynamically for a given session using the ALTER SESSION command, or in the initialization file to change the default for all database sessions. They cannot be changed dynamically at the ALTER SYSTEM level. Because there is no method with which to issue an ALTER SESSION command from Crystal Reports (except with dynamic SQL in a stored procedure), you must change the Session_Cached_ Cursors parameter at the database level.
Determining what Session_Cached_Cursors should be set to will require the assistance of your DBA. If Session_Cached_Cursors is set to a value greater than 0 and a given SQL statement has been parsed at least three times, a pointer to it will be added to the session’s cursor cache when the session next makes a parse call. Then, the next time that a parse call for that statement is made, a cache hit will occur and the soft parse will be eliminated. Setting Session_Cached_Cursors requires some memory; however, because it stores only pointers, this memory requirement is quite low. Oracle recommends starting with a value of 50 and monitoring “session cursor cache hits” to adjust the value on an ongoing basis. Ideally, your DBA will be monitoring SQL statistics and will know approximately how many statements have large numbers of soft parses on an ongoing basis.
Session_Cached_Cursors is a per session parameter. The value of setting it will depend on your reporting environment and how sessions are maintained. Each log off/log on from Crystal Reports will create a new session. However, the parse count is maintained for each statement across all sessions, so each session knows how many times a given statement has been parsed and can cache it immediately if it has already been parsed three times by any other session.
For the examples, Session_Cached_Cursors was set to 50 and the database was restarted.
To investigate the impact of setting Session_Cached_Cursors, a new subreport has been created. This subreport displays session statistics and is called Show Session Stats Subreport.rpt (Show Session Stats Subreport 8i.rpt). The subreport uses the V$Session, V$SesStat, and V$StatName dynamic performance views. The user must have SELECT privileges on these views in order to use the subreport.
The Show Session Stats Subreport was added to the Orders report and the new report is named Chapter 8Orders with Session Stats.rpt or Chapter 8Orders with Session Stats 8i.rpt. Open Orders with Session Stats. Run the report for Shipped=1 and scroll to the last page.
As shown in Figure 8-21, the Session Statistics show many parses, some hard, some soft, as well as some cache hits. This is because the Session Statistics displays the totals for the session, whereas the SQL Statistics show the values for only one SQL command. Presumably, Crystal Reports has issued several queries as part of its initialization for the report. Some of these probably queried the database dictionary, for instance, to retrieve the table names. In any case, it is the change in the Session Statistics values that you are interested in. You may see different totals for the Session Statistics as you run the examples, but the change in the values should be the same as stated here.
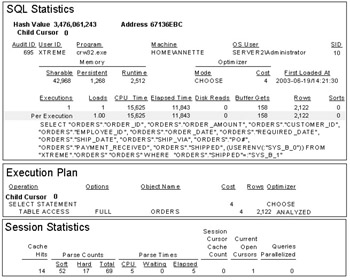
Figure 8-21: Orders with Session Stats 1
Now run the report again with the same parameter value.
Notice, as shown in Figure 8-22, that the executions increased by 1, loads stayed the same, and soft parses increased by 1.
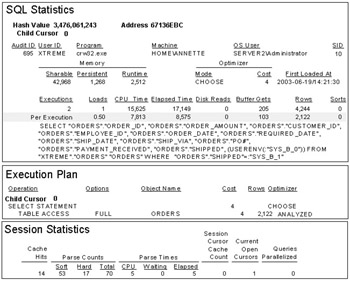
Figure 8-22: Orders with Session Stats 2
Now run the report again with the same parameter values. You will notice, as shown in Figure 8-23, that executions increased by 1 again, loads stayed the same, and soft parses also increased by 1 again.

Figure 8-23: Orders with Session Stats 3
Run the report again with the same parameter values. In the fourth run, you will see that executions increased by 1, loads stayed the same, and the cache hit increased along with the soft parses, as shown in Figure 8-24. This demonstrates session cursor caching in action. On the fourth and subsequent runs, the parsed statement will be drawn from the cache.

Figure 8-24: Orders with Session Stats 4
Note that the SID for the current session as shown in the SQL Statistics subreport is 10. Log off of all connected databases, and rerun the report with the same parameter values.
Notice, as shown in Figure 8-25, that the SID changed to 12. The SID may or may not change when you run the examples, but be aware that even if the session ID stays the same after relogin, the session is a new session. Also, note that executions increased by 1 and loads stayed level, as expected. However, the cache hits dropped to 0, and soft parses show as 4. Cache hits dropped to 0 because this is the first query that has been run in this session, so no caching has been done yet. Soft parses have been set to 4 because the optimizer must do at least one soft parse for the statement for this session, and it also recognizes that this statement has been parsed at least three times previously by other sessions.

Figure 8-25: Orders with Session Stats 5
Rerun the report with the same parameter values.
Now you see again, as shown in Figure 8-26, that executions increased by 1 and loads stayed at 1, but this time a cache hit has occurred.

Figure 8-26: Orders with Session Stats 6
Rerun the report and change the Shipped parameter to 0. As illustrated in Figures 8-27 and 8-28, a new child cursor was created because the execution plan changed, and the changed execution plan forced a hard parse to occur.
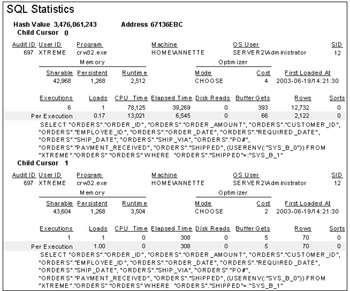
Figure 8-27: Orders with Session Stats 7, SQL Statistics
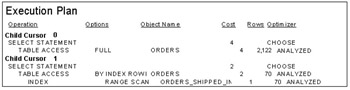
Figure 8-28: Orders with Session Stats 7, Execution Plan
However, the cache hits increased anyway, as shown in Figure 8-29. The cache hits increased because the statement was identical to the previous statement even though the execution plan differed.
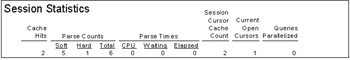
Figure 8-29: Orders with Session Stats 7, Session Statistics
This chapter covered parse reduction and cursor caching. Parse reduction and cursor caching can be used to optimize the repeated execution of the same or similar report queries in a multiuser environment. Implementing these strategies will improve execution time for a single user and single report, but they will have their greatest impact on improved system scalability.
Chapter 9 will cover various Oracle features that report writers might find useful for special purpose reports, including materialized views to precompute report data, heterogeneous services and external tables to access data outside of Oracle, and flashback queries to report on older data. Modifying database records via Crystal Reports will be touched on briefly.
EAN: N/A
Pages: 101
