Graphics Class Methods
We can divide Graphics class methods into three categories: draw, fill, and miscellaneous. Draw methods are used to draw lines, curves, and outer boundaries of closed curves and images. Fill methods fill the interior area of graphics objects. There are also a few miscellaneous methods that fall in neither categoryfor example, MeasureString and Clear.
3.2.1 Draw Methods
The draw methods of the Graphics class are used to draw lines, curves, and outer boundaries of closed curves and images. Table 3.2 lists the draw methods of the Graphics class.
3.2.1.1 Drawing Lines
The DrawLine method draws a line beween two points specified by a pair of coordinates. DrawLines draws a series of lines using an array of points.
|
Method |
Description |
|---|---|
|
DrawArc |
Draws an arc (a portion of an ellipse specified by a pair of coordinates, a width, a height, and start and end angles). |
|
DrawBezier |
Draws a Bézier curve defined by four Point structures. |
|
DrawBeziers |
Draws a series of Bézier splines from an array of Point structures. |
|
DrawClosedCurve |
Draws a closed cardinal spline defined by an array of Point structures. |
|
DrawCurve |
Draws a cardinal spline through a specified array of Point structures. |
|
DrawEllipse |
Draws an ellipse defined by a bounding rectangle specified by a pair of coordinates, a height, and a width. |
|
DrawIcon |
Draws an image represented by the specified Icon object at the specified coordinates. |
|
DrawIconUnstretched |
Draws an image represented by the specified Icon object without scaling the image. |
|
DrawImage |
Draws the specified Image object at the specified location and with the original size. |
|
DrawImageUnscaled |
Draws the specified Image object with its original size at the location specified by a coordinate pair. |
|
DrawLine |
Draws a line connecting two points specified by coordinate pairs. |
|
DrawLines |
Draws a series of line segments that connect an array of Point structures. |
|
DrawPath |
Draws a GraphicsPath object. |
|
DrawPie |
Draws a pie shape specified by a coordinate pair, a width, a height, and two radial lines. |
|
DrawPolygon |
Draws a polygon defined by an array of Point structures. |
|
DrawRectangle |
Draws a rectangle specified by a coordinate pair, a width, and a height. |
|
DrawRectangles |
Draws a series of rectangles specified by an array of Rectangle structures. |
|
DrawString |
Draws the specified text string at the specified location using the specified Brush and Font objects. |
DrawLine has four overloaded methods. The first argument of all DrawLine methods is a Pen object, with texture, color, and width attributes. The rest of the arguments vary. You can use two points with integer or floating point values, or you can pass four integer or floating point values directly:
- public void DrawLine(Pen, Point, Point);
- public void DrawLine(Pen, PointF, PointF);
- public void DrawLine(Pen, int, int, int, int);
- public void DrawLine(Pen, float, float, float, float);
To draw a line, an application first creates a Pen object, which defines the color and width. The following line of code creates a red pen with a width of 1:
Pen redPen = new Pen(Color.Red, 1);
After that we define the endpoints of the line:
float x1 = 20.0F, y1 = 25.0F;
float x2 = 200.0F, y2 = 100.0F;
Finally, we use the pen and points as input to DrawLine:
Graphics.DrawLine(redPen, x1, y1, x2, y2);
Listing 3.1 shows how to use the different overloaded methods. We create four pens with different colors and widths. After that we call DrawLine with different valuesincluding integer, floating point, and Point structuresto draw four different lines. Three of them start at point (20, 20).
Listing 3.1 Drawing lines
private void Form1_Paint(object sender,
 System.Windows.Forms.PaintEventArgs e)
{
 // Create four Pen objects with red,
 // blue, green, and black colors and
 // different widths
 Pen redPen = new Pen(Color.Red, 1);
 Pen bluePen = new Pen(Color.Blue, 2);
 Pen greenPen = new Pen(Color.Green, 3);
 Pen blackPen = new Pen(Color.Black, 4);
 // Draw line using float coordinates
 float x1 = 20.0F, y1 = 20.0F;
 float x2 = 200.0F, y2 = 20.0F;
 e.Graphics.DrawLine(redPen, x1, y1, x2, y2);
 // Draw line using Point structure
 Point pt1 = new Point(20, 20);
 Point pt2 = new Point(20, 200);
 e.Graphics.DrawLine(greenPen, pt1, pt2);
 // Draw line using PointF structure
 PointF ptf1 = new PointF(20.0F, 20.0F);
 PointF ptf2 = new PointF(200.0F, 200.0F);
 e.Graphics.DrawLine(bluePen, ptf1, ptf2);
 // Draw line using integer coordinates
 int X1 = 60, Y1 = 40, X2 = 250, Y2 = 100;
 e.Graphics.DrawLine(blackPen, X1, Y1, X2, Y2);
 // Dispose of objects
 redPen.Dispose();
 bluePen.Dispose();
 greenPen.Dispose();
 blackPen.Dispose();
}
The output from Listing 3.1 is shown in Figure 3.1. We've drawn four lines starting at point (20, 20).
Figure 3.1. Using DrawLine to draw lines
3.2.1.2 Drawing Connected Lines
Sometimes we need to draw multiple connected straight line segments. One way to do this is to call the DrawLine method multiple times.
The Graphics class also provides the DrawLines method, which can be used to draw multiple connected lines. This method has two overloaded forms. One takes an array of Point structure objects, and the other takes an array of PointF structure objects:
- public void DrawLines(Pen, Point[]);
- public void DrawLines(Pen, PointF[]);
To draw lines using DrawLines, an application first creates a Pen object, then creates an array of points, and then calls DrawLines. The code in Listing 3.2 draws three line segments.
Listing 3.2 Using DrawLines to draw connected lines
PointF[] ptsArray =
{
 new PointF( 20.0F, 20.0F),
 new PointF( 20.0F, 200.0F),
 new PointF(200.0F, 200.0F),
 new PointF(20.0F, 20.0F)

};
e.Graphics.DrawLines(redPen, ptsArray);
The code in Listing 3.2 draws what is shown in Figure 3.2.
Figure 3.2. Using DrawLines to draw connected lines
3.2.1.3 Drawing Rectangles
The next basic drawing object is a rectangle. When you draw a rectangle through your applications, you need to specify only the starting point, height, and width of the rectangle. GDI+ takes care of the rest.
The Graphics class provides the DrawRectangle method, which draws a rectangle specified by a starting point, a width, and a height. The Graphics class also provides the DrawRectangles method, which draws a series of rectangles specified by an array of Rectangle structures.
DrawRectangle has three overloaded methods. An application can use a Rectangle structure or coordinates of integer or float types to draw a rectangle:
- public void DrawRectangle(Pen, Rectangle);
- public void DrawRectangle(Pen, int, int, int, int);
- public void DrawRectangle(Pen, float, float, float, float);
To draw a rectangle, an application first creates a pen and a rectangle (location, width, and height), and then it calls DrawRectangle. Listing 3.3 draws rectangles using the different overloaded forms of DrawRectangle.
Listing 3.3 Using DrawRectangle to draw rectangles
private void Form1_Paint(object sender,
 System.Windows.Forms.PaintEventArgs e)
{
 // Create pens and points
 Pen redPen = new Pen(Color.Red, 1);
 Pen bluePen = new Pen(Color.Blue, 2);
 Pen greenPen = new Pen(Color.Green, 3);
 float x = 5.0F, y = 5.0F;
 float width = 100.0F;
 float height = 200.0F;
 // Create a rectangle
 Rectangle rect = new Rectangle(20, 20, 80, 40);
 // Draw rectangles
 e.Graphics.DrawRectangle(bluePen,
 x, y, width, height);
 e.Graphics.DrawRectangle(redPen,
 60, 80, 140, 50);
 e.Graphics.DrawRectangle(greenPen, rect);
 // Dispose of objects
 redPen.Dispose();
 bluePen.Dispose();
 greenPen.Dispose();
}
Figure 3.3 shows the output from Listing 3.3.
Figure 3.3. Drawing individual rectangles
The DrawRectangles method draws a series of rectangles using a single-pen. It is useful when you need to draw multiple rectangles using the same pen (if you need to draw multiple rectangles using different pens, you must use multiple calls to DrawRectangle). A single call to DrawRectangles is faster than multiple DrawRectangle calls. DrawRectangles takes two parametersa pen and an array of Rectangle or RectangleF structuresas shown in Listing 3.4.
Listing 3.4 Using DrawRectangles to draw a series of rectangles
Pen greenPen = new Pen(Color.Green, 4);
RectangleF[] rectArray
{
 new RectangleF( 5.0F, 5.0F, 100.0F, 200.0F),
 new RectangleF(20.0F, 20.0F, 80.0F, 40.0F),
 new RectangleF(60.0F, 80.0F, 140.0F, 50.0F)
};
e.Graphics.DrawRectangles(greenPen, rectArray);
greenPen.Dispose()
Figure 3.4 shows the output from Listing 3.4. As you can see, it's easy to draw multiple rectangles using the DrawRectangles method.
Figure 3.4. Drawing a series of rectangles
3.2.1.4 Drawing Ellipses and Circles
An ellipse is a circular boundary within a rectangle, where each opposite point has the same distance from a fixed point, called the center of the ellipse. An ellipse within a square is called a circle. Figure 3.5 shows an ellipse with its height, width, and center indicated.
Figure 3.5. An ellipse
To draw an ellipse, you need to specify the outer rectangle. GDI+ takes care of the rest. DrawEllipse draws an ellipse defined by a rectangle specified by a pair of coordinates, a height, and a width (an ellipse with equal height and width is a circle). DrawEllipse has four overloaded methods:
- public void DrawEllipse(Pen, Rectangle);
- public void DrawEllipse(Pen, RectangleF);
- public void DrawEllipse(Pen, int, int, int, int);
- public void DrawEllipse(Pen, float, float, float, float);
To draw an ellipse, an application creates a pen and four coordinates (or a rectangle), and then calls DrawEllipse. Listing 3.5 draws ellipses with different options.
Listing 3.5 Drawing ellipses
private void Form1_Paint(object sender,
 System.Windows.Forms.PaintEventArgs e)
{
 // Create pens
 Pen redPen = new Pen(Color.Red, 6 );
 Pen bluePen = new Pen(Color.Blue, 4 );
 Pen greenPen = new Pen(Color.Green, 2);
 // Create a rectangle
 Rectangle rect =
 new Rectangle(80, 80, 50, 50);
 // Draw ellipses
 e.Graphics.DrawEllipse(greenPen,
 100.0F, 100.0F, 10.0F, 10.0F );
 e.Graphics.DrawEllipse(redPen, rect );
 e.Graphics.DrawEllipse(bluePen, 60, 60, 90, 90);
 e.Graphics.DrawEllipse(greenPen,
 40.0F, 40.0F, 130.0F, 130.0F );
 // Dispose of objects
 redPen.Dispose();
 greenPen.Dispose();
 bluePen.Dispose();
}
Figure 3.6 shows the output from Listing 3.5.
Figure 3.6. Drawing ellipses
3.2.1.5 Drawing Text
This section briefly discusses the drawing of text. Chapter 5 covers this topic in more detail.
The DrawString method draws a text string on a graphics surface. It has many overloaded forms. DrawString takes arguments that identify the text, font, brush, starting location, and string format.
The simplest form of DrawString looks like this:
public void DrawString(string, Font, Brush, PointF);
where string is the text that you want to draw, Font and Brush are the font and brushes used to draw the text, and PointF is the starting point of the text.
Listing 3.6 uses the DrawString method to draw "Hello GDI+ World!" on a form.
Listing 3.6 Drawing text
private void Form1_Paint(object sender,
System.Windows.Forms.PaintEventArgs e)
{
 e.Graphics.DrawString("Hello GDI+ World!",
 new Font("Verdana", 16),
 new SolidBrush(Color.Red),
 new Point(20, 20));
}
Note
You might notice in Listing 3.6 that we create Font, SolidBrush, and Point objects directly as parameters of the DrawString method. This method of creating objects means that we can't dispose of these objects, so some cleanup is left for the garbage collector.
Figure 3.7 shows the output from Listing 3.6.
Figure 3.7. Drawing text
The DrawString method has several overloaded forms, as shown here:
- public void DrawString(string, Font, Brush, RectangleF);
- public void DrawString(string, Font, Brush, PointF, StringFormat);
- public void DrawString(string, Font, Brush, RectangleF, StringFormat);
- public void DrawString(string, Font, Brush, float, float);
- public void DrawString(string, Font, Brush, float, float, StringFormat);
Now let's see another example of drawing textthis time using the StringFormat class, which defines the text format. Using StringFormat, you can set flags, alignment, trimming, and other options for the text. (Chapter 5 discusses this functionality in more detail.) Listing 3.7 shows different ways to draw text on a graphics surface. In this example the FormatFlags property is set to StringFormatFlags.DirectionVertical, which draws vertical text.
Listing 3.7 Using DrawString to draw text on a graphics surface
private void Form1_Paint(object sender,
 System.Windows.Forms.PaintEventArgs e)
{
 // Create brushes
 SolidBrush blueBrush = new SolidBrush(Color.Blue);
 SolidBrush redBrush = new SolidBrush(Color.Red);
 SolidBrush greenBrush = new SolidBrush(Color.Green);
 // Create a rectangle
 Rectangle rect = new Rectangle(20, 20, 200, 100);
 // The text to be drawn
 String drawString = "Hello GDI+ World!";
 // Create a Font object
 Font drawFont = new Font("Verdana", 14);
 float x = 100.0F;
 float y = 100.0F;
 // String format
 StringFormat drawFormat = new StringFormat();
 // Set string format flag to direction vertical,
 // which draws text vertically
 drawFormat.FormatFlags =
 StringFormatFlags.DirectionVertical;
 // Draw string
 e.Graphics.DrawString("Drawing text",
 new Font("Tahoma", 14), greenBrush, rect);
 e.Graphics.DrawString(drawString,
 new Font("Arial", 12), redBrush, 120, 140);
 e.Graphics.DrawString(drawString, drawFont,
 blueBrush, x, y, drawFormat);
 // Dispose of objects
 blueBrush.Dispose();
 redBrush.Dispose();
 greenBrush.Dispose();
 drawFont.Dispose();
}
Figure 3.8 shows the output from Listing 3.7.
Figure 3.8. Drawing text with different directions
3.2.1.6 Creating a Line Chart Application
As promised, the examples in this book not only show the use of GDI+, but also encourage you to use GDI+ practices in real-world applications, We will create one more real-world application, a line chart application. In this example we will use all the functionality we have discussed so far. Our line chart application will draw lines when a user clicks on a form.
We create a Windows application and add a check box and a button. Then we change the Text properties of the button and the check box to call them Clear All and Rectangle, respectively. Then we add code to draw two lines and some numbers (using the DrawString method). The initial screen of the line chart application looks like Figure 3.9.
Figure 3.9. The line chart application

When you click on the form, the application draws a line. The first line starts from the bottom left corner, where the values of our x- and y-axes are both 0. After a few clicks, the chart looks like Figure 3.10. Every time you click on the form, the application draws a line from the previous point to the current point and draws a small ellipse representing the current point.
Figure 3.10. The line chart application with a chart

The Clear All button removes the lines and initializes the first point to (0, 0). Now if you check the Rectangle box and click on the form, the chart looks like Figure 3.11. When you click the left mouse button for the first time, the application draws a line from point (0, 0) to the point where you clicked the button.
Figure 3.11. The line chart with rectangles to mark points
Now let's see the code. First we declare starting and ending points. These points will be used to draw a line when you click the left mouse button. The default values of both points are shown in the following code fragment, which represents position (0, 0) on the screen:
private Point startPoint = new Point(50, 217);
private Point endPoint = new Point(50, 217);
The next step is to draw vertical and horizontal axis lines with index numbers. We do this on the form's paint event handler with the help of the DrawString method. Listing 3.8 provides code for the form-paint event handler. As the listing shows, we simply draw a vertical line, a horizontal line, and the marks on these lines.
Listing 3.8 Drawing lines and marks
private void Form1_Paint(object sender,
 System.Windows.Forms.PaintEventArgs e)
{
 Graphics g = e.Graphics;
 Font vertFont =
 new Font("Verdana", 10, FontStyle.Bold);
 Font horzFont =
 new Font("Verdana", 10, FontStyle.Bold);
 SolidBrush vertBrush = new SolidBrush(Color.Black);
 SolidBrush horzBrush = new SolidBrush(Color.Blue);
 Pen blackPen = new Pen(Color.Black, 2);
 Pen bluePen = new Pen(Color.Blue, 2);
 // Drawing a vertical and a horizontal line
 g.DrawLine(blackPen,50,220,50, 25);
 g.DrawLine(bluePen,50,220,250,220);
 // x-axis drawing
 g.DrawString("0",horzFont,horzBrush,30, 220);
 g.DrawString("1",horzFont,horzBrush,50,220);
 g.DrawString("2",horzFont,horzBrush,70,220);
 g.DrawString("3",horzFont,horzBrush,90,220);
 g.DrawString("4",horzFont,horzBrush,110,220);
 g.DrawString("5",horzFont,horzBrush,130,220);
 g.DrawString("6",horzFont,horzBrush,150,220);
 g.DrawString("7",horzFont,horzBrush,170,220);
 g.DrawString("8",horzFont,horzBrush,190,220);
 g.DrawString("9",horzFont,horzBrush,210,220);
 g.DrawString("10",horzFont,horzBrush,230,220);
 // Drawing vertical strings
 StringFormat vertStrFormat = new StringFormat();
 vertStrFormat.FormatFlags =
 StringFormatFlags.DirectionVertical;

 g.DrawString("-",horzFont,horzBrush,
 50, 212, vertStrFormat);
 g.DrawString("-",horzFont,horzBrush,
 70, 212, vertStrFormat);
 g.DrawString("-",horzFont,horzBrush,
 90, 212, vertStrFormat);
 g.DrawString("-",horzFont,horzBrush,
 110, 212, vertStrFormat);
 g.DrawString("-",horzFont,horzBrush,
 130, 212, vertStrFormat);
 g.DrawString("-",horzFont,horzBrush,
 150, 212, vertStrFormat);
 g.DrawString("-",horzFont,horzBrush,
 170, 212, vertStrFormat);
 g.DrawString("-",horzFont,horzBrush,
 190, 212, vertStrFormat);
 g.DrawString("-",horzFont,horzBrush,
 210, 212, vertStrFormat);
 g.DrawString("-",horzFont,horzBrush,
 230, 212, vertStrFormat);
 // y-axis drawing
 g.DrawString("100-",vertFont,vertBrush, 20,20);
 g.DrawString("90 -",vertFont,vertBrush, 25,40);
 g.DrawString("80 -",vertFont,vertBrush, 25,60);
 g.DrawString("70 -",vertFont,vertBrush, 25,80);
 g.DrawString("60 -",vertFont,vertBrush, 25,100);
 g.DrawString("50 -",vertFont,vertBrush, 25,120);
 g.DrawString("40 -",vertFont,vertBrush, 25,140);
 g.DrawString("30 -",vertFont,vertBrush, 25,160);
 g.DrawString("20 -",vertFont,vertBrush, 25,180);
 g.DrawString("10 -",vertFont,vertBrush, 25,200);
 // Dispose of objects
 vertFont.Dispose();
 horzFont.Dispose();
 vertBrush.Dispose();
 horzBrush.Dispose();
 blackPen.Dispose();
 bluePen.Dispose();
}
Note
The idea in Listing 3.8 is to show an extensive use of the DrawString method. Alternatively and preferably, you could replace DrawString with the DrawLine and/or DrawLines method.
Now on the mouse-down event handler, we draw a line from the starting point (0, 0) to the first mouse click. We store the mouse click position as the starting point for the next line. When we click again, the new line will be drawn from the current starting position to the point where the mouse was clicked. Listing 3.9 shows the mouse-down click event handler. We create a new Graphics object using the CreateGraphics method. After that we create two Pen objects. We store the previous point as the starting point and the current point as the ending point. The X and Y properties of MouseEventArgs return the x- and y-values of the point where the mouse was clicked.
Now we check to see if the Rectangle check box is checked. If so, we draw a rectangle to mark the connecting point of the two lines. If not, we draw an ellipse as the connecting point.
Listing 3.9 The mouse-down event handler
private void Form1_MouseDown(object sender,
 System.Windows.Forms.MouseEventArgs e)
{
 if (e.Button == MouseButtons.Left)
 {
 // Create a Graphics object
 Graphics g1 = this.CreateGraphics();
 // Create two pens
 Pen linePen = new Pen(Color.Green, 1);
 Pen ellipsePen = new Pen(Color.Red, 1);
 startPoint = endPoint;
 endPoint = new Point(e.X, e.Y);
 // Draw the line from the current point
 // to the new point
 g1.DrawLine(linePen, startPoint, endPoint);
 // If Rectangle check box is checked,
 // draw a rectangle to represent the point
 if(checkBox1.Checked)
 {
 g1.DrawRectangle(ellipsePen,
 e.X-2, e.Y-2, 4, 4);
 }
 // Draw a circle to represent the point
 else
 {
 g1.DrawEllipse(ellipsePen,
 e.X-2, e.Y-2, 4, 4);
 }
 // Dispose of objects
 linePen.Dispose();
 ellipsePen.Dispose();
 g1.Dispose();
 }
}
The Clear All button removes all the lines by invalidating the form's client area and sets the starting and ending points back to their initial values. Code for the Clear All button click event handler is given in Listing 3.10.
Listing 3.10 The Clear All button click event handler
private void button1_Click(object sender,
 System.EventArgs e)
{
 startPoint.X = 50;
 startPoint.Y = 217;
 endPoint.X = 50;
 endPoint.Y = 217;
 this.Invalidate(this.ClientRectangle);
}
3.2.1.7 Drawing Arcs
An arc is a portion of an ellipse. For example, Figure 3.12 shows an ellipse that has six arcs. An arc is defined by a bounding rectangle (just as an ellipse), a start angle, and a sweep angle. The start angle is an angle in degrees measured clockwise from the x-axis to the starting point of the arc. The sweep angle is an angle in degrees measured clockwise from the startAngle parameter to the ending point of the arc. So an arc is the portion of the perimeter of the ellipse between the start angle and the start angle plus the sweep angle.
Figure 3.12. Arcs in an ellipse
The DrawArc method draws an arc on a graphics surface. DrawArc takes a pen, a pair of coordinates, a width, and a height. There are many DrawArc overloaded methods. An application can use a Rectangle or RectangleF object and integer or float coordinates:
- public void DrawArc(Pen, Rectangle, float, float);
- public void DrawArc(Pen, RectangleF, float, float);
- public void DrawArc(Pen, int, int, int, int, int, int);
- public void DrawArc(Pen, float, float, float, float, float, float);
The Pen object determines the color, width, and style of the arc; Rectangle or RectangleF represents the bounding rectangle; and the last two parameters are the start angle and sweep angle.
To draw an arc, the application creates Pen and Rectangle objects and defines start and sweep angles. Then it calls the DrawArc method.
Let's create an application that will draw an arc to match the values of the start and sweep angles. We create a Windows application, adding add two text boxes and a button control. The final form looks like Figure 3.13.
Figure 3.13. A sample arc application
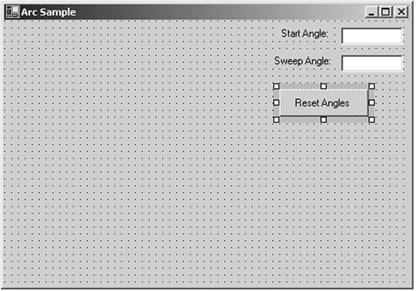
We define two floating variables on the class level to store the start and sweep angles:
private float startAngle = 45.0f;
private float sweepAngle = 90.0f;
Now let's draw an arc on the form's paint event handler. Listing 3.11 draws an arc. We first create a pen and a rectangle, and we use them in the DrawArc method with start and sweep angles.
Listing 3.11 The paint event handler
private void Form1_Paint(object sender,
 System.Windows.Forms.PaintEventArgs e)
{
 Pen redPen = new Pen(Color.Red, 3);
 Rectangle rect =
 new Rectangle(20, 20, 200, 200);
 e.Graphics.DrawArc(redPen,
 rect, startAngle, sweepAngle);
 redPen.Dispose();
}
Now we add code for the Reset Angles button. Listing 3.12 simply sets the start and sweep angles by reading values from the text boxes and calls the Invalidate method, which forces GDI+ to call the form's paint event handler.
Listing 3.12 The Reset Angles button click event handler
private void ResetAnglesBtn_Click(object sender,
 System.EventArgs e)
{
 startAngle =
 (float)Convert.ToDouble(textBox1.Text);
 sweepAngle =
 (float)Convert.ToDouble(textBox2.Text);
 Invalidate();
}
Figure 3.14 shows the default output from the application.
Figure 3.14. The default arc, with start angle of 45 degrees and sweep angle of 90 degrees
Now let's change the start and sweep angles to 90 and 180 degrees, respectively, and click the Reset Angles button. The new output looks like Figure 3.15.
Figure 3.15. An arc with start angle of 90 degrees and sweep angle of 180 degrees
Let's change angles one more time. This time our start angle will be 180 degrees, and the sweep angle will be 360 degrees. The new output looks like Figure 3.16.
Figure 3.16. An arc with start angle of 180 degrees and sweep angle of 360 degree
3.2.1.8 Drawing Splines and Curves
A curve is a sequence of adjoining points with a tension. The tension of a curve provides its smoothness and removes corners. A cardinal spline is a sequence of multiple joined curves. Basically, in a curve there is no straight line between two points. To illustrate, Figure 3.17 shows two curves.
Figure 3.17. Two curves
There are two types of curves: open and closed. A closed curve is a curve whose starting point is the ending point. A curve that is not a closed curve is called an open curve. In Figure 3.18 the first curve is an open curve, and the second curve is a closed curve.
Figure 3.18. Open and closed curves
3.2.1.9 Drawing Open Curves
Programmatically, a curve is an array of connected points with a tension. A curve has a starting point and an ending point. Between these two points can be many intermediate points. The Graphics class provides two methods for drawing curves: DrawCurve and DrawClosedCurve. The DrawCurve method draws a curve specified by an array of Point structures. The DrawClosedCurve draws a closed curve specified by an array of Point structures. Both DrawCurve and DrawClosedCurve have overloaded methods.
DrawCurve has the following overloaded forms:
- public void DrawCurve(Pen, Point[]);
- public void DrawCurve(Pen, PointF[]);
- public void DrawCurve(Pen, Point[], float);
- public void DrawCurve(Pen, PointF[], float);
- public void DrawCurve(Pen, PointF[], int, int);
- public void DrawCurve(Pen, Point[], int, int, float);
- public void DrawCurve(Pen, PointF[], int, int, float);
The simplest form of DrawCurve is
public void DrawCurve(Pen pen, Point[] points);
where points is an array of points.
To test the DrawCurve methods, we create a Windows application and add Listing 3.13 to the form's paint event handler. It creates an array of points and draws a curve using the DrawCurve method.
Listing 3.13 Drawing a curve
private void Form1_Paint(object sender,
 System.Windows.Forms.PaintEventArgs e)
{
 // Create a pen
 Pen bluePen = new Pen(Color.Blue, 1);
 // Create an array of points
 PointF pt1 = new PointF( 40.0F, 50.0F);
 PointF pt2 = new PointF(50.0F, 75.0F);
 PointF pt3 = new PointF(100.0F, 115.0F);
 PointF pt4 = new PointF(200.0F, 180.0F);
 PointF pt5 = new PointF(200.0F, 90.0F);
 PointF[] ptsArray =
 {
 pt1, pt2, pt3, pt4, pt5
 };
 // Draw curve
 e.Graphics.DrawCurve(bluePen, ptsArray);
 // Dispose of object
 bluePen.Dispose();
}
Figure 3.19 shows the output from our Listing 3.13.
Figure 3.19. Drawing a curve
Note
The default tension is 0.5 for this overloaded version of DrawCurve.
The second form of DrawCurve is
public void DrawCurve(Pen pen,
 Point[] points,
 float tension
);
Here the tension parameter determines the shape of the curve. If the value of tension is 0.0F, the method draws a straight line between the points. The value of tension should vary between 0.0F and 1.0F.
Now let's update the example in Listing 3.13. We add a text box, a label, and a button to the form. We change the properties of these controls, and the form looks like Figure 3.20.
Figure 3.20. A curve-drawing application
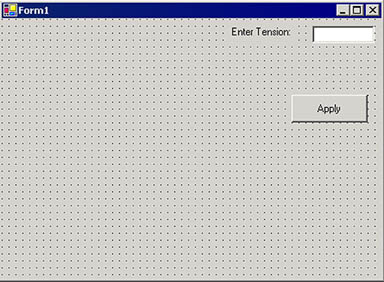
Now we will update our sample code to draw a curve using the tension value entered in the text box. We add a float type variable, tension, at the class level:
private float tension = 0.5F;
Then we update the form's paint event handler as shown in Listing 3.14. We provide tension as the third argument to the DrawCurve method.
Listing 3.14 Drawing a curve with tension
private void Form1_Paint(object sender,
 System.Windows.Forms.PaintEventArgs e)
{
 // Create a pen
 Pen bluePen = new Pen(Color.Blue, 1);
 // Create an array of points
 PointF pt1 = new PointF( 40.0F, 50.0F);
 PointF pt2 = new PointF(50.0F, 75.0F);
 PointF pt3 = new PointF(100.0F, 115.0F);
 PointF pt4 = new PointF(200.0F, 180.0F);
 PointF pt5 = new PointF(200.0F, 90.0F);
 PointF[] ptsArray =
 {
 pt1, pt2, pt3, pt4, pt5
 };
 // Draw curve
 e.Graphics.DrawCurve(bluePen, ptsArray, tension);
 // Dispose of object
 bluePen.Dispose();
}
Now we add code for the Apply button, which simply reads the text box's value and sets it as the tension, as in Listing 3.15.
Listing 3.15 The Apply button click event handler
private void ApplyBtn_Click(object sender,
System.EventArgs e)
{
 tension = (float)Convert.ToDouble(textBox1.Text);
 Invalidate();
}
If you enter "0.0" in the text box and hit Apply, the output looks like Figure 3.21, and if you enter the value "1.0" in the text box and hit Apply, the output looks like Figure 3.22.
Figure 3.21. Drawing a curve with a tension of 0.0F
Figure 3.22. Drawing a curve with a tension of 1.0F
You can also add an offset and specify a number of segments for the curve:
public void DrawCurve(
 Pen pen,
 PointF[] points,
 int offset,
 int numberOfSegments
);
The offset specifies the number of elements to skip in the array of points. The first element after the skipped elements in the array of points becomes the starting point of the curve.
The numberOfSegments property specifies the number of segments, after the starting point, to draw in the curve. It must be at least 1. The offset plus the number of segments must be less than the number of elements in the array of the points.
The following method skips the first element of the array of points and starts drawing a curve from the second point in the array, stopping after three segments:
int offset = 1;
int segments = 3;
e.Graphics.DrawCurve(bluePen, ptsArray,
 offset, segments);
The final version of DrawCurve takes a pen, points array, offset, number of segments, and tension:
public void DrawCurve(
 Pen pen,
 Point[] points,
 int offset,
 int numberOfSegments,
 float tension
);
Here's an example:
int offset = 1;
int segments = 3;
e.Graphics.DrawCurve(bluePen, ptsArray,
 offset, segments, tension);
3.2.1.10 Drawing Closed Curves
As stated earlier, a closed curve is a curve whose starting and ending points are the same. The Graphics class provides the DrawClosedCurve method to draw closed curves. It has the following overloaded forms:
- public void DrawClosedCurve(Pen, Point[]);
- public void DrawClosedCurve(Pen, PointF[]);
- public void DrawClosedCurve(Pen, Point[], float, FillMode);
- public void DrawClosedCurve(Pen, PointF[], float, FillMode);
The simplest form of DrawClosedCurve takes two parameters: a pen and an array of points. Listing 3.16 creates an array of points and a pen and calls the DrawClosedCurve method.
Listing 3.16 Drawing closed curves
private void Form1_Paint(object sender,
 System.Windows.Forms.PaintEventArgs e)
{

 // Create a pen
 Pen bluePen = new Pen(Color.Blue, 1);
 // Create an array of points
 PointF pt1 = new PointF( 40.0F, 50.0F);
 PointF pt2 = new PointF(50.0F, 75.0F);
 PointF pt3 = new PointF(100.0F, 115.0F);
 PointF pt4 = new PointF(200.0F, 180.0F);
 PointF pt5 = new PointF(200.0F, 90.0F);
 PointF[] ptsArray =
 {
 pt1, pt2, pt3, pt4, pt5
 };
 // Draw curve
 e.Graphics.DrawClosedCurve(bluePen, ptsArray);
 // Dispose of object
 bluePen.Dispose();
}
Figure 3.23 shows the output from Listing 3.16. The result is a closed curve.
Figure 3.23. Drawing a closed curve
The second form of DrawClosedCurve takes as arguments the tension of the curve and FillMode. We have already discussed tension. FillMode specifies how the interior of a closed path is filled and clipped. The FillMode enumeration represents the fill mode of graphics objects. It has two modes: Alternate (the default mode) and Winding.
As the documentation says,
To determine the interiors of a closed curve in the Alternate mode, draw a line from any arbitrary start point in the path to some point obviously outside the path. If the line crosses an odd number of path segments, the starting point is inside the closed region and is therefore part of the fill or clipping area. An even number of crossings means that the point is not in an area to be filled or clipped. An open figure is filled or clipped by using a line to connect the last point to the first point of the figure.
The Winding mode considers the direction of the path segments at each intersection. It adds one for every clockwise intersection, and subtracts one for every counterclockwise intersection. If the result is nonzero, the point is considered inside the fill or clip area. A zero count means that the point lies outside the fill or clip area.
We will clarify these definitions with examples in the discussion of paths in Chapter 9.
Listing 3.17 uses DrawClosedCurve to draw a closed curve with a tension and fill mode.
Listing 3.17 Drawing a closed curve with a tension and fill mode
// Draw curve
float tension = 0.5F;
e.Graphics.DrawClosedCurve(bluePen, ptsArray,
tension, FillMode.Alternate);
3.2.1.11 Drawing Bézier Curves
The Bézier curve, developed by Pierre Bézier in the 1960s for CAD/CAM operations, has become one of the most used curves in drawing. A Bézier curve is defined by four points: two endpoints and two control points. Figure 3.24 shows an example of a Bézier curve in which A and B are the starting and ending points and C and D are two control points.
Figure 3.24. A Bézier curve
The Graphics class provides the DrawBezier and DrawBeziers methods for drawing Bézier curves. DrawBezier draws a Bézier curve defined by four points: the starting point, two control points, and the ending point of the curve. The following example draws a Bézier curve with starting point (30, 20), ending point (140, 50), and control points (80, 60) and (120, 18).
e.Graphics.DrawBezier(bluePen, 30, 20,
 80, 60, 120, 180, 140, 50);
DrawBeziers draws a series of Bézier curves from an array of Point structures. To draw multiple beziers, you need 3x + 1 points, where x is the number of Bézier segments.
Listing 3.18 draws Bézier curves using both DrawBezier and DrawBeziers.
Listing 3.18 Drawing Bézier curves
private void Form1_Paint(object sender,
System.Windows.Forms.PaintEventArgs e)
{
 Graphics g = e.Graphics ;
 // Create pens
 Pen bluePen = new Pen(Color.Blue, 1);
 Pen redPen = new Pen(Color.Red, 1);
 // Create points for curve
 PointF p1 = new PointF(40.0F, 50.0F);
 PointF p2 = new PointF(60.0F, 70.0F);
 PointF p3 = new PointF(80.0F, 34.0F);
 PointF p4 = new PointF(120.0F, 180.0F);
 PointF p5 = new PointF(200.0F, 150.0F);
 PointF p6 = new PointF(350.0F, 250.0F);
 PointF p7 = new PointF(200.0F, 200.0F);
 PointF[] ptsArray =
 {
 p1, p2, p3, p4, p5, p6, p7
 };
 // Draw a Bézier
 e.Graphics.DrawBezier(bluePen, 30, 20,
 80, 60, 120, 180, 140, 50);
 // Draw Béziers
 e.Graphics.DrawBeziers(redPen, ptsArray);
 // Dispose of objects
 redPen.Dispose();
 bluePen.Dispose();
}
Figure 3.25 shows the output from Listing 3.18.
Figure 3.25. Drawing Bézier curves
3.2.1.12 Drawing a Polygon
A polygon is a closed shape with three or more straight sides. Examples of polygons include triangles and rectangles.
The Graphics class provides a DrawPolygon method to draw polygons. DrawPolygon draws a polygon defined by an array of points. It takes two arguments: a pen and an array of Point or PointF strucures.
To draw a polygon, an application first creates a pen and an array of points and then calls the DrawPolygon method with these parameters. Listing 3.19 draws a polygon with five points.
Listing 3.19 Drawing a polygon
private void Form1_Paint(object sender,
 System.Windows.Forms.PaintEventArgs e)
{
 Graphics g = e.Graphics ;
 // Create pens
 Pen greenPen = new Pen(Color.Green, 2);
 Pen redPen = new Pen(Color.Red, 2);
 // Create points for polygon
 PointF p1 = new PointF(40.0F, 50.0F);
 PointF p2 = new PointF(60.0F, 70.0F);
 PointF p3 = new PointF(80.0F, 34.0F);
 PointF p4 = new PointF(120.0F, 180.0F);
 PointF p5 = new PointF(200.0F, 150.0F);
 PointF[] ptsArray =
 {
 p1, p2, p3, p4, p5
 };
 // Draw polygon
 e.Graphics.DrawPolygon(greenPen,ptsArray);
 // Dispose of objects
 greenPen.Dispose();
 redPen.Dispose();
}
Figure 3.26 shows the output from Listing 3.19.
Figure 3.26. Drawing a polygon

3.2.1.13 Drawing Icons
The DrawIcon and DrawIconUnstretched methods are used to draw icons. DrawIcon draws an image represented by a specified object at the specified coordinatesstretching the image to fit, if necessary. DrawIconUnstretched draws an image represented by an Icon object without scaling the image.
DrawIcon and DrawIconUnstretched take two arguments: an Icon object and upper left corner coordinates of a rectangle. To draw an icon using these methods, an application first creates an icon and either a Rectangle object or coordinates to the upper left corner at which to draw the icon.
An Icon object represents a Windows icon. An application creates an Icon object using its constructor, which takes arguments of string, Icon, Stream, and Type. Table 3.3 describes the properties of the Icon class.
Table 3.4 describes some of the methods of the Icon class.
|
Property |
Description |
|---|---|
|
Handle |
Represents the window handle of an icon. |
|
Height |
Represents the height of an icon. |
|
Size |
Represents the size of an icon. |
|
Width |
Represents the width of an icon. |
|
Method |
Description |
|---|---|
|
Clone |
Clones an Icon object, creating a duplicate image. |
|
Save |
Saves an Icon object to the output stream. |
|
ToBitmap |
Converts an Icon object to a Bitmap object. |
Listing 3.20 draws icons. The application first creates two Icon objects, then creates a Rectangle object and calls DrawIcon and DrawIconUnstretched.
Listing 3.20 Drawing icons
Icon icon1 = new Icon("mouse.ico");
Icon icon2 = new Icon("logo.ico");
int x = 20;
int y = 50;
e.Graphics.DrawIcon(icon1, x, y);
Rectangle rect = new Rectangle(100, 200, 400, 400);
e.Graphics.DrawIconUnstretched(icon2, rect);
Figure 3.27 shows the output from Listing 3.20.
Figure 3.27. Drawing icons
3.2.1.14 Drawing Graphics Paths
A graphics path is a combination of multiple graphics shapes. For example, the graphics path in Figure 3.28 is a combination of lines, an ellipse, and a rectangle.
Figure 3.28. A path
The GraphicsPath class represents graphics paths. It provides methods to add graphics objects. For example, the AddLine, AddRectangle, AddEllipse, AddArc, AddPolygon, AddCurve, and AddBezier methods add a line, a rectangle, an ellipse, an arc, a polygon, a curve, and a Bézier curve, respectively.
GraphicsPath is defined in the System.Drawing.Drawing2D namespace. You must import this namespace using the following line:
using System.Drawing.Drawing2D;
The Graphics class provides a DrawPath method, which draws a graphics path. It takes two arguments: Pen and GraphicsPath.
To draw a graphics path, first we create a GraphicsPath object, then we add graphics shapes to the path by calling its Add methods, and finally we call DrawPath. For example, the following code creates a graphics path, adds an ellipse to the path, and draws it.
GraphicsPath graphPath = new GraphicsPath();
graphPath.AddEllipse(50, 50, 100, 150);
g.DrawPath(greenPen, graphPath);
Let's add more shapes to the graph. Listing 3.21 creates a graphics path; adds some lines, an ellipse, and a rectangle; and draws the path.
Listing 3.21 Drawing a graphics path
private void Form1_Paint(object sender,
 System.Windows.Forms.PaintEventArgs e)
{
 // Create a pen
 Pen greenPen = new Pen(Color.Green, 1);
 // Create a graphics path
 GraphicsPath path = new GraphicsPath();
 // Add a line to the path
 path.AddLine(20, 20, 103, 80);
 // Add an ellipse to the path
 path.AddEllipse(100, 50, 100, 100);
 // Add three more lines
 path.AddLine(195, 80, 300, 80);
 path.AddLine(200, 100, 300, 100);
 path.AddLine(195, 120, 300, 120);
 // Create a rectangle and call
 // AddRectangle
 Rectangle rect =
 new Rectangle(50, 150, 300, 50);
 path.AddRectangle(rect);
 // Draw path
 e.Graphics.DrawPath(greenPen, path);
 // Dispose of object
 greenPen.Dispose();
}
Figure 3.29 shows the output from Listing 3.21.
Figure 3.29. Drawing a path
3.2.1.15 Drawing Pie Shapes
A pie is a slice of an ellipse. A pie shape also consists of two radial lines that intersect with the endpoints of the arc. Figure 3.30 shows an ellipse with four pie shapes.
Figure 3.30. Four pie shapes of an ellipse
The Graphics class provides the DrawPie method, which draws a pie shape defined by an arc of an ellipse. The DrawPie method takes a Pen object, a Rectangle or RectangleF object, and two radial angles.
Let's create an application that draws pie shapes. We create a Windows application and add two text boxes and a button control to the form. The final form looks like Figure 3.31.
Figure 3.31. A pie shapedrawing application
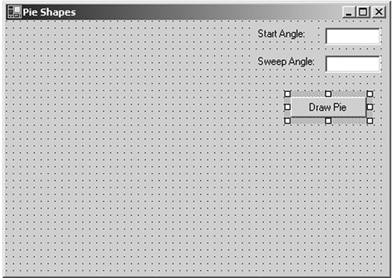
The Draw Pie button will draw a pie shape based on the values entered in the Start Angle and Sweep Angle text boxes. Listing 3.22 shows the code for the Draw Pie button click event handler.
Listing 3.22 Drawing a pie shape
private void DrawPieBtn_Click(object sender,
 System.EventArgs e)
{
 // Create a Graphics object
 Graphics g = this.CreateGraphics();
 g.Clear(this.BackColor);
 // Get the current value of start and sweep
 // angles
 float startAngle =
 (float)Convert.ToDouble(textBox1.Text);
 float sweepAngle =
 (float)Convert.ToDouble(textBox2.Text);
 // Create a pen
 Pen bluePen = new Pen(Color.Blue, 1);
 // Draw pie
 g.DrawPie( bluePen, 20, 20, 100, 100,
 startAngle, sweepAngle);
 // Dispose of objects
 bluePen.Dispose();
 g.Dispose();
}
Now let's run the pie shapedrawing application and enter values for the start and sweep angles. Figure 3.32 shows a pie for start and sweep angles of 0.0 and 90 degrees, respectively.
Figure 3.32. A pie shape with start angle of 0 degrees and sweep angle of 90 degrees
Figure 3.33 shows a pie for start and sweep angles of 45.0 and 180.0 degrees, respectively.
Figure 3.33. A pie shape with start angle of 45 degrees and sweep angle of 180 degrees
Figure 3.34 shows a pie for start and sweep angles of 90.0 and 45.0 degrees, respectively.
Figure 3.34. A pie shape with start angle of 90 degrees and sweep angle of 45 degrees
Note
We will see a real-world pie chart application in Section 3.4.
3.2.1.16 Drawing Images
The Graphics class also provides functionality for drawing images, using DrawImage and DrawImageUnscaled. DrawImage draws an Image object with a specified size, and DrawImageUnscaled draws an Image object without scaling it. The DrawImage method has many overloaded forms.
Note
Here we discuss simple images. Chapters 7 and 8 discuss the Image class, its members, and imaging-related functionality in detail.
An application creates an Image object by calling the Image class's static FromFile method, which takes a file name as an argument. After that you create the coordinates of a rectangle in which to draw the image and call DrawImage. Listing 3.23 draws an image on the surface with a size of ClientRectangle.
Listing 3.23 Drawing an image
private void Form1_Paint(object sender,
 System.Windows.Forms.PaintEventArgs e)
{

 try
 {
 // Create an image from a file
 Image newImage =
 Image.FromFile("dnWatcher.gif");

 // Draw image
 e.Graphics.DrawImage(newImage,
 this.ClientRectangle);
 newImage.Dispose();
 }
 catch (Exception ex)
 {
 MessageBox.Show(ex.Message.ToString());
 }
}
Figure 3.35 shows the output from Listing 3.23.
Figure 3.35. Drawing an image

3.2.2 Fill Methods
So far we have seen only the draw methods of the Graphics class. As we discussed earlier, pens are used to draw the outer boundary of graphics shapes, and brushes are used to fill the interior of graphics shapes. In this section we will cover the Fill methods of the Graphics class. You can fill only certain graphics shapes; hence there are only a few Fill methods available in the Graphics class. Table 3.5 lists them.
3.2.2.1 The FillClosedCurve Method
FillClosedCurve fills the interior of a closed curve. The first parameter of FillClosedCurve is a brush. It can be a solid brush, a hatch brush, or a gradient brush. Brushes are discussed in more detail in Chapter 4. The second parameter is an array of points. The third and fourth parameters are optional. The third parameter is a fill mode, which is represented by the FillMode enumeration. The fourth and last optional parameter is the tension of the curve, which we discussed in Section 3.2.1.10.
The FillMode enumeration specifies the way the interior of a closed path is filled. It has two modes: alternate or winding. The values for alternate and winding are Alternate and Winding, respectively. The default mode is Alternate. The fill mode matters only if the curve intersects itself (see Section 3.2.1.10).
To fill a closed curve using FillClosedCurve, an application first creates a Brush object and an array of points for the curve. The application can then set the fill mode and tension (which is optional) and call FillClosedCurve.
Listing 3.24 creates an array of PointF structures and a SolidBrush object, and calls FillClosedCurve.
Listing 3.24 Using FillClosedCurve to fill a closed curve
private void Form1_Paint(object sender,
 System.Windows.Forms.PaintEventArgs e)
{
 // Create an array of points
 PointF pt1 = new PointF( 40.0F, 50.0F);
 PointF pt2 = new PointF(50.0F, 75.0F);
 PointF pt3 = new PointF(100.0F, 115.0F);
 PointF pt4 = new PointF(200.0F, 180.0F);
 PointF pt5 = new PointF(200.0F, 90.0F);
 PointF[] ptsArray =
 {
 pt1, pt2, pt3, pt4, pt5
 };
 // Fill a closed curve
 float tension = 1.0F;
 FillMode flMode = FillMode.Alternate;
 SolidBrush blueBrush = new SolidBrush(Color.Blue);
 e.Graphics.FillClosedCurve(blueBrush, ptsArray,
 flMode, tension);
 // Dispose of object
 blueBrush.Dispose();
}
|
Method |
Description |
|---|---|
|
FillClosedCurve |
Fills the interior of a closed cardinal spline curve defined by an array of Point structures. |
|
FillEllipse |
Fills the interior of an ellipse defined by a bounding rectangle specified by a pair of coordinates, a width, and a height. |
|
FillPath |
Fills the interior of a GraphicsPath object. |
|
FillPie |
Fills the interior of a pie section defined by an ellipse specified by a pair of coordinates, a width, a height, and two radial lines. |
|
FillPolygon |
Fills the interior of a polygon defined by an array of points specified by Point structures. |
|
FillRectangle |
Fills the interior of a rectangle specified by a pair of coordinates, a width, and a height. |
|
FillRectangles |
Fills the interiors of a series of rectangles specified by Rectangle structures. |
|
FillRegion |
Fills the interior of a Region object. |
Figure 3.36 shows the output from Listing 3.24.
Figure 3.36. Filling a closed curve
3.2.2.2 The FillEllipse Method
FillEllipse fills the interior of an ellipse. It takes a Brush object and rectangle coordinates.
To fill an ellipse using FillEllipse, an application creates a Brush and a rectangle and calls FillEllipse. Listing 3.25 creates three brushes and calls FillEllipse to fill an ellipse with a brush.
Listing 3.25 Filling ellipses
private void Form1_Paint(object sender,
 System.Windows.Forms.PaintEventArgs e)
{
 Graphics g = e.Graphics ;
 // Create brushes
 SolidBrush redBrush = new SolidBrush(Color.Red);
 SolidBrush blueBrush = new SolidBrush(Color.Blue);
 SolidBrush greenBrush = new SolidBrush(Color.Green);
 // Create a rectangle
 Rectangle rect =
 new Rectangle(80, 80, 50, 50);
 // Fill ellipses
 g.FillEllipse(greenBrush,
 40.0F, 40.0F, 130.0F, 130.0F );
 g.FillEllipse(blueBrush, 60, 60, 90, 90);
 g.FillEllipse(redBrush, rect );
 g.FillEllipse(greenBrush,
 100.0F, 90.0F, 10.0F, 30.0F );
 // Dispose of objects
 blueBrush.Dispose();
 redBrush.Dispose();
 greenBrush.Dispose();
}
Figure 3.37 shows the output from Listing 3.25.
Figure 3.37. Filling ellipses
3.2.2.3 The FillPath Method
FillPath fills the interior of a graphics path. To do this, an application creates Brush and GraphicsPath objects and then calls FillPath, which takes a brush and a graphics path as arguments. Listing 3.26 creates GraphicsPath and SolidBrush objects and calls FillPath.
Listing 3.26 Filling a graphics path
private void Form1_Paint(object sender,
 System.Windows.Forms.PaintEventArgs e)
{
 // Create a solid brush
 SolidBrush greenBrush =
 new SolidBrush(Color.Green);
 // Create a graphics path
 GraphicsPath path = new GraphicsPath();
 // Add a line to the path
 path.AddLine(20, 20, 103, 80);
 // Add an ellipse to the path
 path.AddEllipse(100, 50, 100, 100);
 // Add three more lines
 path.AddLine(195, 80, 300, 80);
 path.AddLine(200, 100, 300, 100);
 path.AddLine(195, 120, 300, 120);

 // Create a rectangle and call
 // AddRectangle
 Rectangle rect =
 new Rectangle(50, 150, 300, 50);
 path.AddRectangle(rect);
 // Fill path
 e.Graphics.FillPath(greenBrush, path);
 // Dispose of object
 greenBrush.Dispose();
}
Figure 3.38 shows the output from Listing 3.26. As the figure shows, the fill method fills all the covered areas of a graphics path.
Figure 3.38. Filling a graphics path
3.2.2.4 The FillPie Method
FillPie fills a pie section with a specified brush. It takes four parameters: a brush, the rectangle of the ellipse, and the start and sweep angles. The following code calls FillPie.
g.FillPie(new SolidBrush(Color.Red),
0.0F, 0.0F, 100, 60, 0.0F, 90.0F);
We will discuss the FillPie method in the pie chart application in Section 3.4.
3.2.2.5 The FillPolygon Method
FillPolygon fills a polygon with the specified brush. It takes three parameters: a brush, an array of points, and a fill mode. The FillMode enumeration defines the fill mode of the interior of the path. It provides two fill modes: Alternate and Winding. The default mode is Alternate.
In our application we will use a hatch brush. So far we have seen only a solid brush. A solid brush is a brush with one color only. A hatch brush is a brush with a hatch style and two colors. These colors work together to support the hatch style. The HatchBrush class represents a hatch brush. We will discuss hatch brushes in more detail in Chapter 4.
The code in Listing 3.27 uses FillPolygon to fill a polygon using the Winding mode.
Listing 3.27 Filling a polygon
Graphics g = e.Graphics ;
// Create a solid brush
SolidBrush greenBrush =
 new SolidBrush(Color.Green);
// Create points for polygon
PointF p1 = new PointF(40.0F, 50.0F);
PointF p2 = new PointF(60.0F, 70.0F);
PointF p3 = new PointF(80.0F, 34.0F);
PointF p4 = new PointF(120.0F, 180.0F);
PointF p5 = new PointF(200.0F, 150.0F);
PointF[] ptsArray =
{
 p1, p2, p3, p4, p5
};
// Draw polygon
e.Graphics.FillPolygon(greenBrush, ptsArray);
// Dispose of object
greenBrush.Dispose();
Figure 3.39 shows the output from Listing 3.27. As you can see, the fill method fills all the areas of a polygon.
Figure 3.39. Filling a polygon
3.2.2.6 Filling Rectangles and Regions
FillRectangle fills a rectangle with a brush. This method takes a brush and a rectangle as arguments. FillRectangles fills a specified series of rectangles with a brush, and it takes a brush and an array of rectangles. These methods also have overloaded forms with additional options. For instance, if you're using a HatchStyle brush, you can specify background and foreground colors. Chapter 4 discusses FillRectangle and its options in more detail.
Note
The HatchBrush class is defined in the System.Drawing.Drawing2D namespace.
The source code in Listing 3.28 uses FillRectangle to fill two rectangles. One rectangle is filled with a hatch brush, the other with a solid brush.
Listing 3.28 Filling rectangles
private void Form1_Paint(object sender,
 System.Windows.Forms.PaintEventArgs e)
{
 // Create brushes
 SolidBrush blueBrush = new SolidBrush(Color.Blue);
 // Create a rectangle
 Rectangle rect = new Rectangle(10, 20, 100, 50);
 // Fill rectangle
 e.Graphics.FillRectangle(new HatchBrush
 (HatchStyle.BackwardDiagonal,
 Color.Yellow, Color.Black),
 rect);
 e.Graphics.FillRectangle(blueBrush,
 new Rectangle(150, 20, 50, 100));

 // Dispose of object
 blueBrush.Dispose();
}
Figure 3.40 shows the output from Listing 3.28.
Figure 3.40. Filling rectangles
FillRegion fills a specified region with a brush. This method takes a brush and a region as input parameters. Listing 3.29 creates a Region object from a rectangle and calls FillRegion to fill the region.
Listing 3.29 Filling regions
Rectangle rect = new Rectangle(20, 20, 150, 100);
Region rgn = new Region(rect);
e.Graphics.FillRegion(new SolidBrush(Color.Green)
, rgn);
Note
Chapter 6 discusses rectangles and regions in more detail.
3.2.3 Miscellaneous Graphics Class Methods
The Graphics class provides more than just draw and fill methods. Miscellaneous methods are defined in Table 3.6. Some of these methods are discussed in more detail later.
3.2.3.1 The Clear Method
The Clear method clears the entire drawing surface and fills it with the specified background color. It takes one argument, of type Color. To clear a form, an application passes the form's background color. The following code snippet uses the Clear method to clear a form.
form.Graphics g = this.CreateGraphics();
g.Clear(this.BackColor);
g.Dispose();
|
Method |
Description |
|---|---|
|
AddMetafileComment |
Adds a comment to a Metafile object. |
|
Clear |
Clears the entire drawing surface and fills it with the specified background color. |
|
ExcludeClip |
Updates the clip region to exclude the area specified by a Rectangle structure. |
|
Flush |
Forces execution of all pending graphics operations and returns immediately without waiting for the operations to finish. |
|
FromHdc |
Creates a new Graphics object from a device context handle. |
|
FromHwnd |
Creates a new Graphics object from a window handle. |
|
FromImage |
Creates a new Graphics object from an Image object. |
|
GetHalftonePalette |
Returns a handle to the current Windows halftone palette. |
|
GetHdc |
Returns the device context handle associated with a Graphics object. |
|
GetNearestColor |
Returns the nearest color to the specified Color structure. |
|
IntersectClip |
Updates the clip region of a Graphics object to the intersection of the current clip region and a Rectangle structure. |
|
IsVisible |
Returns true if a point is within the visible clip region. |
|
MeasureCharacterRanges |
Returns an array of Region objects, each of which bounds a range of character positions within a string. |
|
MeasureString |
Measures a string when drawn with the specified Font object. |
|
MultiplyTransform |
Multiplies the world transformation and the Matrix object. |
|
ReleaseHdc |
Releases a device context handle obtained by a previous call to the GetHdc method. |
|
ResetClip |
Resets the clip region to an infinite region. |
|
ResetTransform |
Resets the world transformation matrix to the identity matrix. |
|
Restore |
Restores the state of a Graphics object to the state represented by a GraphicsState object. Takes GraphicsState as input, removes the information block from the stack, and restores the Graphics object to the state it was in when it was saved. |
|
RotateTransform |
Applies rotation to the transformation matrix. |
|
Save |
Saves the information block of a Graphics object. The information block stores the state of the Graphics object. The Save method returns a GraphicsState object that identifies the information block. |
|
ScaleTransform |
Applies the specified scaling operation to the transformation matrix. |
|
SetClip |
Sets the clipping region to the Clip property. |
|
TransformPoints |
Transforms an array of points from one coordinate space to another using the current world and page transformations. |
|
TranslateClip |
Translates the clipping region by specified amounts in the horizontal and vertical directions. |
|
TranslateTransform |
Prepends the specified translation to the transformation matrix. |
3.2.3.2 The MeasureString Method
MeasureString measures a string when it is drawn with a Font object and returns the size of the string as a SizeF object. You can use SizeF to find out the height and width of string.
MeasureString can also be used to find the total number of characters and lines in a string. It has seven overloaded methods. It takes two required parameters: the string and font to measure. Optional parameters you can pass include the width of the string in pixels, maximum layout area of the text, string format, and combinations of these parameters.
Note
Chapter 5 discusses string operations in detail.
Listing 3.30 uses the MeasureString method to measure a string's height and width and draws a rectangle and a circle around the string. This example also shows how to find the total number of lines and characters of a string.
Listing 3.30 Using the MeasureString method
Graphics g = Graphics.FromHwnd(this.Handle);
g.Clear(this.BackColor);

string testString = "This is a test string";
Font verdana14 = new Font("Verdana", 14);
Font tahoma18 = new Font("Tahoma", 18);
int nChars;
int nLines;

// Call MeasureString to measure a string
SizeF sz = g.MeasureString(testString, verdana14);
string stringDetails = "Height: "+sz.Height.ToString()
+ ", Width: "+sz.Width.ToString();
MessageBox.Show("First string details: "+ stringDetails);
g.DrawString(testString, verdana14, Brushes.Green,
new PointF(0, 100));
g.DrawRectangle(new Pen(Color.Red, 2), 0.0F, 100.0F,
sz.Width, sz.Height);
sz = g.MeasureString("Ellipse", tahoma18,
new SizeF(0.0F, 100.0F), new StringFormat(),
out nChars, out nLines);
stringDetails = "Height: "+sz.Height.ToString()
+ ", Width: "+sz.Width.ToString()
+ ", Lines: "+nLines.ToString()
+ ", Chars: "+nChars.ToString();
MessageBox.Show("Second string details: "+ stringDetails);

g.DrawString("Ellipse", tahoma18, Brushes.Blue,
new PointF(10, 10));
g.DrawEllipse( new Pen(Color.Red, 3), 10, 10,
sz.Width, sz.Height);g.Dispose()
Figure 3.41 shows the output from Listing 3.30.
Figure 3.41. Using MeasureString when drawing text
3.2.3.3 The FromImage, FromHdc, and FromHwnd Methods
As we discussed earlier, an application can use Graphics class members to get a Graphics object. The Graphics class provides three methods to create a Graphics object: FromHwnd, FromHdc, and FromImage.
FromImage takes an Image object as input parameter and returns a Graphics object. We will discuss FromImage in more detail in Chapters 7 and 8. The following code snippet creates a Graphics object from an Image object. Once a Graphics object has been created, you can call its members.
Image img = Image.FromFile("Rose.jpg");
Graphics g = Graphics.FromImage(img);
// Do something
g.Dispose();
Note
Make sure you call the Dispose method of the Graphics object when you're finished with it.
FromHdc creates a Graphics object from a window handle to a device context. The following code snippet shows an example in which FromHdc takes one parameter, of type IntPtr.
IntPtr hdc = e.Graphics.GetHdc();
Graphics g= Graphics.FromHdc(hdc);
// Do something
e.Graphics.ReleaseHdc(hdc);
g.Dispose();
Note
You need to call the ReleaseHdc method to release resources allocated by a window handle to a device context, and also make sure you call the Dispose method of the Graphics object when you're finished with it.
FromHwnd returns a Graphics object for a form. The following method takes a window handle.
Graphics g = Graphics.FromHwnd(this.Handle);
To draw on a form, an application can pass this handle. Once an application has a Graphics object, it can call any Graphics class method to draw graphics objects.
GDI+: The Next-Generation Graphics Interface
- GDI+: The Next-Generation Graphics Interface
- Understanding GDI+
- Exploring GDI+ Functionality
- GDI+ from a GDI Perspective
- GDI+ Namespaces and Classes in .NET
- Summary
Your First GDI+ Application
- Your First GDI+ Application
- Drawing Surfaces
- The Coordinate System
- Tutorial: Your First GDI+ Application
- Some Basic GDI+ Objects
The Graphics Class
- The Graphics Class
- Graphics Class Properties
- Graphics Class Methods
- The GDI+Painter Application
- Drawing a Pie Chart
Working with Brushes and Pens
- Working with Brushes and Pens
- Understanding and Using Brushes
- Using Pens in GDI+
- Transformation with Pens
- Transformation with Brushes
- System Pens and System Brushes
- A Real-World Example: Adding Colors, Pens, and Brushes to the GDI+Painter Application
Colors, Fonts, and Text
- Colors, Fonts, and Text
- Accessing the Graphics Object
- Working with Colors
- Working with Fonts
- Working with Text and Strings
- Rendering Text with Quality and Performance
- Advanced Typography
- A Simple Text Editor
- Transforming Text
Rectangles and Regions
- Rectangles and Regions
- The Rectangle Structure
- The Region Class
- Regions and Clipping
- Clipping Regions Example
- Regions, Nonrectangular Forms, and Controls
Working with Images
- Working with Images
- Raster and Vector Images
- Working with Images
- Manipulating Images
- Playing Animations in GDI+
- Working with Bitmaps
- Working with Icons
- Skewing Images
- Drawing Transparent Graphics Objects
- Viewing Multiple Images
- Using a Picture Box to View Images
- Saving Images with Different Sizes
Advanced Imaging
- Advanced Imaging
- Rendering Partial Bitmaps
- Working with Metafiles
- Color Mapping Using Color Objects
- Image Attributes and the ImageAttributes Class
- Encoder Parameters and Image Formats
Advanced 2D Graphics
- Advanced 2D Graphics
- Line Caps and Line Styles
- Understanding and Using Graphics Paths
- Graphics Containers
- Reading Metadata of Images
- Blending Explained
- Alpha Blending
- Miscellaneous Advanced 2D Topics
Transformation
- Transformation
- Coordinate Systems
- Transformation Types
- The Matrix Class and Transformation
- The Graphics Class and Transformation
- Global, Local, and Composite Transformations
- Image Transformation
- Color Transformation and the Color Matrix
- Matrix Operations in Image Processing
- Text Transformation
- The Significance of Transformation Order
Printing
- Printing
- A Brief History of Printing with Microsoft Windows
- Overview of the Printing Process
- Your First Printing Application
- Printer Settings
- The PrintDocument and Print Events
- Printing Text
- Printing Graphics
- Print Dialogs
- Customizing Page Settings
- Printing Multiple Pages
- Marginal Printing: A Caution
- Getting into the Details: Custom Controlling and the Print Controller
Developing GDI+ Web Applications
- Developing GDI+ Web Applications
- Creating Your First ASP.NET Web Application
- Your First Graphics Web Application
- Drawing Simple Graphics
- Drawing Images on the Web
- Drawing a Line Chart
- Drawing a Pie Chart
GDI+ Best Practices and Performance Techniques
- GDI+ Best Practices and Performance Techniques
- Understanding the Rendering Process
- Double Buffering and Flicker-Free Drawing
- Understanding the SetStyle Method
- The Quality and Performance of Drawing
GDI Interoperability
Miscellaneous GDI+ Examples
- Miscellaneous GDI+ Examples
- Designing Interactive GUI Applications
- Drawing Shaped Forms and Windows Controls
- Adding Copyright Information to a Drawn Image
- Reading and Writing Images to and from a Stream or Database
- Creating Owner-Drawn List Controls
Appendix A. Exception Handling in .NET
