Concentrator Tools
In the first half of the chapter I'll focus on the Monitoring screens of the concentrator, which up to this point haven't really been discussed. The Monitoring screens allow you to view status and statistical information about what is currently happening on the concentrator, in addition to what has happened previously.
When you click Monitoring, you can view the concentrator's status, the status of VPN and administrative sessions, statistics, and event logs. Each of these screens, with the exception of the Live Event Log, display read-only statistics. By default, the statistics on the screen are not updated automatically. Instead, you must click the Refresh icon in the top right corner of the window to update the contents on these other screens.
Note
You can change your screen update options by going to the Administration > Monitoring Refresh screen. This was discussed in the last chapter, "Concentrator Management."
When you go to the Monitoring screen, you can access the following monitoring options, which take you to different monitoring screens:
- Routing Table View the current routing table entries (static and dynamic).
- Dynamic Filters View the filters applied to VPN remote access user connections that were retrieved from an AAA RADIUS server during IKE Mode Config.
- Filterable Event Log View the log file of events stored in the concentrator's Flash memory; these events are buffered up by the concentrator over a period of time, similar to a Cisco router's or PIX's logging buffered feature.
- Live Event Log View the current events as they occur on the concentrator; these events are similar to using the debug feature on a Cisco router or PIX or ASA security appliance.
- System Status View the installed software revision, the uptime, and status of the concentrator, including its front-panel LEDs.
- Sessions View the current sessions on the concentrator, including VPN and administrative sessions; these can be sorted by type, amount of data transmitted, duration of the connections, or throughput of the connections.
- Statistics View various statistics on the concentrator. These include VPN, administrative, Layer-2, Layer-3, and service statistics.
The following sections will discuss some of the more important monitoring screens, listed above, in more depth.
System Status
To view the status of the concentrator, go to Monitoring > System Status, where you'll see the screen shown in Figure 11-1. At the top of the screen, you can see the concentrator type (3005), the boot code revision (2.2), the software version (4.1.7A), how long the concentrator has been up (53 minutes, 28 seconds), the date and time the concentrator was either powered up or restarted (01/12/2005 14:06:54), and the amount of RAM (32 MB). For concentrators shipped in the last 45 years, you should also see the concentrator's serial number.
Figure 11-1. System Status Screen
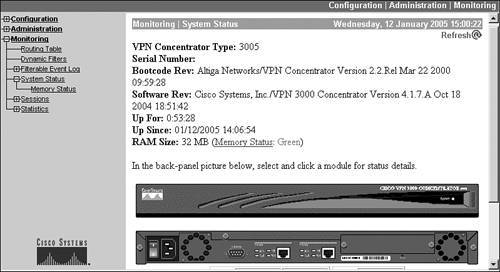
Below this is a picture of the front and rear of the concentrator, where the actual LED colors will be displayed depending on what is currently showing on the physical concentrator itself (this includes the meter bar on the front of the 3015 and higher concentrators). On the rear of the concentrator chassis, you can click the interfaces and power receptacle, which will display simple status statistics of these components; for example, the number of frames entering and exiting an interface, and the voltage status of the CPU and motherboard.
Even though you can't see these in Figure 11-1, below the chassis of the concentrator are two more important pieces of information: the status of the fans and temperature, and a graphic of the meter bar. For the two fans, you can see the current RPM at which the fans are running. For the temperature, you can view it in Fahrenheit and Celsius. Below this is a graphic of the meter bar found on the front of the concentrator (with the exception of the 3005). However, even with the 3005, you can view these three meter bar representations CPU utilization, active sessions, and data throughputfrom this screen. Remember that this screen is static, so you'll have to click the Refresh icon at the top of the window to update the information you see on this screen.
VPN Sessions
To view the sessions terminated on the concentrator, go to Monitoring > Sessions. You can see the top and bottom parts of this screen in Figures 11-2 and 11-3. At the top part of the screen, you can qualify the sessions you see by choosing a specific group name or viewing all sessions by choosing "All," which is the default. Below this, the screen is broken into four sections:
- Session Summary
- LAN-to-LAN Sessions
- Remote Access Sessions
- Management Sessions
Figure 11-2. Sessions Screen: Top Part
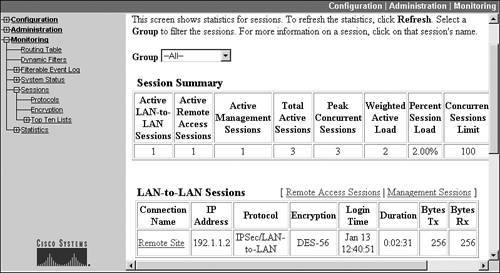
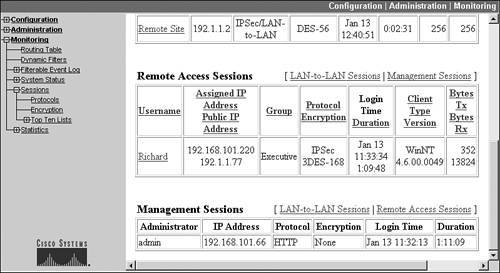
Figure 11-3. Sessions Screen: Bottom Part
The following sections will describe the above four sessions, and three additional sub-screens you can view that summarize session statistics.
Session Summary Table
The Session Summary table at the top of Figure 11-2 displays summarized totals for the LAN-to-LAN, remote access, and management sessions terminated on the concentrator.
Note
Please note that these are not connections, but sessions. For example, an IPsec session has three connections: one for ISAKMP/IKE Phase 1 (management) and two for ISAKMP/IKE Phase 2 (data); the concentrator treats these as a single logical session.
There are two columns you should keep an eye on: Peak Concurrent Sessions (the highest number of active sessions at any point in time since the concentrator was last booted) and Concurrent Sessions Limit (the license limit of the concentrator for remote access sessions or what you've artificially lowered this limit to, as I mentioned in Chapter 10 in the load balancing section of the chapter). If the number of peak sessions is getting close to the license limit, you might want to think about upgrading to a larger concentrator or buying an additional one and clustering the two together. In Figure 11-2, the peak is 3 and the license limit is 100.
LAN-to-LAN Sessions Table
The LAN-to-LAN Sessions table at the bottom of Figure 11-2 shows the currently connected L2L sessions to the concentrator. In this example, there is only one called "Remote Site," where:
- The remote end has an IP address of 192.1.1.2
- DES-56 is the encryption algorithm
- The connection was built on January 13 at 12:40:51
- The connection has been up for 2 minutes, 31 seconds
- 256 bytes has been sent and received on the ISAKMP/IKE Phase 2 data connections
The "Remote Site" name is a hyperlink (this is the name of the L2L session); if you click this hyperlink, it will take you to the screen showing the detailed statistics for the three IPsec connections, shown in Figures 11-4 (top of screen) and 11-5 (bottom of screen).
Figure 11-4. Session Detail Screen: Top Part
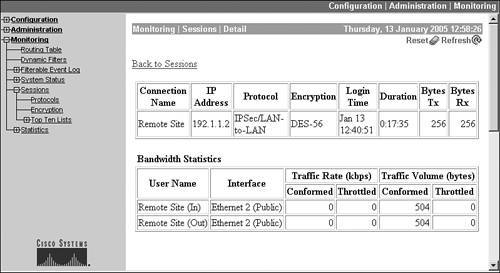
Figure 11-5. Session Detail Screen: Bottom Part
At the top of the screen in Figure 11-4 is the same information found from the LAN-to-LAN Sessions table in Figure 11-2. Below this, you can see the bandwidth management statistics applicable to this sessionyou'll see this only if you have bandwidth management enabled for the interface that this session is terminated on, or for the session itself. In this example, all traffic has conformed to the bandwidth management policy.
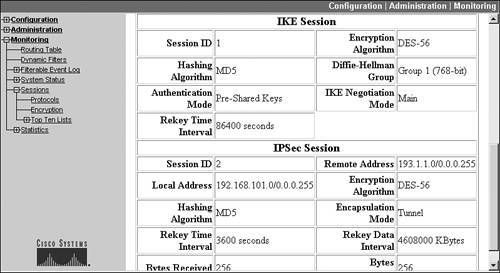
At the bottom of the screen (Figure 11-5) you can see two sectionsIKE Session and IPsec Sessionwhich display details about how each of the connections is protected and statistical information about the connections.
Remote Access Sessions Table
The top part of Figure 11-3, from Monitoring > Sessions, shows the summary of remote access sessions terminated on the concentrator. This would include IPsec, PPTP, L2TP/ IPsec, and WebVPN sessions. In Figure 11-3, there is currently one remote access session active, called "Richard." Sessions are always listed based on the username the user supplied during user authentication. Other information for this table entry includes:
- The user's assigned internal address is 192.168.101.220 and his NIC address is 192.1.1.77.
- The user belongs to the "Executive" group.
- The session is using IPsec and 3DES to protect the user's data.
- The user connected on January 13 at 11:33:34 and has been connected for 1 hour, 9 minutes, and 48 seconds.
- The user is using a Cisco VPN 4.6 client on a Windows NT (in this case 2000) platform.
- The user has transmitted and received 352 and 18,608 bytes, respectively.
As in the LAN-to-LAN Session table, you can click the name of the user, taking you to a screen with the details of the connection. This screen is similar to the one shown in Figures 11-4 and 11-5.
Management Sessions Table
The Management Sessions table shown at the bottom of Figure 11-3 (from Monitoring > Sessions) displays the administrative users that are currently logged in. In this example, one user logged in to the "admin" account from 192.168.101.66 using a web browser ("HTTP") on January 13 at 11:32:13 and has been logged in for 1 hour, 11 minutes, and 9 seconds.
Tip
As mentioned in Chapter 10, I highly recommend that you change the name of the admin account to reduce the likelihood of someone attempting to break into your concentrator using this well-known account name.
Note
You can also go to the Administration > Administer Sessions screen and see the same information found on the Monitoring > Sessions screen; however, there are two additional options available to you under the Administer Sessions screen:
- You can log out (disconnect) a session or sessions
- You can ping a device for a listed session
Additional Monitoring > Sessions Screens
There are three additional sub-screens you can go to under the Monitoring > Sessions screens:
- Protocols Breaks out the number of sessions by protocol, such as IPsec (remote access), HTTP (administrative), and WebVPN, giving you an overall view of the types of sessions currently terminated on the concentrator.
- Encryption Breaks out the number of sessions, by the type of encryption algorithm used, such as DES-56, RC4-40, AES-128, and 3DES-168 SSLv3 (WebVPN), giving you an overall view of the encryption algorithms used by the various sessions terminated on the concentrator.
- Top Ten Lists Provides three additional screens that show an overview of the use of the concentrator. These can help you figure out which session is transmitting the most data or has been connected the longest:
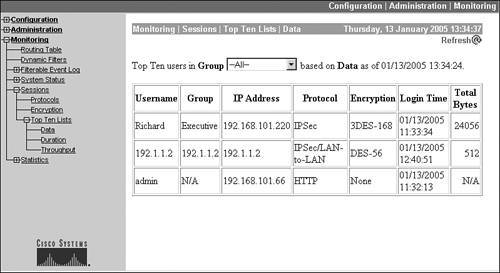
- Data The top ten sessions sorted by the amount of data transmitted. Figure 11-6 shows an example of this screen, where the top session is the remote access session "Richard," which has transferred 24,056 bytes. This screen, for example, can be useful in determining which session is using the most total bandwidth; however, note that this is measured since the user connected, and is not an average rate.
Figure 11-6. Top Ten List: Data
- Duration The top ten sessions sorted by the length of time they were connected.
- Throughput The top ten sessions sorted on their throughput (bytes per second). You can use these measurements to see, on average, who is consuming the most bandwidth.
Event Logs
One of the most powerful and useful features on the concentrator is its logging and troubleshooting capabilities. You can control the granularity of how much detail you want when capturing logging events, and then you can display the events in several ways. The following sections will cover the setup and use of logging on the concentrator.
Date and Time for Logging Events
One of the first configuration steps you'll want to perform when setting up your concentrator for logging is to ensure that it has the correct date and time, which is obviously helpful when troubleshooting problems. You can do this manually or you can configure the use of an NTP server. The following two sections discuss both of these methods.
Manual Date and Time Configuration
To configure the date and time on your concentrator manually, go to Configuration > System > General > Time and Date. Here you can configure the date, time, time zone, and Daylight Saving Time values. Click the Apply button to accept your changes. Upon changing the time, any new events will use the time based on your new configuration.
Network Time Protocol
Setting up NTP is a two-step process:
|
1. |
Set the polling period the concentrator will use to contact the NTP server. |
|
2. |
Define the necessary information for the concentrator to contact the NTP server to obtain the current time. |
To set the polling period of when to contact the NTP server, go to Configuration > System > Servers > NTP > Parameters. The default polling period frequency is 60 minutes. This value can range from 0 (disabling NTP) to 10,080 minutes (once a week).
To define your NTP servers, go to Configuration > System > Servers > NTP > Hosts. Click the Add button to add a new server. Enter the IP address of the NTP server and click the Add button. The order in which you add your servers is the order the concentrator uses when contacting them; therefore, the first server added becomes the primary time source.
Caution
As of 4.7, NTP Version 3, which supports authentication of NTP messages, is not supported by the concentrator, and thus the concentrator is susceptible to spoofed NTP replies. Therefore, I highly recommend that you use your own NTP server, located off the private interface of the concentrator, and that the traffic between it and the concentrator be protected. You'll also want to do this for other traffic, such as syslog, SNMP, or TFTP. In this situation, I would create a special LAN segment with only these devices on it, and would set up an IPsec L2L session between the Layer-3 device connected to this segment and the concentrator's private interface. Using this arrangement, with proper filtering on the LAN segment Layer-3 device, will reduce your exposure to spoofing, eavesdropping, or any other type of attack.
Event Classes and Logging Levels
Once you have configured your settings for the date and time, you now are ready to set up the concentrator's event classes. An event class controls the amount and detail of logging information generated for a particular type of event. Each event supports 13 levels of logging, where levels 16 are normal logging levels, 79 are debug level, and 1013 are hex dumps. In other words, level 1 gives you the least amount of information about an event and level 13 the most.
All events have a default logging level assigned to them. You can change this globally for a logging method (for example, the Live Event log or a syslog server) or you can change each event individuallythis is a much more powerful feature than a Cisco router or PIX or ASA security appliance, where you can configure only the former and not the latter.
Logging destinations supported by the concentrator include:
- Console(commonly called the Live Event Log) Events are displayed in a near real-time fashion on a concentrator's Monitoring screen).
- Log Events are stored in a file in Flash memory.
- Syslog Sends events to a syslog server.
- E-mail Sends events to an e-mail account.
- SNMP trap Sends events, via traps, to an SNMP management station.
Default Logging Configuration
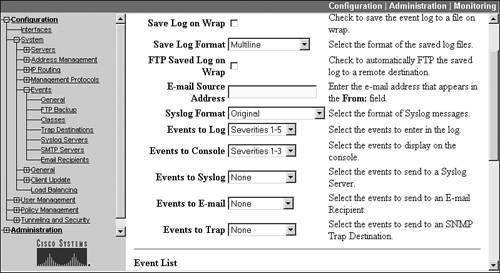
All logging destinations have default logging levels assigned to events. These can be changed by going to Configuration > System > Events > General. From this screen you can control the level of logging on a per-destination, but not per-event basis. Figure 11-7 shows the top part of this screen. Here is an explanation of the parameters you can configure on this screen:
Figure 11-7. Default Event Configuration
- Save Log on Wrap The 3005 event log stores 256 events while the other concentrators store 2,048 events; whenever the log file is full, the concentrator automatically overwrites older events. If you choose this option, when the log file reaches its event limit, the log file with the older events is stored in Flash memory and is called LOGxxxxx.txt, where xxxxxx starts with 000001 and can reach 999999. You can access this file by going to Administration > File Management.
Each of these log files requires about 334 KB of Flash memory. The concentrator will then start storing events in a new log file. If the concentrator only has 2.56 MB of space left in Flash, it will delete old log files automatically to make room for new ones. If there are no log files to delete, the save operation will fail and will generate an event about this problem. If you reboot the concentrator or if the concentrator crashes, the concentrator will save the log file, called "SAVELOG.TXT," to Flashif this file exists, it is automatically overwritten. You can access this file by going to Administration > File Management.
- Save Log Format This parameter specifies how to create the event entry. "Multiline" specifies that each event appears on one or more 80-character lines; "Comma Delimited" specifies that each event is on a separate line, and each field in the event is separated by a comma; "Tab Delimited" specifies that each event is on a separate line, and each field in the event is separated by a tab. The "Multiline" option should be chosen when you want to be able to read the information easily; however, one of the two last options should be chosen if you want to perform additional processing on the log files with some type of external program.
- FTP Saved Log on Wrap This option allows you to have the concentrator automatically copy an event log file to an FTP server whenever the log file wraps. Notice that I said "copy" and not "delete." The log file is still in Flash memory on the concentrator. You'll need to configure the FTP access parameters, which I discuss in the "FTP Backup of Events" section of this chapter.
- E-mail Source Address If you'll be sending certain events via e-mail to an e-mail account, this parameter allows you to specify what e-mail account appears in the "From:" field of the e-mail message. The e-mail account can be up to 48 characters long. If you leave it blank, and you have enabled the e-mail event log function, then the e-mail account in the "To:" field will be replicated in the "From:" field.
- Syslog Format There are two formats of event messages you can choose from: "Original," which is the original format used on the concentrator, or "Cisco IOS Compatible," which should be chosen if you'll be sending events, via syslog, to a Cisco management application (this format would be similar to a log message you would see on a Cisco router or PIX or ASA security appliance).
- Events to Log This option allows you to specify the default logging level to the event log file in Flash memory. Your options for logging levels are "None" (disable logging to this location), "Severity 1," "Severities 12," "Severities 13," "Severities 14," "Severities 15," and "Use Event List." If you choose "Use Event List," the events and levels you have configured in the Event List at the bottom of this screen are used (see the last bullet). The default logging level for this location is 15, which will store any of these level events to the log file; other higher numbered events are not stored.
- Events to Console This option allows you to specify the default logging level to Live Event Log. This defaults to levels 13.
- Events to Syslog This option allows you to specify the default logging level to an external syslog server. This defaults to "None," indicating that this option is disabled; if you set this, you must also define the access parameters for the syslog server. This is discussed in the "Syslog Server Configuration" section later in the chapter.
- Events to E-mail This option allows you to specify that events of the specified range be sent to an e-mail recipient via an e-mail message. The default is "None"; you also must define the access parameters for the e-mail server. This is discussed in the "SMTP Server and E-mail Recipient Configuration" section later.
- Events to Trap This option allows you to specify that events of the specified range be sent to an SNMP management station. The default is "None"; if you set this, you also must define the access parameters for the SNMP management station. This is discussed in the "SNMP Server Configuration for Traps" section later in the chapter.
- Event List One of the problems with the above solutions for logging to a destination is that the highest level of detail you can specify is either 3 or 5, depending on the logging location. One way you can change the default logging level for an event for a location is to specify "Use Event List" for the location and then configure the event and logging level in the Event List box at the bottom of the screen in Figure 11-7 (this cannot be seen in the figure). You can change event logging based on class (type of event), event ID (the event within a class, like a particular IKE event), and the severity of an event (113). Each entry in the Event List text box must be on a separate line. The general format of an event list entry is:
/
Entries can just be an event class name, such as "IKE" or "ALL"; just an event ID, which is the number of the event (or range of numbers) for the specified class (an event ID would be similar to a message ID, uniquely identifying a specific event within a class); just a severity level, such as SEV(1) or SEV(1-13); or a combination of these. For example, an event list entry of "IKE/1,10-13,SEV(1-7)" says that for IKE (Phase 1) event IDs 1 and 10 through 13, the event logging level should include logging levels 1 through 7. Please note that for the "ALL" class name, you cannot specify an event IDjust a severity or list of severity levels.
Note
One problem with the Event List configuration is that it changes an event logging level for any event logging destination that specifies "Use Event List." In other words, you can't have level 5 for one event for syslog and level 7 of the same event for log (log event file). If you need this type of granularity, you'll need to configure an event class, which is discussed in the "Event Class Configuration" section.
FTP Backup of Events
If you want to back up your event logs (in Flash) to an FTP server when the log file wraps, you must first select the severity level for the Events to Trap parameter on the Configuration > System > Events > General screen (see the "Default Logging Configuration" section) and then go to Configuration > System > Events > FTP Backup screen and enter your FTP access parameters. On this screen, you'll need to configure the following:
- The IP address of the FTP server
- Optionally, the directory location where you want the file to be stored; if you have multiple concentrators, have a separate directory for each, because the naming structure used for log file names is the same on each concentrator
- The FTP account name to authenticate to the server
- The FTP password for the account
Click the Apply button at the bottom of the screen to activate your changes.
Caution
I recommend that you use the syslog server method of saving log events versus this method, since you're probably already using syslog to save event logging information of other devices in your network. If you're using FTP, I would recommend against enabling anonymous access on the server. Configure an account for the concentrator to use. Also, I would encrypt transmissions from the concentrator to the FTP server's LAN segment using IPsec, because FTP is an insecure protocol.
SNMP Server Configuration for Traps
To send events as traps to an SNMP management station, first you must select the severity level for the Events to Trap parameter on the Configuration > System > Events > General screen (see the "Default Logging Configuration" section) and then go to the Configuration > System > Events > Trap Destination screen to add your SNMP management stations. When you click the Add button to add an SNMP management station, you'll need to specify the following:
- IP address of the SNMP management station
- The SNMP version to use: 1 or 2
- The community string for access
- The UDP port number for communications (defaults to 162)
The order in which you add your management stations is the order the concentrator uses when contacting them: therefore, the first station added becomes the default trap destination.
Caution
Currently, the concentrator doesn't support SNMPv3, which has support for authentication and encryption; therefore, I would encrypt transmissions from the concentrator to the SNMP management station's LAN segment using an IPsec session, because SNMPv1 and v2 are insecure protocols.
Syslog Server Configuration
To send events to a syslog server, first you must select the severity level for the Events to Syslog parameter on the Configuration > System > Events > General screen (see the "Default Logging Configuration" section) and then go to the Configuration > System > Events > Syslog Servers screen to add your syslog servers. When you click the Add button to add syslog, you'll need to specify the following:
- The IP address of the syslog server
- The UDP port number for communications (defaults to 514)
- The logging facility for the event messages (defaults to Local7)this can be used by the syslog server to redirect the message and put it into a specific file on the server
If you add more than one syslog server, the concentrator will send messages to each server: the maximum number of syslog servers you can configure is five.
Caution
Syslog messages are not authenticated, not checked for tampering, and not verified if received; therefore, I would encrypt transmissions from the concentrator to the syslog server's LAN segment using an IPsec session.
SMTP Server and E-mail Recipient Configuration
To send events via an e-mail message, first select the severity level for the Events to E-mail parameter on the Configuration > System > Events > General screen (see the "Default Logging Configuration" section), then add an e-mail server, and last specify an e-mail recipient.
To add an e-mail server, go to the Configuration > System > Events > SMTP Servers screen and click the Add button to add an e-mail server; you'll need to specify the IP address of the e-mail server. If you add multiple e-mail servers, the first one you add becomes the primary server.
To specify the e-mail recipient of the event message, go to the Configuration > System > Events > E-mail Recipients screen and click the Add button. On this screen, enter the e-mail address and maximum severity level of events forwarded to this recipient. If you add multiple recipients, each person will receive events at the specified level.
Event Class Configuration
The event logging levels configured from the Configuration > System > Events > General screen sets the same logging level for all events sent to a specific logging location, such as a syslog server or the console. This is true even if you modify specific events with the Event List parameter on this screen. If you want to specify a specific logging level for different logging destinations, you need to create an event class. For example, you might want to set the logging level for IKE events to levels 15 for the console, but 19 for a syslog server; you can create an event class to accomplish this.
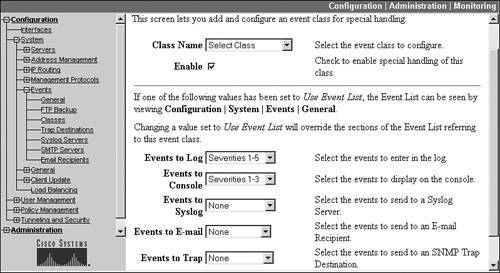
To create an event class, go to the Configuration > System > Events > Classes screen. This lists the event classes you've added. By default, one class entry exists: "MIB2TRAP," which includes SNMP MIB-II events. To add a new event class, click the Add button, where you're shown the screen in Figure 11-8. At the top of the screen there is a pull-down selector where you select the class name that you want to modify the logging level for. The class names and their descriptions are shown in Table 11-1. In the Description column, those labeled as "specific to Cisco products" apply to a Cisco feature and are not found in any standard or open implementation (almost all of the event log messages are specific to Cisco products).
Figure 11-8. Event Class Configuration
|
Event Class Name |
Description |
|---|---|
|
AUTH |
Authentication functions |
|
AUTHDBG |
Authentication debugging (specific to Cisco products) |
|
AUTHDECODE |
Authentication protocol decoding (specific to Cisco products) |
|
AUTOUPDATE |
Autoupdate events |
|
BMGT |
Bandwidth management events (specific to Cisco products) |
|
BMGTDBG |
Bandwidth management debugging (specific to Cisco products) |
|
CAPI |
Cryptography events |
|
CERT |
Digital certificate events, including SCEP functions |
|
CIFS |
CIF file system access (specific to Cisco products) |
|
CIFSDBG |
CIF file system access debugging (specific to Cisco products) |
|
CONFIG |
Configuration events on the concentrator |
|
DHCP |
DHCP events |
|
DHCPDBG |
DHCP debugging (specific to Cisco products) |
|
DHCPDECODE |
DHCP decoding (specific to Cisco products) |
|
DM |
Data movement events on the concentrator's Flash memory |
|
DNS |
DNS functions |
|
DNSDBG |
DNS debug (specific to Cisco products) |
|
DNSDECODE |
DNS decoding (specific to Cisco products) |
|
EVENT |
Events occurring on the concentrator |
|
EVENTDBG |
Event debugging (specific to Cisco products) |
|
EVENTMIB |
Event MIB changes (specific to Cisco products) |
|
EXPANSIONCARD |
Events related to the SEP modules |
|
FILTER |
Events related to filtering of packets |
|
FILTERDBG |
Filter debugging (specific to Cisco products) |
|
FSM |
Finite State Machine debugging (specific to Cisco products) |
|
FTPD |
Events related to the FTP daemon process |
|
GENERAL |
NTP and other general events |
|
GRE |
GRE events |
|
GREDBG |
GRE debugging (specific to Cisco products) |
|
GREDECODE |
GRE decoding (specific to Cisco products) |
|
HARDWAREMON |
Monitoring of hardware components like the power voltage levels, fan RPMs, and the temperature |
|
HTTP |
HTTP access events |
|
IKE |
ISAKMP/IKE events |
|
IKEDBG |
ISAKMP/IKE debugging (specific to Cisco products) |
|
IKEDECODE |
ISAKMP/IKE decoding (specific to Cisco products) |
|
IP |
IP routing events |
|
IPDBG |
IP routing debugging (specific to Cisco products) |
|
IPDECODE |
IP packet decoding (specific to Cisco products) |
|
IPSEC |
IPsec events |
|
IPSECDBG |
IPsec debugging (specific to Cisco products) |
|
IPSECDECODE |
IPsec decoding (specific to Cisco products) |
|
L2TP |
L2TP events |
|
L2TPDBG |
L2TP debugging (specific to Cisco products) |
|
L2TPDECODE |
L2TP decoding (specific to Cisco products) |
|
LBSSF |
VCA load balancing events |
|
MIB2TRAP |
MIB-II SNMP traps |
|
OSPF |
OSPF routing events |
|
PPP |
PPP events |
|
PPPDBG |
PPP debugging (specific to Cisco products) |
|
PPPDECODE |
PPP decoding (specific to Cisco products) |
|
PPTP |
PPTP events |
|
PPTPDBG |
PPTP debugging (specific to Cisco products) |
|
PPTPDECODE |
PPTP decoding (specific to Cisco products) |
|
PSH |
Operating system command shell |
|
POS |
Embedded real-time operating system events |
|
QUEUE |
System queuing functions |
|
REBOOT |
Concentrator reboots |
|
RM |
Concentrator resource manager events |
|
SMTP |
SMTP events |
|
SNMP |
SNMP traps |
|
SSH |
SSH access and events |
|
SSL |
SSL (HTTPS) access and events |
|
SYSTEM |
Buffer usage, heap usage, and other system related functions |
|
TCP |
TCP events |
|
TELNET |
Telnet access and events |
|
TELNETDBG |
Telnet debugging (specific to Cisco products) |
|
TELNETDECODE |
Telnet decoding (specific to Cisco products) |
|
TIME |
Events related to the clock on the concentrator |
|
VRRP |
VRRP events |
|
WebVPN |
SSL WebVPN session events |
|
XML |
XML events |
Note
From the Configuration > System > Events > General screen, if you have chosen the Use Event List options for a logging destination and have defined event classes in the Event List text box, these event class configurations also will appear on the screen in Figure 11-8.
The Enable check box, when checked, enables the event class. The Events to Log (defaults to logging levels 15), Events to Console (defaults to logging levels 13), Events to Syslog (disabled by default), Events to E-mail (disabled by default), and Events to Trap (disabled by default) parameters allow you to change the logging severity level for each destination respectively. Logging levels can be set to "None" (disabled), 113, or Use Event List (in which case the referred Event List on the Configuration > System > Events > General screen is used). Levels 16 are referred to as "Normal" by Cisco, 79 as "Debugging," and 1013 as a "Hex Dump."
Caution
Level 1 events are the most serious events, for example, a concentrator component failing; level 13 events would be a hex dump of partial packet contents. If you set the logging level for an event above 9, this could cause additional events to trigger on the concentrator, creating additional logging information not necessarily related to the problem you're trying to troubleshoot. Cisco recommends using a logging of 6 or lower; however, I typically use 9 unless I actually need to see some of the packet contents, then I'll set it somewhere between 1013.
Tip
For detailed troubleshooting of a specific problem, I typically use event classes to help solve the problem. Once I know what the type of problem is, I create an event class and set the logging level to 9 for the log file (Events to Log parameter). Once I'm done troubleshooting the problem, I'll go back into the event class and deselect the Enable check box to reset the logging back to the default level.
Live Event Log
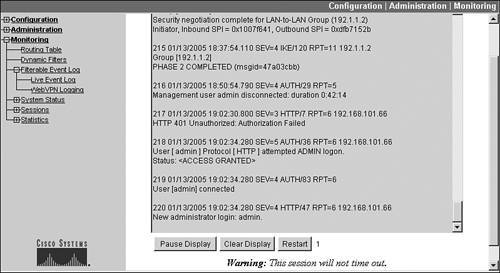
To see events on the concentrator as they happen (on the console), you would use the Live Event Log, accessed by going to Monitoring > Live Event Log. The screen might take a few seconds to load. This screen, shown in Figure 11-9, requires that you have Java enabled in your web browser to see the events. This screen displays all the events in the event log, and any new events that occur (in a somewhat real time fashion), where the screen is updated once every five secondsyou can see the counter counting down from 5 to 1 at the bottom of the screen.
Figure 11-9. Live Event Log
Caution
If you keep this screen open, your login session will not time out, because the screen updates itself automatically and the concentrator sees this as activity.
Interaction with the Live Event Log
By default, the logging level is set to 13 for the Live Event Log, so you'll only see important events. You can change the logging level as described in the "Default Logging Configuration" and "Event Class Configuration" sections. If you're seeing too many events in the window, you can click the Pause Display button at the bottom, which stops any new updates from displaying; you can click the Resume Display button to resume the display of new events, which also restarts the 5-second timer. If you click the Clear Display button at the bottom, the window display is cleared; however, the event log itself is not cleared. If you click the Restart button, the events in the window are cleared and the entire event log file is displayed.
Tip
The Live Event Log is similar to logging events to the console on a Cisco router; its one main advantage over a router is that it can pull the events from the event log file by clicking the Restart button. Unlike a router using debug, though, the concentrator's Live Event Log's main downfall is that you're seeing all events that are occurringthose that pertain to your problem and those that don't. This makes it very difficult to troubleshoot a specific problem on the concentrator using the Live Event Log. Therefore, I typically use the Filterable Event Log feature, which I'll discuss in the "Filterable Event Log" section later in the chapter.
Event Log Formatting
Each event in the event log and displayed in the Live Event Log screen consists of either eight or nine fields in the following format:
Sequence_# Date Time Severity_Level Event_Class/Event_ID
 Event_Count (IP_Address) Event_Description
Example 11-1 shows an event in the event log from Figure 11-9:
Example 11-1. An Event from the Event Log
218 01/13/2005 19:02:34.280 SEV=5 AUTH/36 RPT=6 192.168.101.66
User [ admin ] Protocol [ HTTP ] attempted ADMIN logon.
Status:
Here is a description of each of these fields:
- Sequence_# This is the number of the event, which increments with each new event. When the concentrator boots up, resequencing starts at event 1. Please note that you can have multiple events with the same number; when the concentrator boots up, it appends events to the current log file. The largest sequence number is 65,536. In Example 11-1, the sequence number of the event is "218."
- Date This is the date on which the event occurred in an "MM/DD/YYYY" format. In Example 11-1, the date is "01/13/2005."
- Time This is the time at which the event occurred in an "HH:MM:SS.millisecond" format. In Example 11-1, the time is "19:02:34.280." The time is in a 24-hour format, so this event occurred at 7:02:34.280 PM.
- Severity_Level This is the level of the event, which can range from 113. In Example 11-1, the severity level is 5.
- Event_Class This is the type of event; possible event classes are listed in Table 11-1. In Example 11-1, the event class is "AUTH," indicating that the event involves some type of authentication function (in this case, it's someone trying to log in to the "admin" account on the concentrator).
- Event_ID This qualifies the type of event class. In Example 11-1, the event ID is 36, indicating that this is an HTTP management connection attempt to the concentrator.
- Event_Count This is the number of times that this type of event has occurred since the concentrator booted up. In Example 11-1, this particular type of event occurred six times, indicating that since the concentrator booted up, six HTTP management connection attempts were made.
- IP_Address This is the IP address of the device associated with the event. Depending on the type of event, this may or may not be displayed (some events are not associated with IP connections). In Example 11-1, the person attempting the HTTP management connection is 192.168.101.66.
- Event_Description The last component of the event log entry is a description of the actual event. This cannot exceed 80 characters per line, so for certain events, the description will be spread across multiple lines. In Example 11-1, there are two lines of description. For this log entry, someone was using HTTP to access the "admin" account on the concentrator and successfully supplied the correct password.
Filterable Event Log
Unlike the Live Event Log, the Filterable Event Log allows you to use filtering criteria to limit the events displayed in your window. This is very useful when troubleshooting a specific problem where you don't want to wade through many events in the event log to find the events related to your specific problem.
Note
To access the event log file in nonvolatile memory, you must have administrative rights to file access. These are defined in the Administration > Access Rights > Administrators > Modify Properties screen. This was discussed in Chapter 10, "Concentrator Management."
Filtering Options
To access the Filterable Event Log filtering functions, go to Monitoring > Filterable Event Log. Figure 11-10 shows a snapshot of the Filterable Event Log screen.
Figure 11-10. Filterable Event Log
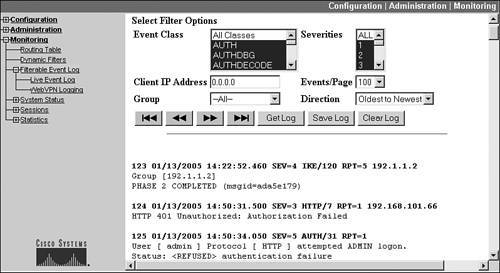
There are six filtering options in the screen:
- Event Class You can choose one, multiple, or all event classes to include in your view. To select a range of contiguous classes, select the first class, hold down the SHIFT key, and then select the last class in the range. To select multiple noncontiguous event classes, select the first class, and then for each additional class, press the CTRL key and click the class name. The event class descriptions are discussed in Table 11-1.
- Severities You can choose one, multiple, or all severity levels of the event class or classes you've chosen. To select more than one severity level, see the previous bullet point.
- Client IP Address You can restrict events related to a specific IP address by entering the IP address in this field; to remove this restriction, re-enter 0.0.0.0 as the IP address.
- Events/Page This allows you to control how many events are displayed per viewing page. The default is 100 events per page, but you can change this to "10," "25," "50," "100," "250," or "ALL."
- Group You can restrict events for VPN sessions based on group membership. This drop-down selector allows you to restrict your viewing to all groups or to one specific group.
- Direction You can affect the sorting of the order of the events displayed in the view by changing the direction: "Oldest to Newest" or "Newest to Oldest."
Event File Viewing and Manipulation
Once you've selected your filtering criteria, to display the filtered events, click any of the four Page buttons, as follows:
- |

 Go to the very beginning of the event display (first screen)
 - Go to the previous screen of the event display
images/U25B8.jpg border=0>Go to the next screen of the event display
- images/U25B8.jpg border=0>
The filtering options you have specified will remain in effect until you either change them or leave and come back to the Filterable Event Log screen.
Note
Remember that you'll only see events in the event log file; if you need to see more detail about the events, you'll need to change the severity level for the event class or classes in question for the event log file in nonvolatile memory. This is discussed in the "Event Class Configuration" section.
Some other options available to you from this screen are these three buttons:
- Get Log This opens up a new web browser window and displays the contents of the event log file based on your filtering criteria. You can then view and save the log file to your PC's hard drive. The default log file name is "vpn3000log.txt." If you right-click the Get Log button, a pop-up menu displays alternative choices for accessing this file.
- Save Log This allows you to save the current event log file to Flash memory on the browser. The naming convention you use must follow Microsoft's DOS conventions: 8.3. If you enter a name that already exists in Flash, the file in Flash is overwritten. You can then go to Administration > File Management to manipulate the saved file.
- Clear Log This completely erases the current event log file from the concentrator's nonvolatile memory and displays an empty event screen in the Filterable Event Log.
Caution
If you click the Clear Log button, there is no undo feature: in other words, the current event log file is gone! Therefore, before using this feature, you might want to save the log file with the Save Log File button first.
Monitoring Statistics Screens
The last set of Monitoring screens are related to statistics gathering: Monitoring > Statistics. From these screens you can view various statistics of components running on the concentrator. These statistics include the following:
- Accounting AAA RADIUS user accounting activity
- Address Pools Address pools for remote access sessions, including allocated and available addresses
- Administrative AAA Administrative access statistics for AAA TACACS+ events (if TACACS+ has been enabled for authentication of administrative access)
- Authentication Remote access authentication activity via AAA RADIUS, including total number of authentications performed (accepted, rejected, timeouts, and so on)
- Authorization AAA RADIUS user authorization activity
- Bandwidth Management Bandwidth policy information related to traffic volume and rate
- Compression Compression statistics for IPsec, L2TP, and PPTP (via MPPC) remote access sessions
- DHCP Remote access sessions using DHCP, including leased addresses, duration of connection, DHCP server addresses, and so on
- DNS DNS resolution information, including total requests, responses, and timeouts
- Events A summarized list of logging events, summarized on event class, event number, and the total count for each event number within an event class
- Filtering Number of inbound and outbound packets filtered by the concentrator on its interfaces
- HTTP HTTP web-browser management statistics
- IPsec ISAKMP/IKE Phase 1 and 2 summarized statistics for all sessions (remote access and L2L), including statistics about packets received and transmitted, dropped, encrypted and decrypted, and so on
- L2TP L2TP summarized statistics for remote access sessions, including statistics about total number of current sessions, maximum number of sessions since the concentrator booted, failed sessions, packets received and transmitted, and the current list of authenticated users
- Load Balancing VCA statistics for load balancing, including VCA role, peers, and load
- NAT Address translation statistics including number of packets translated by the concentrator, number of translated sessions, and a list of the entries in the translation table
- PPTP PPTP summarized statistics for remote access sessions, including statistics about total number of current sessions, maximum number of sessions since the concentrator booted, failed sessions, packets received and transmitted, and the current list of authenticated users
- SSH Summarized count of current SSH sessions to the concentrator, maximum number of sessions during a peak, and a list of current accounts that have SSH sessions terminated on the concentrator
- SSL Number of current and peak SSL sessions terminated on the concentrator, including encryption statistics
- Telnet Summarized count of current Telnet sessions to the concentrator, maximum number of sessions during a peak, and a list of current accounts that have SSH sessions terminated on the concentrator
- VRRP VRRP statistics for the configured redundancy group on the concentrator
- MIB-II Statistics for the concentrator's interfaces, TCP and UDP sessions, IP packets and fragmentation, RIP configuration and updates, OSPF configuration and updates, counts of the types of ICMP packets, list of entries in the ARP table for each concentrator interface, and SNMP information for polling requests
Part I: VPNs
Overview of VPNs
- Overview of VPNs
- Traffic Issues
- VPN Definition
- VPN Components
- VPN Designs
- VPN Implementations
- VPNs: Choosing a Solution
- Summary
VPN Technologies
IPsec
PPTP and L2TP
SSL VPNs
Part II: Concentrators
Concentrator Product Information
- Concentrator Product Information
- Concentrator Models
- Concentrator Modules
- Concentrator Features
- Introduction to Accessing a Concentrator
- Summary
Concentrator Remote Access Connections with IPsec
- Concentrator Remote Access Connections with IPsec
- Controlling Remote Access Sessions to the Concentrator
- IPsec Remote Access
- Network Access Control (NAC) for IPsec and L2TP/IPsec Users
- Summary
Concentrator Remote Access Connections with PPTP, L2TP, and WebVPN
- Concentrator Remote Access Connections with PPTP, L2TP, and WebVPN
- PPTP and L2TP Remote Access
- WebVPN Remote Access
- Summary
Concentrator Site-to-Site Connections
- Concentrator Site-to-Site Connections
- L2L Connectivity Example
- ISAKMP/IKE Phase 1 Preparation
- Adding Site-to-Site Connections
- Address Translation and L2L Sessions
- Summary
Concentrator Management
- Concentrator Management
- Bandwidth Management
- Routing on the Concentrator
- Chassis Redundancy
- Administration Screens
- Summary
Verifying and Troubleshooting Concentrator Connections
- Verifying and Troubleshooting Concentrator Connections
- Concentrator Tools
- Troubleshooting Problems
- Summary
Part III: Clients
Cisco VPN Software Client
- Cisco VPN Software Client
- Cisco VPN Client Overview
- Cisco VPN Client Interface
- IPsec Connections
- VPN Client GUI Options
- VPN Client Software Updates
- VPN Client Troubleshooting
- Summary
Windows Software Client
- Windows Software Client
- Windows Client
- Configuring the Windows VPN Client
- Configuring the VPN 3000 Concentrator
- Microsoft Client Connections
- Troubleshooting VPN Connections
- Summary
3002 Hardware Client
- 3002 Hardware Client
- Overview of the 3002 Hardware Client
- Initial Access to the 3002
- Authentication and Connection Options
- Connection Modes
- Administrative Tasks
- Summary
Part IV: IOS Routers
Router Product Information
Router ISAKMP/IKE Phase 1 Connectivity
- Router ISAKMP/IKE Phase 1 Connectivity
- IPsec Preparation
- ISAKMP/IKE Phase 1 Policies
- ISAKMP/IKE Phase 1 Device Authentication
- Monitoring and Managing Management Connections
- Routers as Certificate Authorities
- Summary
Router Site-to-Site Connections
- Router Site-to-Site Connections
- ISAKMP/IKE Phase 2 Configuration
- Viewing and Managing Connections
- Issues with Site-to-Site Connections
- Summary
Router Remote Access Connections
- Router Remote Access Connections
- Easy VPN Server
- Easy VPN Remote
- IPsec Remote Access and L2L Sessions on the Same Router
- WebVPN
- Summary
Troubleshooting Router Connections
- Troubleshooting Router Connections
- ISAKMP/IKE Phase 1 Connections
- ISAKMP/IKE Phase 2 Connections
- New IPsec Troubleshooting Features
- Fragmentation Problems
- Summary
Part V: PIX Firewalls
PIX and ASA Product Information
- PIX and ASA Product Information
- PIX Deployment Scenarios
- PIX and ASA Feature and Product Overview
- Summary
PIX and ASA Site-to-Site Connections
- PIX and ASA Site-to-Site Connections
- ISAKMP/IKE Phase 1 Management Connection
- ISAKMP/IKE Phase 2 Data Connections
- L2L Connection Examples
- Summary
PIX and ASA Remote Access Connections
- PIX and ASA Remote Access Connections
- Easy VPN Server Support for 6.x
- Easy VPN Remote Support for 6.x
- Easy VPN Server Support for 7.0
- Summary
Troubleshooting PIX and ASA Connections
- Troubleshooting PIX and ASA Connections
- ISAKMP/IKE Phase 1 Connections
- ISAKMP/IKE Phase 2 Connections
- Summary
Part VI: Case Study
Case Study
Index
EAN: 2147483647
Pages: 178
