Eliminating Resource Overallocations Yourself
| < Day Day Up > |
| The first two sections of this chapter provide an overview of the possible ways to resolve resource overallocations. The preceding section shows how Microsoft Project's Leveling command can eliminate overallocations, using the sole strategy of delaying assignments. This section shows you how to use Microsoft Project's views to analyze the facts and use your own judgment to implement the strategy you think best fits the situation. Increasing the Availability of the Overallocated ResourceOne way to eliminate resource overallocations is to increase the availability of the resource that is overallocated. After negotiating with the resource, you can use the tools in this section to implement the changes.
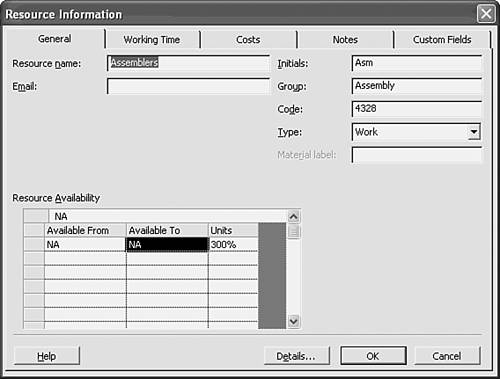
NOTE Although resource names seem to appear in the Task Usage view, the records are really assignment records, not resource records, and the Information ScreenTip on the toolbar changes, depending on whether you have a task or an assignment selected. If you double-click on an assignment, the Assignment Information dialog box appears. TIP You can access the Resource Information dialog box by double-clicking the resource name in most views where the resource name is displayed and in the Assign Resources dialog box. This doesn't work in the Resource Form and Resource Name Form views. Double-clicking the task name in task views displays the Task Information dialog box, and double-clicking an assignment displays the Assignment Information dialog box. Increasing the Resource Availability SettingsTo change the dates when a resource is available ( assuming that it is not available for the entire project), you need to modify the Resource Availability table on the Resource Information dialog box for the resource. To change the units available for a resource, follow these steps:
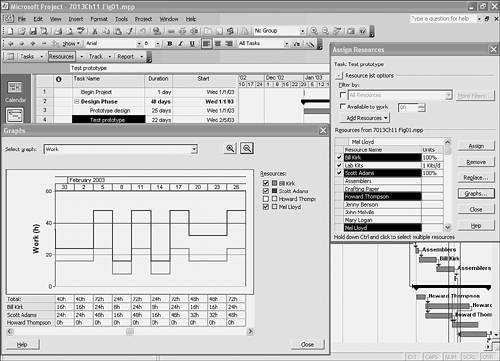
To check a resource's availability or current workload in the Gantt Chart view, display the Assign Resources dialog box, select the resource name, and click the Graphs button. A graphical view of that resource's workload appears. You can change the display of work by selecting Remaining Availability or Assignment Work from the drop-down list (see Figure 11.11). Figure 11.11. You can use the Graph option in the Assign Resources dialog box to assess workload for one or more resources. Scheduling Overtime for a ResourceYou can schedule overtime hours for a resource to supplement the regular calendar working hours. If you enter overtime hours, Microsoft Project subtracts this number of hours from the total amount of work that was to have been scheduled during the regular working hours. The regular working hours are those that are defined as working time on the resource calendar. The total work remains the same as in the original schedule, so you should not change the total amount of work for the task when adding overtime hours; you simply enter the number of hours that should be assigned as overtime. Of course, overtime hours are frequently paid for at premium hourly rates. Using overtime to solve overallocation problems may be a costly method of solving the problem, but it's not usually as costly as hiring new resources. Before you enter overtime hours for an assignment, all the work is scheduled as regular work. When you enter overtime hours for an assignment, Microsoft Project performs these calculations:
If the work assignment is contoured, the overtime hours are still evenly distributed over the duration of the regular hours, no matter which contour is applied. Note that you cannot directly enter the number of overtime hours to be scheduled during specific time periods in the timephased grid. You can, however, manually contour the regular working hours in individual cells . In fact, as you will see, Microsoft Project's calculations almost always leave the resource overallocated, even after you apply overtime, because of the way Microsoft Project distributes the work. You need to manually contour the assignment to show Microsoft Project how to remove the Overallocation indicator when you apply overtime. You can enter overtime in the Task Form view or the Resource Form view. In either case, you need to display the work details in order to see overtime. If you use the Task Form view, you see only one task listed at a time. If you use the Resource Form view, all tasks to which the resource is assigned are displayed in the Work field's listing, and you can assign overtime to multiple tasks from the same screen. You can also enter overtime in the Resource Usage view if you add a column to display the Overtime Work field. Let's look at two examples of using overtime to solve a scheduling problem:
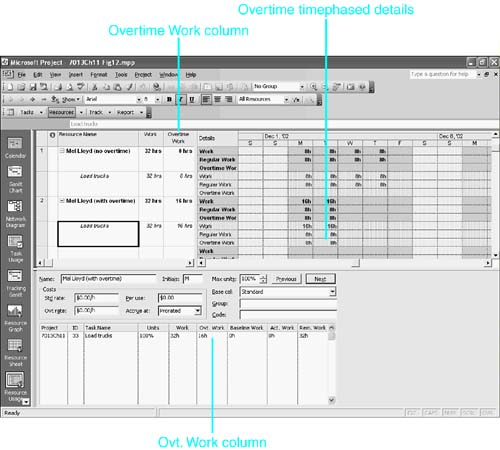
Figure 11.12 shows a before-and-after version of an assignment for Mel Lloyd to load trucks . The original task is represented by the first resource "Mel Lloyd (no overtime)" and is scheduled to take four days. If the task needs to be finished in two days instead of four, and if other resources are not available to help, the scheduler could ask Mel to work a lot of extra hours to complete the task earlier. Figure 11.12. You can use the Resource Usage view to apply and fine-tune scheduled overtime. Figure 11.12 displays the Resource Usage view in the top pane and the Resource Form view in the bottom pane. In the Resource Form view, the Work Details table is displayed at the bottom, to make the Ovt. Work field available for entering overtime. The timephased data in the top pane displays details for work (which is total work for the task), regular work (which is work during working times on the calendar), and overtime work. The Overtime Work field has also been added to the table, on the left, as an alternative way to schedule overtime for assignments. The second resource, "Mel Lloyd (with overtime)," has 16 hours of overtime scheduled, and Microsoft Project has shortened the duration of the task to two days. The overtime could have been entered either in the Overtime Work column in the top pane or in the Ovt. Work column in the Resource Form view in the bottom pane. To enter overtime hours for a task by using the Resource Form view, follow these steps:
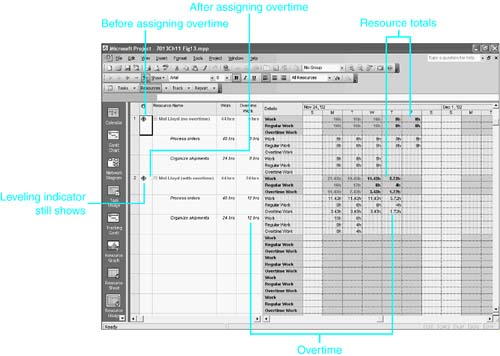
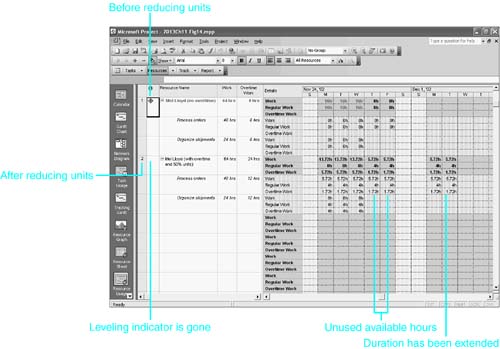
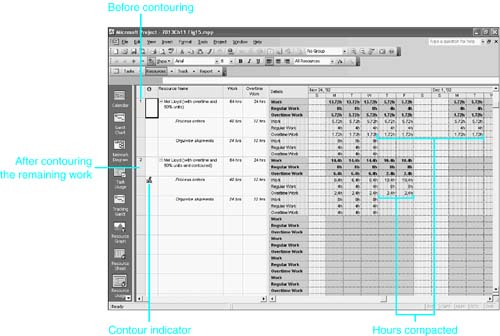
NOTE If the resource is paid for overtime work, be sure that the resource doesn't have a zero overtime rate in the cost fields of the Resource Form view. Some Microsoft Project users mistakenly leave the overtime rate zero if overtime is paid at the same rate as regular hours. If you have displayed the Overtime Work column in the Resource Usage view, you can enter overtime on the rows for assignments (the rows for resources do not allow data entry) just as you do in the Ovt. Work column of the Resource Form view. In cases in which an overallocation has resulted from overlapping assignments, you can assign overtime work to one or more of the tasks to remove the overallocation. If you have two or more tasks that are assigned to one resource and that are scheduled at the same time, the simplest method is to assign all the work of one or more of the assignments (usually the shorter assignments) to overtime. This leaves the assignments that have overtime work with zero (0) hours of regular work, and it eliminates the overallocation. However, if the resource is the only resource assigned to any of those tasks, the zero (0) hours of regular work causes Microsoft Project to treat the task as having no duration and to display it as a milestone. Although you can choose Format, Bar to give the milestone a distinctive appearance, it is nevertheless confusing to see a milestone graphic on the Gantt Chart view when the task will really be ongoing until the overtime work is completed. A better solution is to assign some overtime to both (or all) the tasks that are competing for the resource's work. For example, suppose that Mel Lloyd has two task assignments, Process Orders and Organize Shipments, which are competing for his time. Figure 11.13 shows two versions of the assignments, without and with overtime. The top resource, "Mel Lloyd (no overtime)," shows the original situation. The Process Orders task will take 1 week or 40 hours and the Organize Shipments task will take 3 days or 24 hours. The total work for the week is 64 hours, which is 24 hours more than Mel has available per week. During the time that Organize Shipments is scheduled to occur, Mel is overallocated by 8 hours per day for 3 days (that is, a total of 24 hours of overallocation). Figure 11.13. You can split an overtime assignment between the competing tasks. The second resource listing in Figure 11.13, "Mel Lloyd (with overtime)," shows how Microsoft Project calculates the assignments if you assign 12 hours of overtime to both tasks. With 24 hours of overtime assigned, the regular work for the week is just 40 hours for the week, but the regular work for Monday and Tuesday is still excessive, at 16 and 12 hours, respectively, because Microsoft Project still schedules 8 hours of regular work for both tasks until the task is completed. The Leveling indicator is still displayed because the sensitivity setting is Day by Day. To get Microsoft Project to remove the Leveling indicator, you must reduce the units assigned to each task to 50% so that the total units value is 100% (the units available) and no more than 4 hours of regular work is scheduled per day for each task. Figure 11.14 shows this change. The top resource repeats the bottom resource in Figure 11.14. The bottom resource shows what happens when the units assigned are reduced to 50% for each task. The Leveling indicator is gone, but the duration of the longer task, Process Orders, has been increased and work is scheduled for Monday and Tuesday of the following week. With the 50% units assignment, the scheduling calculations keep the regular hours down to 4 hours per day, even on Thursday and Friday, when the Organize Shipments task is completed and Mel could work 8 hours a day instead of just 4. That lost time is scheduled the following week. Figure 11.14. You can change the units assigned to simultaneous tasks to be no more than the units available. The final adjustment that is needed is to compact the regular work for the Process Orders task at the end of the task, where the reduced units have resulted in unused available hours. On both Thursday and Friday, the 50% units assignment causes only 4 hours to be scheduled, but 8 hours are available when the Organize Shipments task is finished. The reduced hours make it necessary to schedule work on Monday and Tuesday of the following week. Figure 11.15 shows the effect of manually adjusting the regular work schedule for those days. The top resource is a copy of the bottom resource in Figure 11.14, and the bottom resource shows the edited schedule. The regular work cells for Thursday and Friday for the Process Orders assignment were selected and 8h was typed in to replace the 4h that Microsoft Project scheduled. Then the regular work cells for the following Monday and Tuesday were selected and the Delete key was pressed to remove work for those days. Because of the editing, the Contour indicator is displayed for the Process Orders task. The final result shows the two tasks with the same duration and total work as in the original schedule, but the Leveling indicator is gone. Figure 11.15. Manually contouring the schedule is required to keep the task durations at the same length as before assigning overtime. Extending the Available Hours on the Resource CalendarIf you want resources to work extra hours, you can adjust the calendar for the resource to add extra hours on specific days instead of assigning overtime. Unlike with assigning overtime, you can specify precisely when the extra work will take place. However, you cannot specify which task assignments will be scheduled during the extra time unless you manually contour the assignments. Microsoft Project uses the extra hours for any assignment that has started at that point in time, and you may have to edit the assigned work for tasks it has scheduled but that you don't want scheduled during those extra hours. NOTE Remember that all working hours on the calendar are charged at the standard rate for the resource. Therefore, if these hours are really overtime hours and there is a premium rate for overtime, you should assign overtime rather than add hours to the calendar. If only certain resources work the added hours, you need to make the changes on the individual resource calendars. If the added hours are to be worked by all resources, you can make the changes on the base calendar (or calendars) for resources in the project. To extend the normal working hours for one or all resources, follow these steps:
TIP
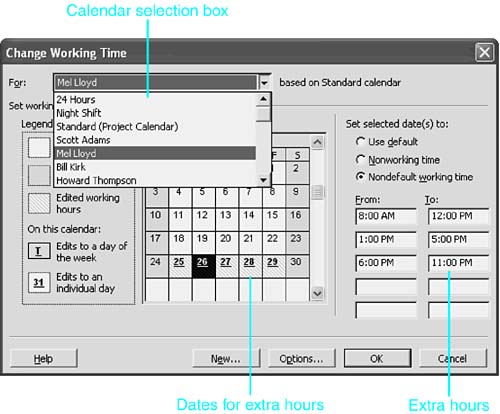
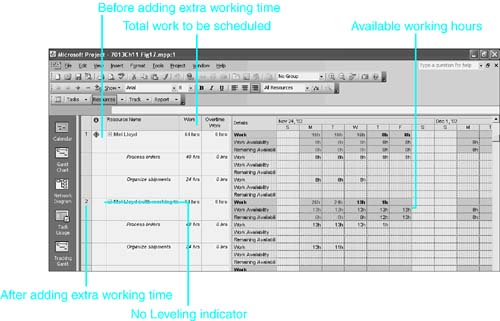
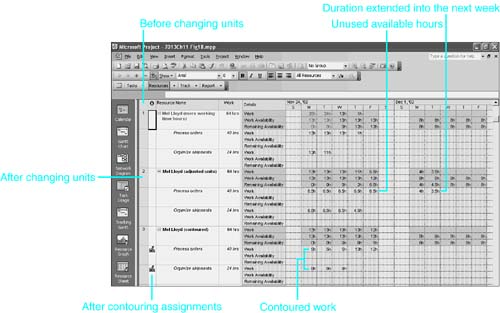
In Figure 11.16, Mel Lloyd's resource calendar is being modified to extend his hours during the week of November 25, 2002, by adding 5 hours of work for each of those days, from 18:00 to 23:00. Figure 11.17 shows the before-and-after effects of extending Mel's regular hours in the same situation that is used to illustrate overtime in Figure 11.13. Resource 1, labeled "Mel Lloyd," has 8 available hours per day (that is, 40 hours per week), as shown in the Work Availability detail row. The total work required for the two tasks is 64 hours, which is 24 hours more than the hours available. Mel is overallocated, and the Leveling indicator is displayed next to his name. Figure 11.17. Increasing the working hours on the calendar makes it possible for the resource to do more workbut that by itself won't remove the overallocation. Resource 2, labeled "Mel Lloyd (more working time hours)," shows that Mel's availability after adding the extra hours has risen to 13 hours per day (or 65 hours for the week). With the extended hours, Microsoft Project is able to schedule all 64 hours of the work during regular hours. And because the Leveling indicator sensitivity setting is Week by Week, the Leveling indicator is not displayed. However, the schedule is totally unrealistic , for Mel is assigned to both tasks at 100% and is scheduled for 26 hours of work on Monday and 24 hours on Tuesday. To make the schedule realistic, and to remove the overallocation highlight, the units must be reduced so that they total no more than 100%. Figure 11.18 shows the before-and-after effect of reducing the units assigned to 50% for each task. Resource 1, labeled "Mel Lloyd (more working time hours)," is the same resource schedule shown in Figure 11.17. Resource 2, labeled "Mel Lloyd (adjusted units)," shows the schedule that Microsoft Project calculates when the unit assignments are changed to 50%. The resource name is no longer highlighted as an overallocated resource because the daily work is no greater than the work availability. Figure 11.18. You can reduce the units to match the resource availability to resolve the overallocation. However, due to the reduced units, Microsoft Project's new schedule has increased the duration of the Organize Shipments task (assigning only 6.5 hours per day instead of 13 hours as before), and Microsoft Project doesn't use all the available hours for the Process Orders task when it is the only task that needs work. The Remaining Availability detail row shows that 2 hours are not used on Thursday and 6.5 hours go unused on Friday. Because the Process Orders task is not finished, the remaining work has been pushed back to the following week. As with scheduling overtime, the final step to make the schedule reflect your real intentions is to manually edit the assignment contour to take advantage of all the available hours at the end of the longer task. Resource 3 in Figure 11.18, labeled "Mel Lloyd (contoured)," shows the results of editing the timephased work assignments to take advantage of all available hours. The Work cells for the Organize Shipments task have been restored to 8 hours per day, and that task still finishes in three days, as it did in the original schedule. During those three days, the remaining 5 available hours are assigned to the Process Orders task. The Remaining Availability details calculate how many hours can be assigned to the Process Orders task on Thursday and Friday, and those cells are edited to finish the task by Friday. Editing the work values on the Process Orders task for Monday, Tuesday, and Wednesday as 5 hours each day reduces the total work value for the assignment to 30 hours. But you originally wanted Mel to work 40 hours on this task. So now you can adjust the working hours on Friday to compensate because Mel appears to have 13 hours of work availability. Increasing the working hours on Friday to 12h (instead of 2h) brings the total work for this assignment back up to 40 hours. Reducing the Workload of the Overallocated ResourceInstead of increasing the availability of the resource that is overallocated, you can look for ways to reduce the demands on the resource during the overallocated period. You can cancel nonessential tasks, reassign tasks to other resources, or delay one or more assignments until the resource has time to work on them. The Resource Allocation view is an efficient view to use for these strategies. Using the Resource Allocation View
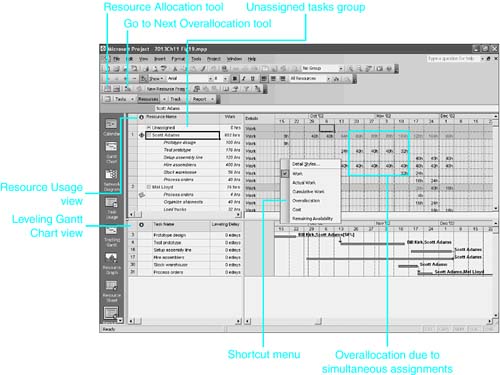
Figure 11.19. The Resource Allocation view is specifically designed to help reassign resources and redefine assignments when overallocations occur. The combination view in Figure 11.19 shows the names and task assignments of all resources in the Resource Usage view in the top pane. This view highlights overallocated resources and displays the Leveling indicator for resources that need your attention. Timephased assignment details in the grid on the right let you edit assignment schedules down to the hour or the minute. The bottom pane displays the Leveling Gantt Chart view, which shows, for the resource name you have selected in the top pane, all the tasks to which the resource is assigned. The Leveling Gantt Chart view has special formatting that is especially helpful in leveling resource assignments.
The bottom pane is a task view that shows only the set of tasks that are assigned to the resource that is selected in the top pane. When the bottom pane is active, the Go to Next Overallocation tool finds the next overallocation associated with one of the tasks in the restricted set. Clicking the tool again causes Microsoft Project to select the next task associated with that same overallocation or to find the next overallocation in the timescale that is associated with one of the tasks in the restricted set. NOTE If you are trying to locate the overallocations for a particular resource, you will find that using the Go to Next Overallocation tool in the top pane can be pretty tedious because it finds overallocations for all resources. Selecting the resource in the top pane, activating the bottom pane, and using the tool there narrows the search considerably. However, the overallocation that Microsoft Project finds may be for a different resource that is also assigned to one of the tasks in the restricted set. To confirm that the overallocation is for the selected resource, check the grid in the top pane to see if there is highlighting in the timephased data for that resource. You can use the top pane to remove a task assignment from an overallocated resource, either by reassigning the task to another resource or by leaving the task unassigned for the time being. If you want to remove an assignment from a resource without designating another resource to take its place, you can simply select the assignment and choose Edit, Delete Assignment (or press the Delete key). The assignment disappears from under the resource and reappears in the Unassigned category at the top of the Resource Usage view. You can move the assignment to another resource later. You can also select the row for the assignment and drag the assignment to the Unassigned group .
By using the Assign Resources dialog box, you can quickly and graphically get an idea of the workload of a single resource or a group of resources by selecting the resource names and selecting Graphs. This enables you to view work, remaining availability, or assignment work in a graph-type view. If you're viewing a group of resources, any one of the resources can be removed from the graph by clicking the check mark to the left of the resource name listed on the right side of the dialog box. When dealing with a large number of resources and using the Assign Resources dialog box to assign resources to tasks in a project, it is useful to be able to filter resources so that you can focus on a particular group of resources. You can use the new Filter By option in the Assign Resources dialog box to filter the resources displayed in the resource list. Substituting Underused Resources for Overallocated ResourcesProbably the most conventional method of dealing with the problem of overallocated resources is to find substitute resources to take some of the load off the overallocated resources. To use this approach in a cost-effective manner, you need to consider a number of things, including the following:
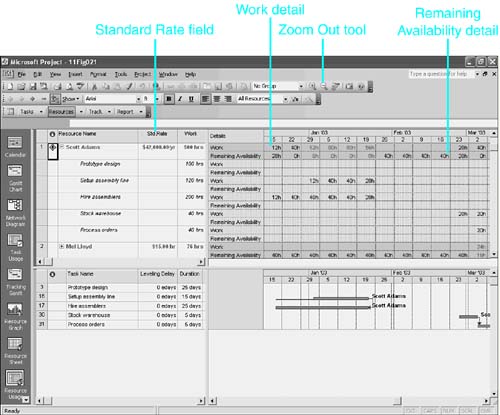
It is certainly not required that you add the information suggested in this list, but the additional information promotes more cost-effective assignments. Because the default table for the Resource Usage view is the Usage table, you can add the Standard Rate field to that table. The following steps show the quickest method of adding this column:
Displaying details in the Resource Usage timescale is described earlier in this chapter, in the section "Working with the Resource Usage View." See that section for instructions on displaying and formatting the Remaining Availability field in the timescale. The resulting view should be similar to the one shown in Figure 11.21. TIP In substituting resources, you might consider using a strategy whereby you assign only generic resources to tasks that are scheduled more than three months ahead. This provides valuable information regarding resource-loading requirements for the future and therefore an indication of what possible human resources, recruitment, or retraining implications there might be in the future. Replacing any generic resources with real named resources within a rolling three-month window (and on an ongoing basis) can form a useful strategy for dealing with resources. In the Standard version of Microsoft Project you can use a text or flag field to indicate which of your resources are generic or nongeneric. However, for more detailed requirements or automated replacement of generic resources based on required skills, you may want to consider using the Professional version of Microsoft Project in which generic resources are fully supported. Details on these features are covered in Chapter 26, "Enterprise Project Management."
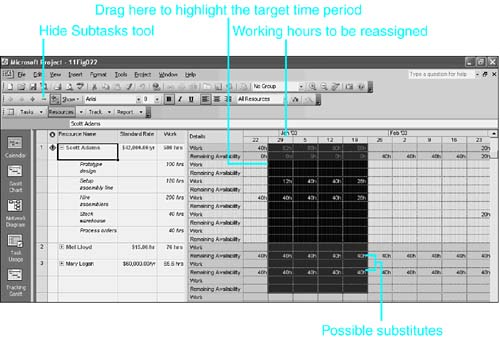
By double-clicking the Setup Assembly Line task in the bottom pane to display the Task Information Form view, you can tell that the task is scheduled from January 2, 2003, to January 23, 2003. To see what other resources might have available hours during that period, you can scroll down the list of resources and look at the Remaining Availability values for other resources. You need to find a resource with at least as many hours available during each week as the work that the task requires: 12 hours the first week, 40 hours in each of the next two weeks, and 28 hours the final week. TIP If the list of resources in the top pane is long, you can highlight the time periods when the substitute must have available hours. Then, click and drag across the time units in the minor scale of the timescale to highlight those weeks for all resources (see Figure 11.22). Finally, scroll down the list, looking for available hours in the highlighted range. Figure 11.22. Highlighting the time periods in question and hiding the assignments make it easier to find available substitutes.
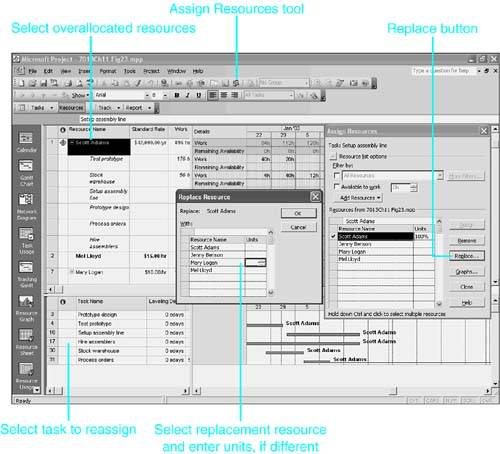
TIP If you have placed in the Group field, or in any text field, labels that identify resources that are qualified substitutes for Scott, you can filter the resource list in the top pane to focus on those resources. For example, the Setup Assembly Line task might require a Manager resource. If managers are identified in the Group field, you could filter the list for managers, to shorten the list of potential substitutes. Both Mel Lloyd and Mary Logan have enough available time during the period shown, and Mary's standard rate is greater than Mel's. However, we will assume that the task is better suited to Mary's abilities and assign her to the task. Mary's standard rate is also higher than Scott's; therefore, the substitution is going to increase the cost of the task. After a task and resource combination is selected, you can use the Resource Assignment dialog box to replace one resource with another:
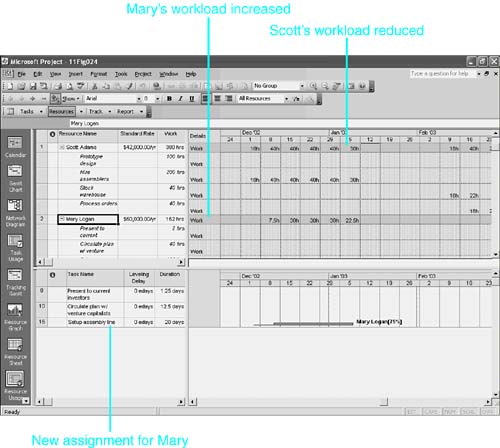
TIP If the new resource is more or less efficient or skilled at the task than the original resource, you should manually adjust the assignment after the replacement to show how many hours it will take the new resource to complete the task. Figure 11.24 shows the schedule after you substitute Mary Logan for Scott Adams. Scott's workload is reduced, and he is no longer overallocated in this period. Figure 11.24. The schedule after substituting Mary Logan for Scott Adams shows that Scott's overallocation has been fixed. After the new assignment has been added to the replacement resource, you can modify the assignment in the Assignment Information dialog box. To do so, you select the assignment row in the top pane and click the Assignment Information tool or simply double-click the assignment. Resolving Overallocations by Delaying AssignmentsIf resource overallocation is the result of scheduling multiple tasks at the same time, you can delay one or more task assignments to a later date to spread out the demands on the resource over a longer period of time and thereby reduce the demand in the overallocated period. You can delay assignments yourself by examining the schedule and selecting the assignments to delay, or you can have Microsoft Office Project choose the assignments to delayeither on your command or automatically as task assignments are added to the schedule. This section shows you how to level assignments yourself, on a case-by-case basis. NOTE This discussion is built around the case of forward-scheduled projects. Delaying overallocations means offsetting one or more tasks that would otherwise be scheduled at the same time. In forward-scheduled projects, you add a delay to a task's start date to push it back to a later date. In projects that are scheduled from a fixed finish date, however, you insert an offset at the finish of the task to cause it to be scheduled for earlier dates. Delay values are entered as positive numbers in forward-scheduled projects and as negative numbers in projects that are scheduled from a fixed finish date. There are several ways to delay assignments yourself:
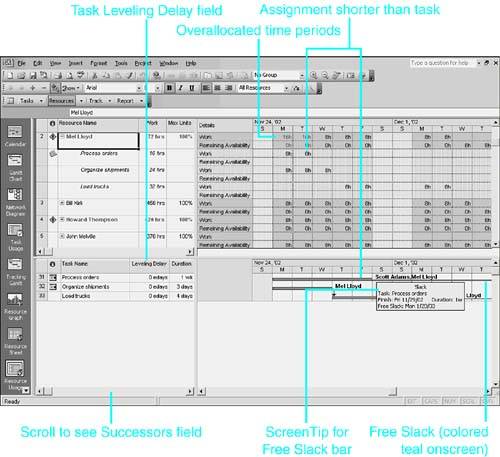
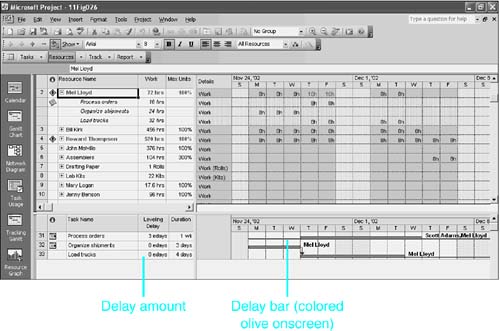
Delaying A TaskYou use the Resource Allocation view when leveling resource work loads manually. With the Resource Usage view in the top pane to help you select the overallocated resources, the bottom pane displays the Leveling Gantt Chart view, with the Leveling Delay field in the table next to the task name (see Figure 11.25). The Leveling Delay field is zero by default, but if you enter an amount of time in the field, Microsoft Project delays the start of the taskand therefore all assignments to the taskby the amount of that delay value. Figure 11.25. The Leveling Gantt Chart view is especially helpful for delaying tasks to level resource assignments. For forward-scheduled projects, the delay value is a positive number that, when added to the task's original start date, makes it a later start date. For projects with fixed finish dates, the delay value is a negative number that makes Microsoft Project push the task finish date back to an earlier date. Delay amounts are shown in elapsed time. Elapsed time ignores the distinction between working time and nonworking time on calendars. Using elapsed time makes it easier for you to estimate the amount of time you should enter in the Leveling Delay field. You can count the time units in the timescale of the Gantt Chart view and enter that number without having to check to see if any of those units fall on nonworking days. The Delay table also includes the Successors field, to give you information about what tasks are directly affected if you delay the selected task. You must scroll the columns in the table to see the Successors field. The taskbars display the names of assigned resources to the right of the bar. The Leveling Gantt Chart view shows the amount of any free slack (that is, the amount of time between the end of a task and the start of a successor task) as a thin teal-colored Slack bar that extends to the right, beyond the bottom edge of the taskbar. You can delay a task by as much as the free slack without affecting the scheduling of other tasks. Of course, if you delay tasks beyond the free slack, the start and finish of successor tasks will also be delayed; if you delay a task beyond the total slack (not shown in the Leveling Gantt Chart view), the finish of the whole project is delayed. NOTE Free slack is the amount of time that a task can be delayed without delaying successor tasks. Total slack is the amount of time that a task can be delayed without delaying the project.
NOTE ScreenTips identify any taskbars that appear in the view. In Figure 11.25, the pointer rests over the Slack bar, and the ScreenTip shows the name of the bar and gives information about the task
Scott Adams is also assigned to the Process Orders task, and if you delayed the task, both Mel's and Scott's assignments would be delayed. However, the existence of the Slack bar to the right of the Process Orders task shows that delaying the task will not delay any other tasks or the project as a whole. If you were to delay the Organize Shipments task to resolve Mel's overallocation, the absence of a Slack bar for the task would show that other tasks and the overall project would be delayed as a result. You can safely delay the Process Orders task. To delay the task, select the Leveling Delay field for the task and estimate the amount of delay. You can see from the Duration field in the bottom pane that Organize Shipments is a three-day task, so entering 3 days for the Process Orders task should remove the overallocation. Figure 11.26 shows the results of entering the delay. The Leveling Gantt Chart view displays the amount of the delay in the Leveling Delay field on the left, and it displays the Delay bar to the left of the taskbar to show the amount of the delay graphically. The tasks no longer overlap, and Mel's initial overallocation period is now free of overallocation. However, Mel now has a three-day conflict with his Load Trucks assignment. If that conflict is resolved by delaying the Load Trucks assignment, it will mean a three-day delay in the completion of the project. Also, because the entire task was delayed, the assignment for Scott Adams had to be delayed also, and that could possibly create an overallocation for Scott. Figure 11.26. The Leveling Gantt Chart view shows the amount of the delay as a thin bar to the left of the main taskbar. You can use Undo (Ctrl+Z) immediately after entering a delay amount to restore the previous values to the Delay field entries. You also can remove a delay by entering in the Delay field. Note that you can't leave the Leveling Delay field blank. If there are many delay values to be cleared, you might want to use the Clear Leveling command. To use the menu to return the delay values to zero for a single task or group of tasks, follow these steps:
Delaying Individual AssignmentsWhen tasks have multiple resources assigned to them, it can be better to resolve an overallocation for just one of the resources by delaying the assignment for just that resource, leaving the other resources unaffected. Of course, if the delayed assignment then has a finish date that is later than the task finish date before the delay, the task duration is increased. This section shows how to delay individual assignments for tasks. Returning to the previous example, you can delay Mel Lloyd's assignment on the Process Orders task instead of delaying the task and Scott's assignment with it. In the Resource Allocation view, you can delay an assignment in one of four ways:
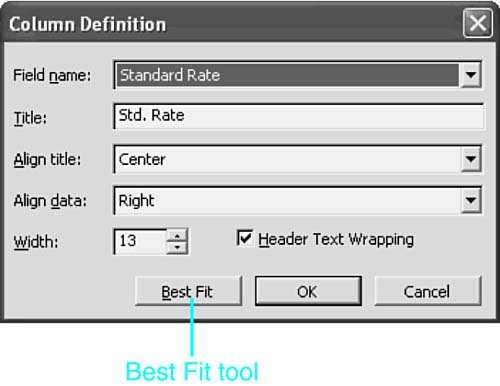
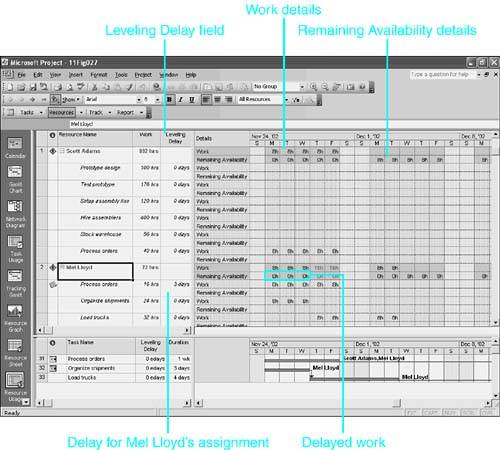
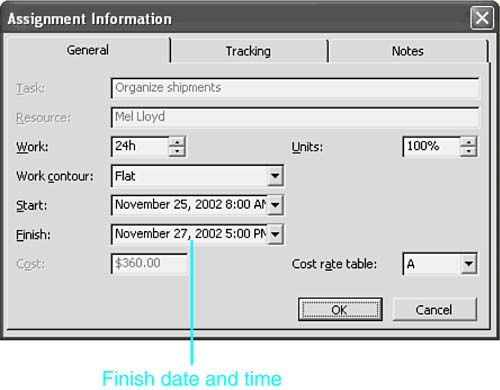
If the purpose for delaying an assignment is to avoid an overallocation, you should use the Leveling Delay field, which is specifically designed to show delays due to overallocations. If you later want to remove all the leveling delays that you or Microsoft Project have inserted, you can use the Clear Leveling command to remove the delay if it's in this field. The Leveling Delay field is not included in the standard Usage table, but you can easily add it to the table by clicking the column heading where you want the field to go and choosing Insert, Column. In the Column Definition dialog box, choose Leveling Delay in the Field Name box and click the Best Fit button to adjust the column width to the widest entry. You might need to adjust the vertical divider bar so that you can see the new column. NOTE Unlike task delay values, which are elapsed time periods, leveling delay values are regular, nonelapsed, time periods. Figure 11.27 shows the Leveling Delay field added to the table in the top pane. Note the delay in Mel's Process Orders assignment. Figure 11.27. You can use the Leveling Delay field in a Usage table to enter and remove assignment-leveling delays. To remove the delay, type or use the spinner control to select zero. NOTE The Leveling Delay field only accepts zero or positive numbers for projects that are scheduled from a start date. It only accepts zero or negative numbers for projects that are scheduled from a finish date. To edit the timephased data, select the cells that contain work that is to be delayed and press the Insert key. The cells you selected shift to the right, also pushing to the right all later work cells for the assignment. The Contoured indicator then appears in the Indicators column for the assignment. TIP You might need to zoom in to see smaller time units, to detect exactly how many days and hours the assignment needs to be delayed. To do this, zoom in until you can clearly see exactly when the task that is not being delayed finishes. Then shift the work for the delayed task one cell further to the right. To remove the delay, select the assignment cells that have 0h in them and press the Delete key. All work cells to the right of the selection then shift to the left. If you want to delay the assignment by modifying the start date and time for the assignment until just after a conflicting assignment is completed, you need to be able to determine exactly when the conflicting assignment finishes. To determine the finish time, you must first instruct Microsoft Project to display time along with dates. To display dates with the time of day appended, choose Tools, Options and display the View tab. In the Date Format box, select from the drop-down list one of the formats that includes the date and time of day. In this example, we will delay Mel's Process Orders assignment so that it starts immediately after the conflicting assignment Organize Shipments finishes. You can find out when the Organize Shipments assignment finishes by double-clicking that assignment to display its Assignment Information dialog box. In Figure 11.28, the Assignment Information dialog box for Organize Shipments shows that the task finishes on November 27, 2002, at 5:00 p.m. The Process Orders task would be delayed to start on November 28, 2002, at 8:00 a.m. to resolve the conflict. Figure 11.28. You can use the Assignment Information dialog box to find out when an assignment finishes. To delay the start of an assignment, follow these steps:
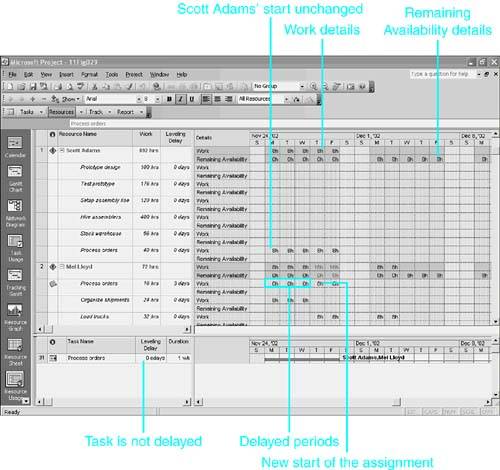
Figure 11.29 shows the effect of delaying Mel's assignment on the Process Orders task from Monday to Thursday. The original cells for his assignment now have 0h in them, and Mel is no longer overallocated during that period. You can also see that Scott Adams' assignment on that same task continues to start on Monday. Figure 11.29. The timephased data in the Resource Usage view shows the delayed start of the assignment with 0h entries in the delay periods. When you delay an assignment by editing the Start field of the Assignment Information dialog box or by editing the timephased data in the grid, Microsoft Project translates the difference between the previous start date and the new one as an assignment delay and stores that value in the Assignment Delay field. You can also delay an assignment by entering the amount of the delay directly into the Assignment Delay field. However, as pointed out earlier, if the purpose of the delay is to level resource usage, the Leveling Delay field is a better field to use. NOTE The Assignment Delay and Leveling Delay fields produce the same resultthey delay the start of the assignmentbut there are some differences between them. Microsoft Project uses the Leveling Delay field to enter a delay when you use the Level Now command to resolve resource overallocations. There is also a Clear Leveling command that resets all Leveling Delay values to zero. Microsoft Project does not make entries in the Assignment Delay field, nor is there a command to clear those entries. The Assignment Delay field is intended to be used to delay one resource's assignment when there is a valid operational reason for the delay (for example, if one resource contributes finishing touches on a task and should be scheduled at the end of the task).
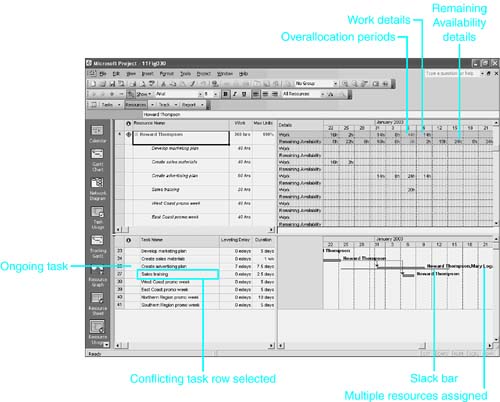
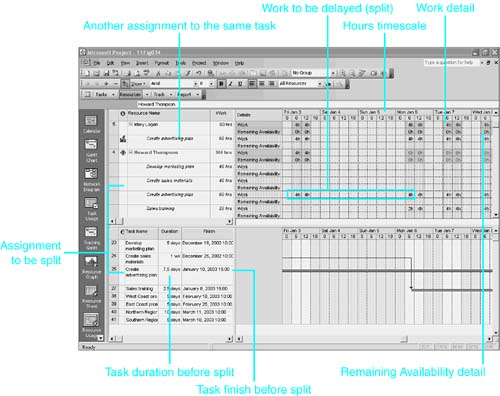
The Assignment Delay field is not included in the standard Usage table, but you can easily add it to the table by clicking the column heading where you want the field to go and choosing Insert, Column. In the Column Definition dialog box, choose Assignment Delay in the Field Name box and click the Best Fit button to adjust the column width to the width of the widest entry. The Clear Leveling command does not reset assignment delays to zero. The easiest method to use if you want to remove an assignment delay is to display the Assignment Delay field in the Resource Usage view or the Task Usage view and change delay values to zero. You can also find inserted nonworking time periods in the grid and delete them, but it's easier to identify nonzero values in the Assignment Delay field. TIP If you want to review all the assignment delays or leveling delays in a project, you can design a filter to display only tasks where the Assignment Delay field is not equal to zero or the Leveling Delay field is not equal to zero. Using the criterion Not Equal to Zero instead of Greater Than Zero allows the filter to find both projects with positive delay values (those scheduled from a fixed start date) and projects with negative delay values (those scheduled from a fixed finish date). Splitting a TaskSuppose that an overallocation occurs because an assignment starts while another assignment, which has already started, is still in process. You could, as in the preceding examples, delay all work on the new assignment until the already started assignment is finished. Or you could interrupt the work on the already started assignment (that is, split the assignment) until the new assignment is completed. If you introduce the split at the task level, all assignments to the task are split at the same point. If you just split the assignment itself, other resource assignments to the task are not split. In Figure 11.30, the Create Advertising Plan task is assigned to both Howard Thompson and Mary Logan. It is scheduled to be already started when the Sales Training task starts. Howard Thompson is assigned to both tasks, and he is overallocated during the period when the tasks overlap. Figure 11.30. When two tasks contend for the same resource, you can split one task to work around the other. The ongoing task, Create Advertising Plan, has slack (as evidenced by the Slack bar in the bottom pane) and its finish can be delayed without affecting the project finish date. However, the new task, Sales Training, does not have a Slack bar and should not be delayed if you want to avoid delaying the finish of the project. You could split Howard's assignment to the Create Advertising Plan task and avoid delaying the project. Splitting the task would split both Howard's and Mary's assignments. If you split just Howard's assignment, Mary would continue her work as scheduled and Howard would complete his after the Sales Training is finished. The duration for the Create Advertising Plan task would be increased to incorporate Howard's delayed work.
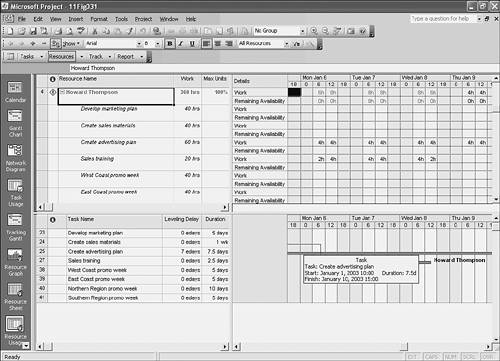
TIP If you were to display the Task Usage view in the top pane, you could split a task by inserting nonworking cells in the timephased data for the task. To do so, select the cell or cells for the time period when the split should occur and press the Insert key. You first need to determine exactly when the split should start and when it should end. You want the split to start when the new task starts and to end when the new task finishes. You can determine the start and finish of the new task by double-clicking it in the bottom pane to view the Task Information Form view. The start and finish dates are on the General tab. You could also scroll the table in the bottom pane to the right to see the Start and Finish fields for the task. In the table in Figure 11.31 you can see the start and finish dates for the Sales Training task. The task starts January 6, 2003, at 10:00 a.m. and finishes on January 10, 2003, at 3:00 p.m. Figure 11.31. You can use the Split Task tool to split taskbars in the bottom pane of the Resource Allocation view. TIP When you scroll a table horizontally and the Name field will scroll out of view, you can select the row ID to highlight the entire row (as was done previously, in Figure 11.30). Then you can easily identify the row when you get to the column you want to examine (as in Figure 11.31). TIP It's a good idea to have the time of day included in the date format so that you can coordinate the timing of the tasks.
To split a task in the Leveling Gantt Chart view, follow these steps:
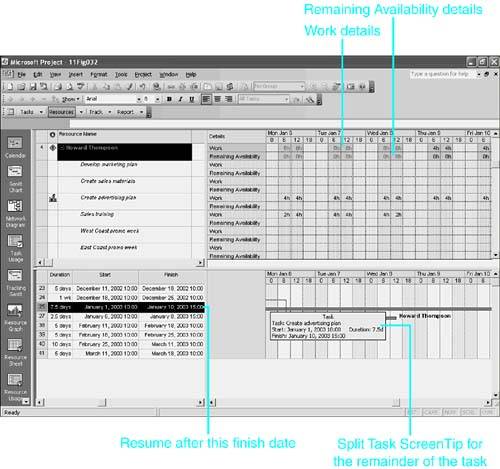
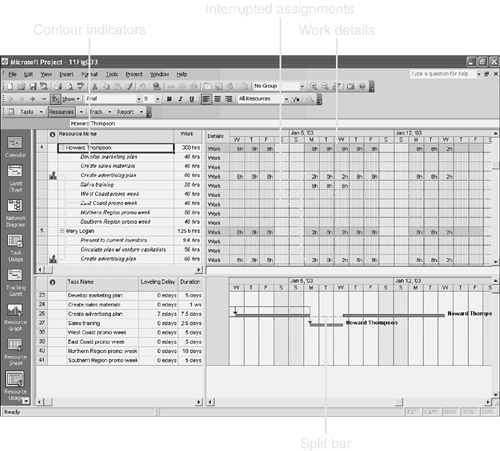
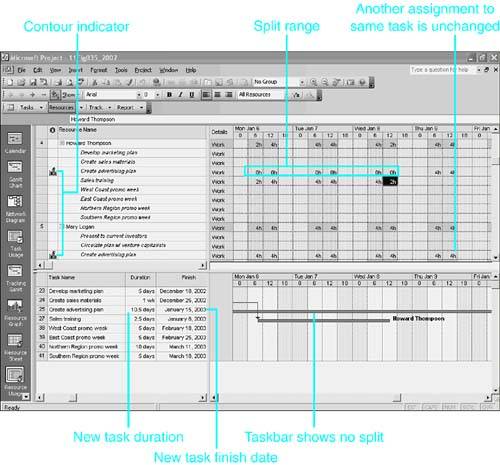
TIP When you are dragging part of the task to a new date, if the destination date is off the screen, you can drag the pointer just beyond the edge of the screen slowly; the timescale scrolls until you reach the destination. Figure 11.33 shows the task after the split has been created, with the timescale formatted the same as in Figure 11.31. In Figure 11.33, you can see both assignments to the task that was split. Mary Logan and Howard Thompson both have a 0h cell in the middle of their assignments, during the period for which the taskbar shows the split. Figure 11.33. Splitting a task also splits all assignments to the task. To remove a split in a task, you use the mouse to drag the part of the task that's on the right toward the part on the left. When they touch, Project removes the split and rejoins the taskbar. Splitting Individual AssignmentsIn Figure 11.32, the task was split to resolve an overallocation problem, and that split all resource assignments for the task, whether they were overallocated or not. You can also split just the assignment for the resource that is overallocated (Howard Thompson), thus leaving other assigned resources (Mary Logan, in this case) on their existing schedules. To split an assignment, you must open either the Resource Usage view or the Task Usage view and edit the timephased work cells for the assignment. Select the cells where the interruption will take place and press the Insert key to shift those work amounts to later dates. In Figure 11.34, the Zoom In tool has been used to view quarter-days because we need to reschedule the assignment to stop at 10:00 a.m. and resume at 3:00 p.m. If those particular hours were not shown on the timescale, you would need to zoom in further until the time periods you needed to schedule appeared in the timescale. Figure 11.34. To split an assignment, you select the cell or cells where the split should occur and press the Insert key. In the table on the left of the bottom pane in Figure 11.34, the columns have been rearranged so that you can see the task's duration and finish date. Before the assignment is split, the task duration is 7.5 days and the finish date is January 10, at 3:00 p.m. The timephased work cells where the split will occur are selected in the figure. With the cells selected, you can create the split by pressing the Insert key or by choosing Insert, Cell from the menu. The contents of the selected cells are then shifted to the right, and all cells to the right of the insertion cells are shifted also. CAUTION If you type in an assignment work cell instead of pressing the Insert key, you create a split in the assignment, but the work scheduled for that day is lost. Figure 11.35 shows the assignment schedule after the split has been inserted. The cells that were selected now have zero hours of work for Howard Thompson, but Mary Logan still has work scheduled in those same time periods. The taskbar in the Gantt Chart view does not show a split because Mary Logan is continuing to work during the period of the split. The total work for the assignment has not changed, but the duration of the task has increased from 7.5 days to 10.5 days, and the finish date is pushed back from January 10, 2003, to January 15, 2003. Notice the contour indicator on the assignment row, which shows that the timephased values for the assignment have been edited. Figure 11.35. The split appears as cells with zero work in the assignment row. TIP To select a series of assignment cells, drag the mouse across them or, after selecting the first cell, hold down the Shift key as you click the last cell to select. You can then press the Insert key to shift work assignments past the last selected cell. To remove the splits in an assignment, select the cell or cells that have 0h in them and press the Delete key. Unfortunately, there is no easy way to identify the assignments that have been edited, other than to look for the existence of the Contour indicator on those assignment rows. In order to find the edited cells, you have to scroll the timescale for the contoured assignment to find cells that contain 0h. TIP If you select and remove 0h cells by pressing Delete, the contour indicator is still displayed. If you have deleted a delay or split and you're sure there are no other edited changes you want to preserve, you can remove the Contour indicator by double-clicking the assignment to display the Assignment Information dialog box and selecting Flat on the drop-down list in the Work Contour box. |
| < Day Day Up > |
EAN: 2147483647
Pages: 283
 For a thorough explanation of working with the Resource Availability table,