Debugging
You've designed your solution and written the code. You start to load it into the browser with high hopes and excitement, only to be faced with an big ugly gray box telling you that the VBScript engine doesn't like what you've done. So where do you start?
When confronted with a problem, you first need to know the type of error you're looking for. Bugs come in two main flavors:
Syntax errors
You may have spelled something incorrectly or made some other typographical or syntactical error. When this happens, usually the program won't run at all.
Logical errors
Although syntactically correct, your program either doesn't function as you expect or it generates an error message.
Bugs appear at different times, too:
At compile time
If a compile-time error is encountered, an error message appears as the page is loading. This usually is the result of a syntax error.
At runtime
The script loads OK, but the program runs with unexpected results or fails when executing a particular function or subroutine. This can be the result of a syntax error that goes undetected at compile time (such as an undefined variable) or of a logical error.
Let's look at each type of bug individually. We'll begin by looking at syntax errorsfirst at compile time and then at runtimebefore looking at logical errors.
4.1.1 Syntax Errors
Ordinarily, objects containing script are compiled as they are loaded, and are then immediately executed. Errors can occur at either stage of the process. Although the distinction between compile-time and runtime errors is rapidly losing its importance, it is sometimes helpful to know that the entire script compiled successfully and that the error was encountered at a particular point in the script.
4.1.1.1 Syntax errors at compile time
Syntax errors at compile time are usually the easiest to trace and rectify. When the script loads, the host calls the scripting engine to compile the code. If the VBScript engine encounters a syntax error, it cannot compile the program and instead displays an error message.
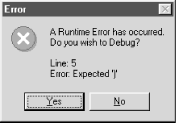
For instance, an attempt to run the client-side script shown in Example 4-1 produces the error message shown in Figure 4-1. In this case, it's very easy to identify the source of the error: in the call to the LCase function, the closing parenthesis is omitted.
Example 4-1. Client-side script with a syntax error
Syntax Error
Figure 4-1. Error message generated by Example 4-1
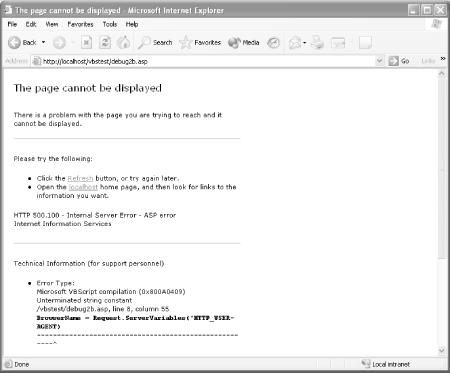
When using ASP, diagnosing and fixing compile-time errors is a bit more difficult, since errors appear on the client browser, rather than in a dialog displayed on the server. For example, the simple ASP page shown in Example 4-2 displays the error message shown in Figure 4-2. This is a fairly standard ASP message display. The error code (which is expressed as a hexadecimal number in this case) appears to be meaningless. The line number causing the error, however, is correctly identified, and the description informs us of the exact cause of the error. So we can quickly see that we've omitted a closing quotation mark around the argument we passed to the ServerVariables property of the Request object.
Example 4-2. ASP page with a syntax error
ASP Syntax Error
Welcome to Our Web Page!
We are always happy to welcome surfers using <%= BrowserName %>.
Figure 4-2. ASP error information
4.1.1.2 Syntax errors at runtime
Very often, a syntax error in VBScript appears only at runtime. Although the VBScript engine can successfully compile the code, it cannot actually execute it. (Note, though, that you may not actually be able to tell the difference between compile-time and runtime behavior in a relatively short script, since these two behaviors occur one after the other.) Example 4-3 shows a part of an ASP page that, among other things, tries to determine whether an ISBN number is correct. But attempting to access this page generates a runtime error, which is shown in Figure 4-3.
Example 4-3. Excerpt from an ASP page that generates an error
Verifying an ISBN
Title Information
Title: <%=Server.HTMLEncode(Request.Form("txtTitle")) %>
ISBN: <% sISBN = Server.HTMLEncode(Request.Form("txtISBN")) If Not VerifyIBN(sISBN) Then Response.Write "The ISBN you've entered is incorrect." Else Response.Write sISBN End If %>
Figure 4-3. Error message generated by Example 4-3
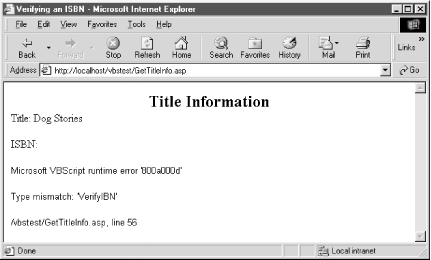
In this example, all code has successfully compiled, since the server was able to begin returning output from the page. At compile time, even though the VerifyIBN (instead of VerifyISBN) function does not exist, the line of code appears to the compiler to identify a valid function, since it contains the correct syntax for a function call:functioname is followed by argumentlist. The VBScript engine can therefore compile the code into a runtime program, and an error is generated only when the engine tries to pass argumentlist to the nonexistent function VerifyIBN.
4.1.2 Logical Errors
Logical errors are caused by code that is syntactically correct that is to say, the code itself is legal but the logic used for the task at hand is flawed in some way. There are two categories of logical errors. One category of errors produces the wrong program results; the other category of errors is more serious, and generates an error message that brings the program to a halt.
4.1.2.1 Logical errors that affect program results
This type of logical error can be quite hard to track down, because your program will execute from start to finish without failing, only to produce an incorrect result. There are an infinite number of reasons why this kind of problem can occur, but the cause can be as simple as adding two numbers together when you meant to subtract them. Because this is syntactically correct (how does the scripting engine know that you wanted "-" instead of "+"?), the script executes perfectly.
4.1.2.2 Logical errors that generate error messages
The fact that an error message is generated helps you pinpoint where an error has occurred. However, there are times when the syntax of the code that generates the error is not the problem.
For instance, Example 4-4 shows a web page that invokes an ASP page shown in Example 4-5. The ASP page in turn generates a runtime error, which is shown in Figure 4-4.
Example 4-4. Division.htm, a web page for developing division skills
A Test of Division
Enter Number:
Enter Divisor:
Enter Quotient:
Example 4-5. GetQuotient.asp, the ASP page invoked by division.htm
Checking your division...<% If IsCorrect( ) Then Response.Write "
Correct!
" Response.Write "Your answer is correct.
" Else Response.Write "
Incorrect!
" Response.Write "Your answer is wrong.
" End If %> <%=nNum1 %> divided by <%=nNum2 %> is <%=nQuot %>
Answer <a href="Division.htm">another division problem</a>.
Figure 4-4. Error display from Example 4-5
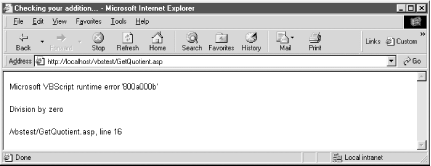
The problem here is not one of syntax. Line 16 (the line with the If statement in the IsCorrect function) is syntactically correct. We won't get this error every time that we display the HTML page and it invokes the ASP page in Example 4-5. However, the values of variables can change (after all, that's why they're called variables), and here, the values of the variables in the ASP page are defined by the values that the user enters into the web page's text boxesin this case, by the user entering a 0 into the txtNum2 text box in Example 4-4. It could be said that this type of logical error produces a syntax error because the following syntax:
If (nNum1 / 0 = nQuot) Then
entails a division by zero and is therefore illegal.
In this case, we should have checked the value of the divisor to make sure that it was nonzero before calling the function. But more generally, this scenario in which the value of a variable is incorrect either all of the time or, more commonly, only under certain conditions is the essence of the logical error.
4.1.3 The Microsoft Script Debugger
The Script Debugger has been designed to allow you to debug your scripts while they are running in the browser. You can trace the execution of your script and determine the value of variables during execution. The Script Debugger is freely downloadable from the Microsoft web site. (For details, see the Microsoft Scripting home page at http://msdn.microsoft.com/scripting/.) It arrives in a single self-extracting, self-installing archive file, so that you can be up and running with the debugger in minutes.
|

4.1.3.1 Launching the Script Debugger
The Script Debugger is not a standalone application in the sense that you cannot launch it on its own. Instead, the Script Debugger runs in the context of the browser or of WSH. When you are runningInternet Explorer, there are two ways to access the debugger:
Select the Script Debugger option from the View menu
A submenu is displayed that allows you to open the debugger to cause a break at the next statement.
Automatically when a script fails for any reason
This launches the debugger and displays the source code for the current page at the point where the script failed.
When you are running a WSH script, you can launch the debugger if an error occurs by supplying the //D switch, or you can run a script in the context of the debugger by supplying the //X switch. Figure 4-5 shows the Script Debugger.
Figure 4-5. The Microsoft Script Debugger
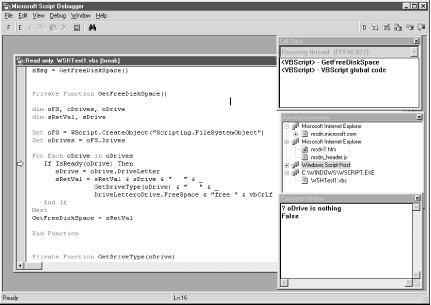
4.1.3.2 The Script Debugger interface
When you launch the Script Debugger, you're faced with a number of different windows, each with its own special function:
The Script window
This contains the code for the current HTML page just as if you'd selected the View Source option to launch Notepad. It is from the script window that you control how the debugger steps through program execution and that you watch the execution of the script. The script in this window is read-only.
The Running Documents window
This displays a graphical view of the applications that support debugging and the documents that are active in them. To open a particular document, simply double-click its name in the Running Documents window.
The Call Stack window
This displays the current hierarchy of calls made by the program. If the Call Stack window is hidden, you can display it by selecting the Call Stack option from the View menu. The Call Stack window allows you to trace the path that program execution has followed to reach the current routine (and, implicitly, that it must also follow in reverse to "back out" of these routines). For example, let's say you have a client-side script attached to the OnClick event of a button called cmdButton1, which in turn calls a function named sMyFunction. When sMyfunction is executing, the call stack will be:
cmdButton1_OnClick
sMyFunction
This allows you to see how program flow has reached the routine it's currently in. It is all too easy when you have a breakpoint set in a particular function to lose track of how the script reached the function. A quick glance at the Call Stack window will tell you.
The Command window
This is the most important part of the debugger. If you have experience in Visual Basic, you can now breath a sigh of relief! The Command window allows you to interrogate the script engine and find the value of variables, expressions, and built-in functions. If the Command window is not visible, you can open it by selecting the Command Window option from the View menu. To use the Command window, type a question mark (?) followed by the name of the variable or value you wish to see, then press Enter. For example:
? sMyString
"Hello World"
4.1.3.3 Tracing execution with the Script Debugger
The goal of tracing program execution is to discover, in a logical sequence, how your program is operating. If your program runs but generates an error message or produces results that are inconsistent with what you expected it is obviously not operating according to plan. You therefore need to follow the flow of your program as it executes, and at various stages, test the value of key variables and build up an overall "picture" of what is really happening inside of your program. This should enable you to discover where and why your program is being derailed.
To trace the execution of your script, you need a way to "break into" the script while it is running, and then to step through each line of code to determine what execution path is being followed or perhaps where the script is failing. The Script Debugger gives you two ways to halt execution and pass control over to the debugging environment:
Break at Next Statement
The simplest option is to select the Break at Next Statement option from the Script Debugger's Debug menu (or from the Script Debugger submenu of the Internet Explorer View menu). Then run your script in the normal way in the browser. As soon as the first line of scripting code is encountered by the browser, execution is suspended, and you have control over the script in the debugger. However, the part of the script you want to concentrate upon may be many lines of code further on from the first, in which case you will waste time stepping through to the portion that interests you.
Set Breakpoint
You will mostly have a good idea where your code is either failing or not producing the desired results. In this case, you can set abreakpoint by placing your cursor on the line of code at which to halt execution, and then either pressing F9 or selecting Toggle Breakpoint from the Script Editor's Debug menu. A line's breakpoint set is highlighted in red. Run your script from the browser. When the code containing the breakpoint is reached, execution is suspended; you have control over the script in the Debugger.
When the code has been suspended, it must be executed manually from the debugger. There are three methods you can use for stepping through a script one line at a time. For each method, you can either select an option from the debugger's Debug menu or press a keyboard combination. The options are:
Step Into (F8)
This executes the next line of code. Using Step Into, you can follow every line of execution even if the next line to be executed is within another subroutine or function.
Step Over (Shift-F8)
This executes the next line of code only within the current subroutine or function. If a call is made to another subroutine or function, the procedure executes in the background before control is passed back to you in the current subroutine.
Step Out (Ctrl-Shift-F8)
This is required only if you have chosen Step Into and your script has called a function or subroutine. In some cases, you may realize that this is a lengthy procedure that has no consequence to your debugging. In this case, you can select Step Out to automatically execute the rest of the function and break again when control returns to the original subroutine or function.
4.1.3.4 Determining the value of a variable, expression, or function at runtime
One of the main functions of the Immediate window is to allow you to check the value of a particular variable while the script is running. The most frustrating part about debugging a script prior to the release of the Script Debugger was that you could see the results of your script only after it had run (or failed). Most debugging requires you to get inside the script and wander around while it's in the middle of execution.
In the absence of a debugger, many programmers and content providers inserted calls to the Window.Alert method (for client-side scripting), to the Response.Write method (for server-side scripting), or to the MsgBox function (for WSH scripts and Outlook forms) to serve as breakpoints in various places in a script. The dialog would then display thevalues of particular variables or expressions selected by the programmer. Although this can still be the most efficient method of debugging when you have a very good idea of what's going wrong with your code, it becomes very cumbersome to continually move these calls and to change the information the dialogs display when you don't really have a very good idea of where or why your script is failing.
In contrast, using the Command window to display the value of any non-object variable is easy. Simply type a question mark (?) followed by a space and the variable name, then press Enter. The Script Debugger will then evaluate the variable and display its value in the Immediate window. Note, though, that if your script requires variable declaration because you've included the Option Explicit statement, you must have declared the variable and it must be in scope for the debugger to successfully retrieve its value; otherwise, an error dialog is displayed. The debugger cannot evaluate the result of user-defined functions; it can evaluate only intrinsic functions (functions that are a built-in part of the scripting language).
But you aren't limited to using the Command window to view the values of variables; you can also use it to inspect the values of expressions, of VBScript intrinsicfunctions, and of the properties and methods of particular objects. To see how this works, and also to get some experience using the Script Debugger, let's try out the web page and client-side script in Example 4-6. Basically, the user should be able to enter a number and, if it is actually between zero and two, be shown the element of the array at that ordinal position. Somewhere in this code is a sneaky little bug causing problems. The script always tells the user that the number entered into the text box is too large, which indicates that it is greater than the upper boundary of the array. But this isn't the case; the user can enter the numbers 0 or 2 and still be told that the number is too large.
Example 4-6. A badly behaving web page
Testing the Script Debugger
Input a Number (0-2):
To debug the script in Example 4-6, you can place a breakpoint on the first line of the sGetValue function, since this is probably where the problem lies. Then run the script and enter the number 2 into the text box txtText1. When execution is suspended, you can investigate the values of the program's variables. As you can see, the call to the sGetValue function has a single argument, iTest, which is passed to the function as the iVal parameter. So our first step is to determine the value of iVal at runtime by entering the following into the Command window:
? iVal
Press Enter, and the debugger displays the result:
2
Next, find out what the script thinks the upper boundary of the array is by entering the following in the immediate window and pressingEnter:
? UBound(sTest)
Note that here you're not simply asking for the value of a variable; you're actually asking the debugger to evaluate the UBound function on the sTest array and return the result, which is:
2
So iVal is not greater than UBound(sTest). Next, go back to the script window and press F8 to follow the flow of program control. Execution is suspended on the following line, where the string "Number too big" is assigned to the variable sGetValue. That indicates that the scripting engine has evaluated the expression incorrectly and has decided that iVal is greater then UBound(sTest). So go back to the Command window, and this time try to evaluate the complete expression:
? iVal > UBound(sTest)
As you might expect from the appearance of the "Number too big" dialog when the script is run, the result of the expression is True, even though the expression that is evaluated (once we replace the variable and expression with their values) is 2 > 2, which is clearly False. Given this apparent incongruity, it seems likely that our problem may be centered in the data types used in the comparison. So try the following:
? TypeName(UBound(sTest))
Here, you're asking the debugger to evaluate the UBound function on the sTest array, and, by calling the TypeName function, to indicate the data type of the value returned by the UBound function. The result is:
Long
Now find out what data type iVal is:
? TypeName(iVal):
The debugger returns:
String
Aha! The Script Debugger shows that, in reality, you're performing the following comparison:
If "2" > 2 Then
which of course is nonsense! Remember that iVal is the name within the sGetValue function of the iTest variable in the button's OnClick event procedure. And iTest in turn represents the value retrieved from the textbox, which of course must be string data, as typing the following into the Command window establishes:
? TypeName(iTest)
String
Try this in the debugger:
? CLng(iVal) > UBound(sTest)
Success! The Command window shows:
False
You can see from this debugging exercise that the Command window is a powerful tool allowing you to perform function calls, evaluate complete expressions, and try out different ways of writing your code.
4.1.3.5 Changing variable values at runtime
Another use for the Command window is to assign a new value to a variable. For example, if you open the web page and client-side script shown in Example 4-7 and click the button, you'll find that an error halts execution on line 10 with the message "Invalid procedure call or argument". If you use the Command window to determine the value of myNum, which specifies the starting position of the InStr search, you'll find that it was erroneously set to -1, an invalid value that generated the runtime error.
Example 4-7. Runtime error caused by an invalid argument
Logical Error
You can, however, correct the error and continue executing the script. Just place a breakpoint on the offending line and click on the button when the browser displays it so that the script executes. When program execution halts, you can check the value of myNum :
? myNum
-1
Part I: The Basics
Introduction
- Introduction
- VBScripts History and Uses
- What VBScript Is Used For: Gluing Together Objects
- Differences Between VBScript and VBA
Program Structure
Data Types and Variables
Error Handling and Debugging
VBScript with Active Server Pages
Programming Outlook Forms
- Programming Outlook Forms
- Why Program Outlook Forms?
- The Form-Based Development Environment
- Running Your Code
- Program Flow
- The Outlook Object Model
- Accessing Other Object Models
Windows Script Host 5.6
- Windows Script Host 5.6
- Why Use WSH?
- Program Flow
- The WSH Object Model
- WSH Language Elements
- Accessing Other Object Models
VBScript with Internet Explorer
- VBScript with Internet Explorer
- The SCRIPT Tag
- What Can You Do with Client-Side Scripting?
- Understanding the IE Object Model
Windows Script Components
- Windows Script Components
- The Script Component Wizard
- Writing Component Code
- Using the Component
- WSC Programming Topics
Part II: Reference
Part III: Appendixes
Appendix A. Language Elements by Category
- Appendix A. Language Elements by Category
- Section A.1. Array Handling
- Section A.3. Comment
- Section A.5. Data Type Conversion
- Section A.6. Date and Time
- Section A.7. Dictionary Object
- Section A.8. Error Handling
- Section A.9. File System Objects
- Section A.10. Information Functions
- Section A.11. Mathematical and Numeric
- Section A.12. Miscellaneous
- Section A.13. Object Programming
- Section A.14. Program Structure and Flow
- Section A.15. String Manipulation
- Section A.16. User Interaction
- Section A.17. Variable Declaration
Appendix B. VBScript Constants
- Appendix B. VBScript Constants
- Section B.1. Color Constants
- Section B.2. Comparison Constants
- Section B.3. Date and Time Constants
- Section B.4. Date Format Constants
- Section B.5. Error Constant
- Section B.6. Logical and TriState Constants
- Section B.7. Message Box Constants
- Section B.8. String Constants
- Section B.9. Variable Type Constants
Appendix C. Operators
- Appendix C. Operators
- Section C.1. Arithmetic Operators
- Section C.2. String Operator
- Section C.3. Comparison Operators
- Section C.4. Logical and Bitwise Operators
- Section C.5. Operator Precedence
Appendix E. The Script Encoder
EAN: 2147483647
Pages: 335
