Changing the Map View
While viewing a particular map, you may wish to change your view of the map, such as zooming in or out on the map, or panning left, right, up, or down on the map. You may do this by selecting the map you want to change the view of and choosing options from the Map pull-down menu. Or, simply right-click on the map in the Preview tab and choose options from the pop-up menu.

-
To zoom in on a map Choose the Zoom In option. This will change the mouse cursor to a magnifying glass with a plus sign. Draw an elastic box around the portion of the map you want to zoom in on. The map will resize to show your chosen area.
-
To zoom out from the map Choose the Zoom Out option. This will change the mouse cursor to a magnifying glass with a minus sign. Every time you click on the map, it will zoom out a predetermined level.
-
To pan left, right, up, or down Choose the Pan option. This will change the mouse cursor to an arrow/pan cursor. Hold down the mouse button on the map and move your mouse left, right, up, or down. The map will reposition accordingly .
-
To recenter the map to its original position Choose the Center Map option.
The Map Navigator
Another way to change your view of a map in Crystal Reports 10 is the Map Navigator. When you click on a map to select it in the Preview tab, a smaller thumbnail of the map appears in its own window in the lower right of the map. You may drag the Map Navigator by its title bar to move it around inside the map, as well as resize the window by dragging a border of the window.
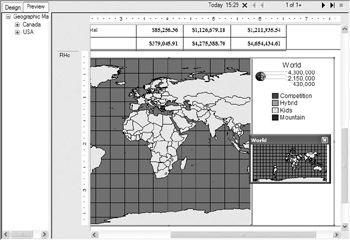
A shaded outline in the Map Navigator shows the portion of the map that you see in the rest of the map view. If you zoom in or out on the map (using the pop-up menu options), the outline shrinks or expands, outlining the zoomed-in portion of the map. You can also use the outline in the Map Navigator to zoom in, zoom out, and pan the view to a particular area of the map. If you point inside the outline, your mouse cursor changes to a four-arrow move cursor; simply drag the outline around to pan to a different area of the map. If you point to a corner of the outline, the mouse cursor changes into a diagonal two-arrow cursor. Drag the corner to expand or contract the outline. This zooms in or out on the map.
You may hide the Map Navigator by clicking the X on its upper right-hand corner. However, if you then deselect and reselect the map, the Map Navigator will return. If you want to turn the Map Navigator display off on a more permanent basis for all instances of maps, you may uncheck the Map Navigator option in the Map pull-down menu or pop-up menu that appears when you right-click on a map.
Resolving Data Mismatches
One of the peculiarities of geographic maps is potential mismatches of geographic data in the database to what the map understands. If your database contains, for example, spelled- out state names instead of two-letter abbreviations, the map will not be able to resolve the names to actual states. Crystal Reports allows you to resolve data mismatches that may cause database data to be improperly mapped, or not mapped at all.
If you suspect that the map may not be interpreting database data correctly, first select the map that you wish to work with in the Preview tab (you can t resolve data mismatches in the Design tab). Then, choose Map Resolve Mismatch from the pull-down menus or right-click on the map and choosing Resolve Mismatch from the pop-up menu. This will display the Resolve Map Mismatch dialog box, with the Change Map tab shown first.
The map definition used to display the particular map you are working with will appear as both the current map and selected in the Available maps list. If you wish to display a different map definition, scroll through the list of available maps and choose another map. If, however, the mismatch involves a misspelling or misinterpretation of a particular country, state, city, or other geographical field, you ll need to resolve the mismatch on the Resolve Mismatch tab, shown in Figure 4-1 (it may take some time for this tab to appear, as Crystal Reports must build several lists on-the-fly when you choose this tab).
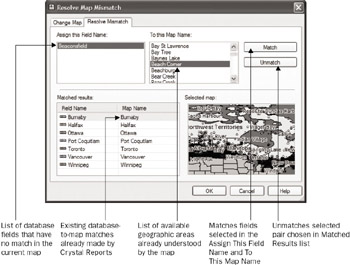
Figure 4-1: The Resolve Mismatch tab
You ll notice that any database values that have already been matched to map values by Crystal Reports will appear in the Match Results list. However, if there are database values that could not be matched, they will appear in the Assign This Field Name list in the upper left-hand corner. And, you ll find a list of all the available geographic values that the map understands in the To This Map Name list in the upper right-hand corner.
To match an unmatched database value to a map value, select the value you want to match in the Assign This Field name list. Then, scroll up and down in the To This Map Name list until you find the substitute data, which you can then select (typing letters on the keyboard will often select items in the list more quickly than using the scroll bar). Click the Match button, which adds the match to the Matched Results list. Each match you create is added to the bottom list, along with all assignments that Crystal Reports made previously. If you decide that you don t want to use an assignment (that either you made or was made automatically), select it in the Matched Results list and click the Unmatch button.
When you re finished assigning values, click the OK button to show the map with the updated mapping assignments.
Map Layers
A map is displayed in the Preview tab using layers. If you are looking at a USA map, for example, the map may be composed of layers consisting of USA, US Highways, and US Major Cities. You can think of a map layer as a transparency containing just that layer s information that lies on top of the lower layers, which lie on top of the map. By using layers, the map can be displayed showing different levels of detail, usually determined by how far in the map is zoomed. If you are fully zoomed out on the map, you ll only see the states. As you zoom in, you eventually see highways appear across the states. And, as you zoom in even further, you see dots and the names of cities within the states.
Although maps include layers in a default order with default settings, you can choose which layers to display, hide, include, or not include. You can also change the order in which the layers lie on the map, and change the zoom level at which layers become visible. To work with map layers, select the map you wish to work with in the Preview tab (you can t work with layers in the Design tab). Then, choose Map Layers from the pull-down menus, or right-click on the map and choose Layers from the pop-up menu. The Layer Control dialog box is displayed.
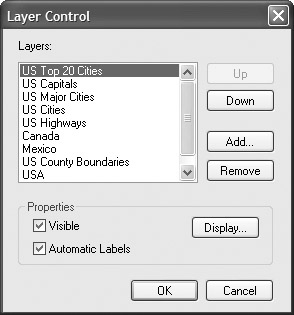
You see all the layers included in the map by default. You can change the order in which the layers appear by selecting an individual layer and then clicking the Up or Down button to change the order of the layers. If you want to hide a layer so that it doesn t show in the map, select the layer and clear the Visible check box. If you decide that you no longer want the layer at all, select it and click the Remove button.
If you later decide you want to redisplay a layer you removed earlier, or you want to add a new layer not already on the map, click the Add button. A File Open dialog box appears. Additional layers are located in \PROGRAM FILES\MAPINFO MAPX\MAPS. Point to that folder and look for the appropriate .TAB file. After you choose it, it appears in the Layer Control dialog box.
To change the zoom level at which a layer appears, select the layer and click the Display button. The Display Properties dialog box for that layer opens.
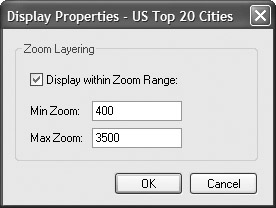
If you uncheck Display Within Zoom Range, the layer appears in the map at all times, regardless of the Zoom level. If you leave it checked, you can set the minimum and maximum Zoom levels at which the layer will become visible. After you make your choices, you can zoom in or out on the map to see the layer changes.
Figure 4-2 shows the same map at the same Zoom level with different settings for the US Highways layer.
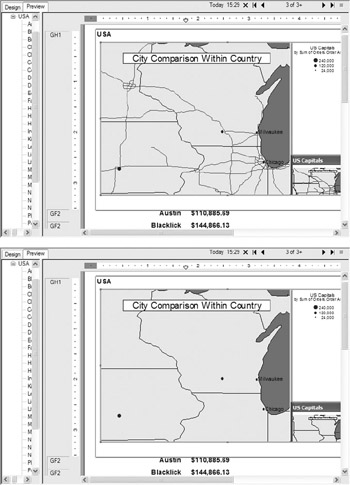
Figure 4-2: Maps with different US Highways layer zoom settings
EAN: N/A
Pages: 223