Covert Analysis
| | ||
| | ||
| | ||
Covert analysis is the mechanism by which activities can be monitored without alerting a suspect. Depending on the technique used and the sophistication (and wariness) of the user , covert system analysis may range from low risk to high risk. The risk levels of each covert action are detailed in the respective sections below.
Covert analysis is not limited to digital means. Hidden cameras are used extensively by physical security investigators and can even complement computer activity monitoring (it does not hurt to show that the suspect was sitting in front of his computer at the time the activity from his machine occurred). A frequent, non-digital covert action on corporate systems is a manual review (and sometimes imaging of drives , which is covered later in the "Main Memory Analysis" section) of the equipment and connections present, generally after hours.
Covert analysis activities can be broken in to two categories: actions taken to determine the current or prior state of a system and actions taken to monitor ongoing current or future system activity.
System State Analysis
Determining the current system state through covert analysis can provide pre-acquisition system details on what hardware or software clues to look for. It can also determine other potential investigation targets in case the investigation is larger than a single individual or device and can provide preinvestigation triage to rule out quickly potential suspects .
The current system state can be determined covertly and safely three different ways: using a forensic tool such as EnCase Enterprise, using remote administration tools such as Computer Management in Windows, or using Windows features to provide remote information. The use of EnCase Enterprise is covered in the "Main Memory Analysis" section later in the chapter. The other two techniques are covered here.
The easiest way to obtain remote information on a system covertly (when administrative rights to the machine are available) is to utilize Microsoft's remote management features. The primary remote management tool of use is the Computer Management console software, shown in Figure 8-1. Other Microsoft tools can be used to obtain remote information as well. Event Viewer and IIS Administrator are two other common, standalone tools with remote management capabilities.
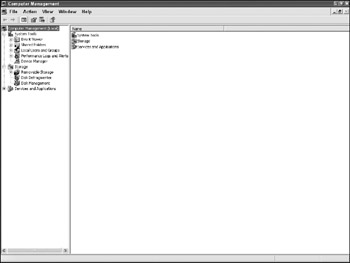
Figure 8-1: Computer Management console
The Computer Management console (CMC) is accessible as part of the Administrative Tools under the Control Panel on Windows 2000 and XP devices and has limited functionality to manage older Windows machines. The CMC can manage local or remote hosts . To manage a remote host, the Administrator chooses Action Connect To Another Computer and then puts in the domain name or IP address of the remote system. To fully manage the system, administrative rights on the appropriate domain or local system are necessary.
The CMC provides access to both current configurations and currently running applications. By providing insight into who is on a system and what they are currently doing, the computer investigator is able to perform quick reconnaissance without the end users being aware of the investigator's actions. Since the CMC uses standard Microsoft ports, there should be no suspicious traffic to alert the remote computer user of the actions being taken. This provides a low-risk method of obtaining remote information. An exceptionally wary user running port mapping tools such as FPort or looking at currently connected users, however, may detect activity. The investigator should have a plan of action for her machine or account use being detected and a plausible answer should the user question her presence.
| Tip | Use a generic-sounding administrator account and machine for this nothing labeled SecretInvestigationAdmin or the like. |
The CMC is broken into three major sections: System Tools, Storage, and Services and Applications. Depending on what is installed on the remote system and the OS version, additional features for managing IIS, viewing DNS logs, or other actions may be present. The investigative items of interest from the three main features are noted in the following sections.
System Tools
The primary system tool for remote access to past actions is Event Viewer. The Event Viewer activity log operates the same as using Event Viewer locally. The Application, Security, and System Event logs from the remote are all present. Details on Event Viewer usage in Forensics are listed in Chapter 11.
Shared Folders is a listing of the share and remote session activity on the system. It is broken into three sections: Shares, Sessions, and Open Files. Shares lists all of the file shares, including the administrative shares. Sessions provides the computer and users information on any users currently mapped to the listed shared drives and how long they have been active or idle. Open Files lists the specific files those users have open, which is great if one catches a suspect in the act of having a forbidden file open .
Local Users and Groups provide details on the names of local system users and groups. The association of specific accounts (local accounts or domain accounts) with a local administrators group , or the presence of unusual local groups may signify inappropriate activity.
| Note | Windows automatically creates administrative shares (accessible to the Administrators group) for each drive in addition to an Admin$ (to the Windows directory), print$ (for sharing of printers) and IPC$ (for Inter-Process Communications) share. Administrative shares have a dollar sign as the last character of their share name and are not visible through Network Neighborhood when viewing the available shares on a system. |
Performance Logs and Alerts are a remote view into the Performance Monitoring system in Windows if enabled. Performance logs are not generally used in an investigation unless a denial-of-service attack is suspected and currently occurring or a resource- intensive task (for example, transferring of large files over the network) may be occurring. Additional counters for different disk, processor, memory, or network activity can be added remotely as needed.
Device Manager lists all of the currently installed devices on a system. If a USB drive or external DVD burner is installed, a modem is connected, or a second network card is installed, it will appear here. Devices shown in device manager may not be present at a later date in the case of removable devices, making the information displayed in Device Manager very important in establishing remote user actions. An example of Device Manager with several sections expanded is shown in Figure 8-2. The Storage Volumes subcategory is also of forensic interest. USB flash drives as well as Zip disks will appear as volumes under this heading. View the properties of each Generic Volume entry for details.
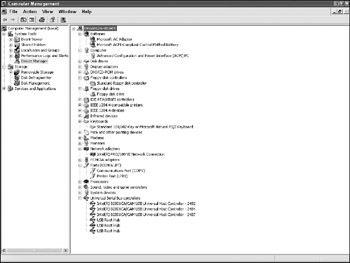
Figure 8-2: Device Manager
Storage
The Storage section provides detailed information on fixed and removable storage known to Windows (non-Windows partitions will not be present). There are three key sections: Removable Storage, Disk Defragmenter, and Disk Management. Disk Defragmenter does not have an investigative use and running it can greatly alter disk information. However, both the Removable Storage and Disk Defragmenter sections are of interest to an investigator.
Removable Storage provides details on all devices with removable media except floppy disks. Note that USB and FireWire solid-state drives. Both flash-and hard-disk based drives are listed in the Disk Management section. Listed devices include CD/DVDs, Zip disks, and tape drives. There are two sections: Media and Libraries. Media lists all currently mounted media, including tapes and optical media currently in the drives, which can show the presence of items that may later be removed. Libraries lists the actual devices themselves .
| Note | Although the terminology in Libraries appears to be specific to tape units, other removable media types will be listed as well. |
Disk Management displays the current format and status of all drive partitions, including those on connected FireWire or USB drives. The physical drives as well as their associated partitions (and any unrecognized or unpartitioned space) will be listed. Each partition will have the associated file system type and size available as well as total size present, allowing for appropriate planning for future acquisition. The presence of a RAID 5 array with 1.5 terabytes of storage may require a different strategy than a single 20GB drive. As with the preceding items, USB drives and other removable devices that may not be present at a later day can also be noted here.
Services and Applications
All of the currently running services and their details are viewable through this interface. The section contains three primary areas: Windows Management Interface (which is not useful in an investigation), Services, and Indexing Service.
Services is straightforward. It provides details on running services as well as other installed services. Services can be remotely started from the interface and details about their startup options viewed as well. If a given application is service based, the presence of a running service associated with that application is a good indicator of its presence on the suspect machine.
The Indexing Service section is one of the single most powerful remote forensic tools available but receives little fanfare. Microsoft provides an indexing service which will index content in any files the service has an appropriate filter for. By default, this includes all text-based documents, including XML, HTML, and Microsoft Office documents. Included in the remote interface to this service is the ability to search the index. While this does not take the place of sector-level text searches, it is substantially faster (almost instantaneous) and provides results from Office format files like Excel that cannot be found in basic text searches.
The indexing service needs to be started and be provided time to parse the drive contents before any searching can occur. To start the service, right-click on the Indexing Service option in the CMC and select Start. The service will then begin actively indexing all of the drive's contents. Indexing can take anywhere from several minutes to several hours. The indexing service runs with a low priority and will not degrade the interactive performance, making it a low-risk endeavor. When indexing is complete the main Indexing Service screen will show no items in the Docs to Index column.
| Note | This number may never actually reach zero. If the system is actively being used, there may be open documents that are constantly being re-indexed. If a small number of documents are listed as open (under ten), this may be as close to zero as the system will get. |
The specific drives and directories indexed are shown under the System Directories submenu. By right-clicking on the window listing the directories and selecting New Directory, additional directories can be added to the index. This allows for the addition of other drives (such as flash drives) which may be recently connected and not included in the default search. The System Properties dropdown menu lists the various metadata properties found in the indexed files these properties can be used in the search expressions in the Query the Catalog screen.
The least-known and most powerful feature of the indexing service for a computer investigation is the Query the Catalog option under System. This is a fully functionally, query-based search engine which allows for near-instantaneous searching of all indexed content. Searching can be done before all content has been indexed, but un-indexed items will not be included in the results. The Query option allows for complex SQL-based queries or queries using the Microsoft Indexing Service Query Language (MSISQL). The MSISQL provides complex Unix regular-expression based searching in addition to MSDOS wildcard searching of full text or any of the associated properties of a file. For example, to run an advanced query of all JPEG image files, a syntax for an Advanced Query would be:
#filename = *.jpg
For free-text searches, the name of the term , with or without wildcards, can be typed using the Standard Query option. The search results will return all of the files which match the query. These files can then be opened to analyze their contents or the presence of the suspicious names used as probable cause to image the drive. An example of a search for the words hack or crack is shown in Figure 8-3.
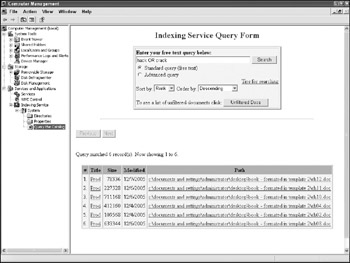
Figure 8-3: Indexing Service query results
Remote Enumeration
In addition to the CMC tool, the actual administrative shares for drives in use on the remote system may be mapped by an administrator with remote privileges using the Net Use command. To map a drive, the administrator types the following in the command line:
Net Use X: \suspectcomputer\c$
The drive letter (X:) is the letter of the drive the share will be mapped to. C$ is the administrative share for the C: drive. Other shares will be named appropriately for their respective drives. When the drive is mapped, the investigator will be able to access it from Windows Explorer in a non-forensically sound way (the disk can be written to or altered ). The investigator may then run tools against the drive (for example, search and analysis) or copy files from it as permissions allow.
Mapping of drives in this manner is not recommended for an extended analysis for several reasons:
-
The connection will show up on the remote computer if the suspect knows where to look.
-
The suspect may receive notifications that someone is still connected to her machine when she goes to shut down. A Net Use /Delete command needs to be run to unmap from the target drive.
-
Accidental alteration of the file system can occur and it makes proving no intentional or unintentional alteration occurred.
If the suspect's machine is not part of a domain or administrative rights on the machine are not available, a covert remote analysis is more difficult but not impossible . The steps for a covert remote analysis when privileges are not available are as follows :
-
Identify the operating system of the remote machine. OS fingerprinting can be performed with a reasonable degree of accuracy using nmap. Nmap looks at open ports, packet construction, and other areas to identify what operating system the remote system is running. This enables the determination of the Windows version for the examination of potential options for further analysis. Here are the results of Nmap run against a Windows 2003 server:
C:\Tools>nmap -O www.chadsteel.com Starting nmap 3.75 (http://www.insecure.org/nmap) at 2004-11-10 15:12 Eastern Standard Time Interesting ports on pcp08364727pcs.lndsd201.pa.comcast.net (68.42.19.63): (The 1642 ports scanned but not shown below are in state: closed) PORT STATE SERVICE 21/tcp open ftp 25/tcp open smtp 80/tcp open http 110/tcp open pop3 135/tcp filtered msrpc 136/tcp filtered profile 137/tcp filtered netbios-ns 138/tcp filtered netbios-dgm 139/tcp filtered netbios-ssn 445/tcp filtered microsoft-ds 902/tcp open iss-realsecure-sensor 912/tcp open unknown 1025/tcp open NFS-or-IIS 1026/tcp open LSA-or-nterm 1027/tcp open IIS 1029/tcp open ms-lsa 1030/tcp open iad1 1031/tcp open iad2 1080/tcp filtered socks 1720/tcp filtered H.323/Q.931 3389/tcp open ms-term-serv Device type: general purpose Running: Microsoft Windows 2003/.NET OS details: Microsoft Windows .NET Enterprise Server RC2 (Version 5.2, build 371 8.dnsrv.021114-1947) Nmap run completed -- 1 IP address (1 host up) scanned in 77.342 seconds
-
Identify services running on the remote system. Service identification can be performed by running a port scan (sending TCP or UDP packets to different ports on a system to gauge the response). The port banners are then reviewed and their port numbers compared to a list of well-known port numbers to determine what services are running and accessible on the remote machine. If the investigation hinges on a suspect running an FTP or IRC server, or if it is suspected that the individual has a mail server available, this will be reflected in the port scanning results. Nmap remains the predominant tool for port scanning. The preceding output shows the OS fingerprint results in addition to what ports are listening. A secondary tool for port scanning, which is useful in the enumeration step (Step 3) is SuperScan from Foundstone. The results of SuperScan run against the same system noted previously are shown in Figure 8-4. The details of the banner grab are viewable in the HTML report.
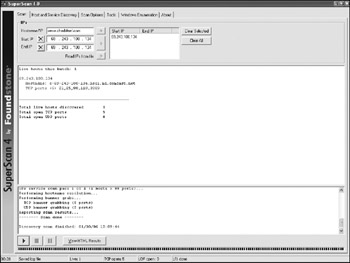
Figure 8-4: Port scan results -
Enumerate Windows information. Depending on the suspect system configuration, a NULL Session connection can return information on Windows NT/2000/XP/2003 systems. NULL Session refers to connecting to a remote system without authentication (the NULL part) using the higher-level protocols, Server Message Block (SMB)/NetBIOS. These connections allow an investigator to enumerate information on the remote system, including shared drives, MAC addresses, user accounts, current users, services, and other details. SuperScan provides a Windows Enumeration function in addition to the port scanning function. The results of a NULL Session enumeration are shown in Figure 8-5. Note the SharedDocs file share.
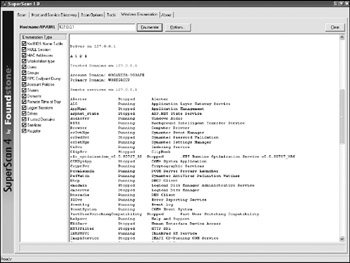
Figure 8-5: Windows Enumeration results
After the information has been completed, it can be used to further examine the system (for example, connecting to FTP and HTTP sites and mapping shared drives). The further examination will depend on the findings and may include finding owners of other system accounts that have privileges to perform the remote administration steps shown previously.
Port scanning, OS Detection, and Remote enumeration are fairly quick and will not generally alert the end user to any unusual activity. If these tasks are performed, make sure the originating IP address and system name are not readily associated with the investigation team. Calling the machine Network-Analysis and connecting from a visitor office works well. While no known convictions to date have been upheld for either port scanning or enumeration, they are bordering on trespassing for systems that the investigator does not own and are more appropriate for corporate investigations where the target PC is the property of the company.
| Warning | Host-based intrusion detection systems integrated into popular firewalls may generate an alert to the user if a port scan is performed against his or her machine. |
Monitoring
The second form of covert investigation is monitoring of user activities through the active recording of system activity. This can include monitoring of keystrokes, capturing network traffic, or interactively viewing system activity through screenshots or reports .
Monitoring can provide a broader, temporal view of user actions not available through snapshot-based activities like disk imaging and can be replayed to reconstruct specific user actions. Monitoring of computer activity by the provider of that service has generally been permitted and been exempt from one-or two-party consent laws on recordings, but the case law in this area is very fluid. The analyst must check the appropriate legal department before performing any active monitoring.
| Note | By placing an appropriate warning banner and requiring users to click an agreement on login, consent from one of the parties can be obtained when the system is started. Additionally, a good acceptable usage policy and user awareness training plan will alert users in a corporate environment that they can be monitored. Having them sign an agreement to this policy upon accepting employment is an additional plus. |
Covert cameras and keystroke recorders are both physical mechanisms for obtaining evidence. Covert cameras can be disguised as smoke detectors, clocks, and sprinkler heads to easily blend in to an office environment. Placed with a view of the computer screen and keyboard (sometimes difficult with viewing angles on laptops), these can provide direct evidence of activity. Details on covert camera selection and placement are beyond the scope of this book. Consult a physical security team for guidance on their use.
Keystroke Recording
Keystroke recorders can be either physical objects or software based. They are useful for finding passwords, retrieving the text of documents created, and logging Instant Messaging sessions, although only half of the conversation is logged. Physical recorders sit between the keyboard itself and the computer. They can take several forms:
-
Adapters. Keystroke recorders that look like AT-to-PS2 adapters or PS2-to-USB adapters sit right on the relevant port on the back of a system. They are the least likely connector to be noticed, especially on desktop systems.
-
Extension cables. Appearing to be an extension to the keyboard cable, these adapters can generally hold slightly more keystrokes (up to two million). Extension cablebased adapters are more likely to be spotted by wary users but can replace existing adapters.
-
Keyboard replacements . Full keyboard replacements resemble their respective manufacturer's models. These can replace the existing keyboard and show no external signs of logging hardware, but a ruse for putting in a replacement keyboard is necessary (generally damaging the existing keyboard and providing the logging keyboard as a replacement).
-
Altered keyboards. The most effective and least likely to generate suspicion, altering the existing keyboard is the best approach. An adapter or extension-based keyboard logger is placed within the keyboard itself by cutting the wire internally and attaching it to the logger at both ends.
Hardware keystroke logging has inherent limitations. There is a detectable piece of equipment that is used, although the likelihood varies and is very low for altered keyboards. Additionally, physical access to the system is required, and some systems cannot use hardware keystroke loggers (for example, laptops). Finally, hardware logging only shows what was typed, not where it was typed. If a mouse click is used to add addresses to an email, for example, this will not be part of the recording.
Software keystroke logging provides an alternative to hardware solutions and can be deployed locally or remotely using SMS, PSExec, or by tricking the user into running an executable. The software runs in the background and if all goes well, does not provide any indication to the suspect that it is running.
Keystroke logging software suffers from some of the same problems as hardware-based solutions in addition to having some problems of its own. Knowledgeable users may notice an additional service or process running, network traffic or disk traffic if the data is stored locally, and that software will not work outside of the environment in which it was installed (for example, on a dual-boot system). Finally, like hardware logging solutions, the basic software only logs what was actually typed on the keyboard.
More advanced software has become available for Windows-based active surveillance than basic keystroke logging. Advanced monitoring software, such as Spector Pro, can record application access, take screenshots of activity, and even send networked alerts based on keywords that are entered. The CNE version of Spector Pro is even network-compatible; content that would be stored on a local drive for later retrieval can now be accessed in real time from a networked PC. The downside is a slightly larger application footprint and possible suspicious network traffic generated, limiting the usefulness for investigating a network administrator or other professional that may be using sniffing software as part of his job. Figure 8-6 shows a screenshot of the keystroke capture capability in Spector Pro.
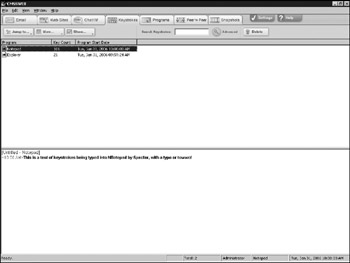
Figure 8-6: Spector Pro keystroke capture
Network Monitoring
Network-based monitoring of the activity on a suspect machine can be accomplished with a very low risk or discovery if performed properly. The monitoring of network activity can occur anywhere between the suspect machine and the target machine. Popular places to monitor include switching closets (if the suspect does not have access to the associated switches either physically or logically), local cables (for in-line taps) and firewalls or routers (for basic connection information).
Because it is a passive act, network monitoring is relatively safe. If proper precautions are taken, and unless the physical device is discovered or access to the network equipment is available, the monitoring can go unnoticed. Similarly, sniffing the network and performing packet captures is a common system administration task that in itself is not necessarily suspicious.
There are four primary methods for performing network monitoring, excluding IDS alerting based on specific activities:
-
In-Line Tap. An in-line tap (sometimes called a vampire tap) is used to sniff traffic directly from a specific cable. Fiber-based in-line taps clamp on to the cable with part of the sheathing removed and read a portion of the light transmitted through the exposed cable and amplify it. Copper-based in-line taps are more complex in operation (since the CAT5 Ethernet has two read and two write cables, requiring traffic to be put back together with a direct tap). As a result, most copper taps are now end taps. They plug in to the end of an Ethernet cable and provide full access to reconstructed traffic from both sides of the conversation. End tapbased fiber taps that regenerate the network traffic are also available.
| Note | A vampire tap more accurately refers to an older style of tap popular with Thicknet and Thinnet Ethernet that used coaxial cables. With these, an actual metal spike was inserted (like a vampire's fangs) through the sheathing of the cable to allow a conductor to be clamped to the inner, copper cable. In-line taps also encompass other products that do not alter the wire. |
-
Hub and sniffer cable. Unlike a switch, a hub repeats all traffic to every port. Because of this, connecting a hub in between the machine to be monitored and a switch allows for all traffic to be monitored with an inexpensive piece of hardware (4 port, 10/100 Ethernet hubs can be purchased for less than US$25 at the time of this writing) and a simple sniffer cable can be built inexpensively.
| Tip | When connecting the hub to a switch, remember to use a crossover cable unless an uplink port is available on one of the devices. |
-
Switch SPAN ports. Switch Port Analyzer (SPAN) ports receive all of the traffic generated on the other switch ports. Most corporate switching products from major vendors include the capability of defining one of the ports as a SPAN port. The sniffer box can then be plugged directly into this port and receive all of the traffic from the end station. To be effective, the traffic received by this port needs to be filtered to remove any information not sourced from or destined to the suspect machine. Many products additionally make the SPAN-defined port receive-only, reducing the risk of discovery.
| Tip | Some switches include a port-mirroring capability instead of (or in addition to) a SPAN port. Port mirroring replicates the traffic from a single port in the switch to another port in read-only mode. This is ideal for ensuring all traffic to and from a single port is analyzed without the need for extensive filtering. |
-
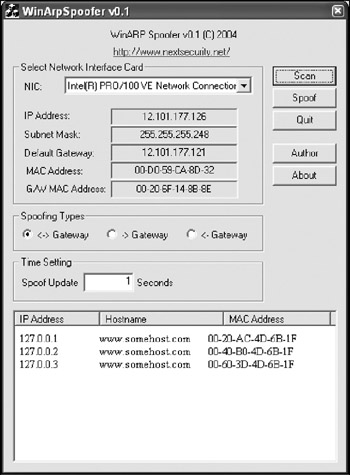
ARP spoofing. Address Resolution Protocol (ARP) is used to translate IP addresses to Ethernet MAC addresses. Since a Windows machine sends all of its non-local packets to a default gateway IP address, poisoning the ARP cache of the target machine to send all packets to the sniffer box (instead of the gateway) allows sniffing on a switched network. To be effective, the ARP cache on the target machine or a router in between needs to be spoofed and the sniffer box needs to forward IP packets to the real gateway. The primary tool for ARP spoofing is dsniff from Dug Song. A GUI-based Windows tool, Win ARP Spoofer, is also available from NextSecurity. Figure 8-7 shows a screenshot of Win ARP Spoofer. ARP spoofing is more difficult than the other techniques but has the advantage of not requiring direct access to the suspect's cable or the switch itself.
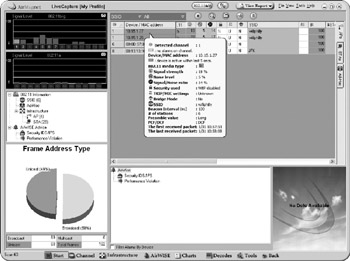
Figure 8-7: Win ARP spoof software
For all of the methods, an Ethernet card capable of operating in promiscuous mode (almost all available cards should be able to) is a requirement for monitoring. Generally, an Ethernet card only receives traffic that is associated with its own Media Access Control (MAC) address, a unique identifier hardcoded into every card, and broadcast traffic. By placing an Ethernet card in promiscuous mode, the card received all network traffic and passes it up the stack.
There are two primary forms of monitoring: full-packet capture and header capture. Full-packet capture stores the entire contents of all packets traversing a given segment. Both the header portion of the packet and the associated data are collected. The advantage of full-packet capture is the ability to fully reconstruct and recover the content from all unencrypted communications. The disadvantage is the amount of space required; full-packet capture requires an amount of space proportional to the bandwidth used. For a 100 Mb/s connection that is fully utilized, this can amount to tens of gigabytes of uncompressed data per hour , which will quickly fill even large disk drives, although most connections will not utilize anywhere close to the full bandwidth for a sustained period.
Header capture stores only the header information, not the contents. This is the electronic equivalent of a pen-register. It enables the investigator to determine the source, destination, and duration of all communications between the suspect machine and other machines. Although it is not as thorough as a fullpacket capture, a header capture requires significantly less disk space and can be parsed fairly quickly.
| |
Sniffing a wireless network connection can be difficult, especially on Windows devices. The reason for the difficulty lies in the availability of drives that support the wireless cousin to promiscuous mode: RFMON. RFMON is widely supported on a few chipsets in the Linux environment where custom drivers have been written and made available as open source, but it is difficult to find similar drivers in the Windows world. Because of this many popular sniffing utilities such as Kismet and Wellenreiter are unavailable or crippled on the Windows platform. In general, the chipsets used by the ORiNOCO Gold cards from Proxim and the Cisco Aironet cards have been the most widely supported on Linux, but others are now available.
Due to a lack of available drivers, common sniffing tools such as Ethereal and TCPDump are not effective on Windows. They still function, but because the driver does not provide any network data other than broadcasts and directed traffic to the programs, sniffing the network itself is not truly occurring.
Commercial wireless sniffers that mimic the features of their wired counterparts and expand upon them are available, notably from Network Associates (with Sniffer Wireless) and AirMagnet. These sniffers provide fullpacket monitoring capabilities on a limited number of wireless cards through custom drivers distributed with the software itself. The following figure shows the AirMagnet interface for deep packet inspection.
AirMagnet sniffer interface
In addition to network sniffing, an investigator may be required to find a wireless access point or card. Both the Sniffer and AirMagnet products provide this functionality as well using a direction antennae and signal strength readings (AirMagnet provides a triangulation capability as well with the right setup). By pointing the directional antenna and watching the signal strength, the relative position and distance of the device can be determined. See http://www.turnpoint.net/wireless/cantennahowto.html for instructions on how to build a homebrew directional antenna. I have had better experience with my own antenna built from these specifications and a coffee can than with either my commercial antenna or a Pringles cantenna.
One common misconception is that NetStumbler can provide the same functionality as the previously mentioned tools in tracking down wireless violators. In reality, NetStumbler is an excellent survey tool for finding access points that broadcast their SSID, but it is not a passive monitoring tool. NetStumbler and similar products broadcast request packets and read the responses. They do not sniff frames not directed toward the machine performing the monitoring (which is not possible without RFMON driver support), and they reveal their presence with broadcast packets (which AirMagnet will actually pick up as an alert).
With the widespread availability of open access points, tracking down a wireless user and monitoring wireless traffic will become more frequent occurrences for the IT investigator.
| |
| Tip | Apply a filter to only capture packets sent to and from the suspect machine when connecting to a hub shared by other machines. If it is suspected that the machine is spoofing both the IP and MAC address of packets, all packets may need to be collected or a switch inserted into the monitoring path to collect all relevant information. |
Sniffer software varies in price and quality. At the low end are free and easy-to-use tools like Windows Network Monitor. On the high end are commercial products such as the Network General Sniffer line of software. Since many of the protocol analysis features present in the higher-end tools are geared toward network troubleshooting (as opposed to computer investigations), a freeware tool Ethereal covers the bases for security monitoring needs while providing advanced functionality where it is necessary.
| Note | Formerly known as Network Associates Sniffer, the Network General spinoff is one of the more fully functional and well-known sniffing packages. |
To perform a basic capture with Ethereal, start the executable and choose Capture Start from the menu. The standard options should be sufficient for a basic capture. Make sure that all of the Name Resolution options are checked. These resolve the computer name based on the MAC as well as higher network protocol name resolution options. As the IP addresses of machines may change from the time of the capture, MAC address and computer name may be of later value. Click OK to begin the capture.
Ethereal captures all packets with full packet payloads by default. If an investigation is targeting a specific machine (for example, a warrant is issued to track only traffic to and from a specific device), a capture filter can be used to reduce the storage space required. Alternatively, all information can be captured and the filter applied later. This has the advantage of a lower likelihood of missing data but the disadvantage of requiring potentially large amounts of storage space. Likewise, capture filters can be used to return only certain types of traffic (for example, all HTTP requests ), allowing for even more granular targeting of data collection.
To capture just headers, Ethereal allows the user to set the maximum size captured for each packet. The default size of 68 bytes is generally sufficient to capture the link layer and TCP/IP headers but not the headers for higher-level protocols such as HTTP headers.
When a target group of packets is identified within Ethereal, the product has the ability to follow the packet stream and decode the results as a whole. Figure 8-8 shows a decoded FTP data stream and the associated user name and password, as well as the commands typed. This was obtained by selecting one of the FTP packets, right-clicking, and selecting Follow TCP Stream. Unless data has been encrypted (for example, using SSL), it can be decoded in the network capture. If it is encrypted properly, one of the local capture techniques mentioned will need to be used on the source or destination machines to get the raw data.
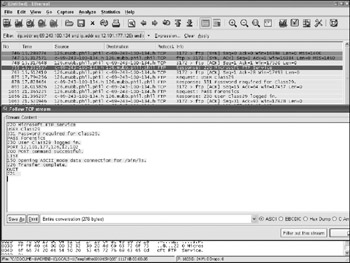
Figure 8-8: FTP packet capture
| Note | The data packets are sent separately in an FTP connection and are listed as TCP packets with the first part of the Info field containing the word ftp-data in Ethereal. These can also be decoded to recover transmitted files and directory listings. FTP sends all credentials in plain text unless SFTP or other software is used. Do not bother trying the password in the example it has long since been changed. |
| |
Obtaining raw network output from a sniffer can show connection histories, support text searching, and enable protocol-level analysis. Frequently, an IT investigator wants to see the specifics of what was transferred in a given connection graphically. This can include detailed data on file or terminal sessions, the reconstruction of images or files that were transmitted, and details on web activity. This information can be obtained from an Ethereal sniffer log (or any log in libpcap format) using a Perl program called ChaosReader.
ChaosReader takes a raw log output file and parses it for specific TCP streams. These streams are then reconstructed into their individual components and indexed as an HTML file. The use of ChaosReader is simple. First, obtain a valid sniffer log. This can be an existing log or Ethereal, TCPDump, and other sniffers can be used to save the output to a file-based format. Next, the output file is copied to an examination directory where the ChaosReader-created files will be located. Finally, ChaosReader is run on the sniffer log and the output generated:
C:\Tools>Chaosreader.pl sniffer.out
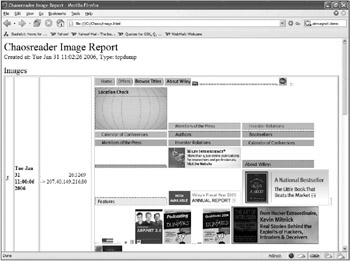
After ChaosReader completes, the http://www.index.html file can be opened with a web browser. This file contains links to individual communications, as well as reports on web usage and file/image activity. The individual links can be followed to see reconstructed session data in a visual manner. The following figure shows an image results page from a sample capture. The individual web page and associated images viewed are clearly visible in the output.
Web browsing session output
| |
| |
A sniffer cable provides a stealthier way of network monitoring. Because a proper sniffer cable does not have transmit lines from the monitoring box, inappropriate traffic (for example, DHCP packets and ARP packets) will not inadvertently give the monitoring box away if the suspect happens to be running sniffing software himself. Simple sniffer cables are inexpensive to construct and do not require anything more than a single CAT5 Ethernet cable, a wire stripper, and a pair of wire connectors.
While easy to make, building a sniffer cable is not as simple as just cutting the transmit wires from an Ethernet cable. If the transmit wires are cut, the hub the machine connects to will not sense any signal and will assume the port is off, thereby sending no traffic to that port. To remedy that, the network cable design that follows transmits back an inverted version of the signals generated from the hub itself or other machines connected to its ports. Inverted signals are a better solution than raw signals. They avoid the possibility of legitimate , duplicate traffic appearing on the device that keeps the signal alive .
The sniffer cable can be constructed as follows:
-
Obtain a standard UTP CAT5 cable of three to five feet in length. (For best results, purchase a CAT5e or CAT6 cable in an obscure color to prevent confusing the cable with others.)
-
Remove approximately eight centimeters of the outer sheathing in the center of the cable.
-
Clip the orange, orange-stripe, green, and green-stripe wires.
-
Choose one end of the cable as the end to be connected to the sniffer box. Clip one side of the orange and orange-stripe (transmit) wires to the edge of the sheathing. Label the clipped end with a Sharpie or similar pen as the end for the sniffer itself.
-
Strip approximately one centimeter of the inner sheathing from each remaining side of the green, green-stripe, orange, and orange-stripe wires.
-
Twist together both green wire ends and the remaining orange stripe wire end in one wire cap or solder all three together and cover with electrical tape.
-
Twist together both green-stripe wire ends and the remaining orange wire end in a second wire cap or solder all three together and cover with electrical tape.
-
Using electrical tape, secure the uncovered wires (the area missing the outer sheathing).
To test the cable, plug the sniffer box into the hub using the cable. Plug a second machine (simulating a suspect machine) into the hub. Running ethereal on the suspect machine, no traffic generated from the sniffer box should be viewable.
The following figure shows a diagram of the connections for the sniffer cable.
| Sniffer Box | Hub | |||
|---|---|---|---|---|
| 1 | TX+ | Orange Stripe | TX+ | 1 |
| 2 | TX ˆ | Orange | TX ˆ | 2 |
| 3 | RX+ | Green Stripe | RX+ | 3 |
| 4 | Unused | Blue | Unused | 4 |
| 5 | Unused | Blue Stripe | Unused | 5 |
| 6 | RX ˆ | Green | RX ˆ | 6 |
| 7 | Unused | Brown Stripe | Unused | 7 |
| 8 | Unused | Brown | Unused | 8 |
| Sniffer cable layout | ||||
| |
| | ||
| | ||
| | ||
EAN: 2147483647
Pages: 71
- Context Management of ERP Processes in Virtual Communities
- Distributed Data Warehouse for Geo-spatial Services
- Healthcare Information: From Administrative to Practice Databases
- A Hybrid Clustering Technique to Improve Patient Data Quality
- Development of Interactive Web Sites to Enhance Police/Community Relations