Working with the Gantt Chart View
| < Day Day Up > |
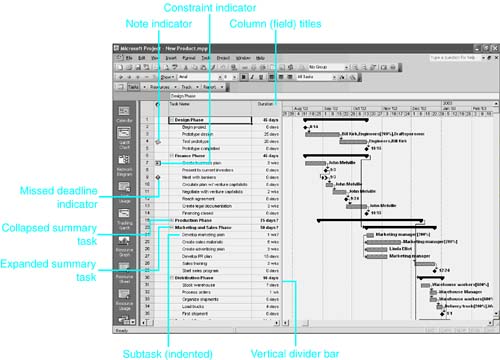
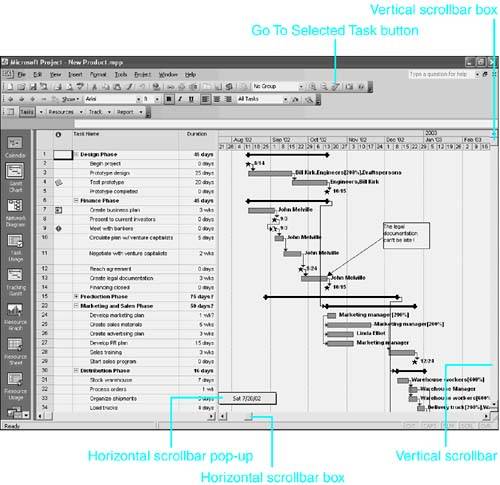
| The previous chapters in this book discuss creating projects and establishing a task list. Most of these discussions are centered on the Gantt Chart view, which is probably the most widely used view in Microsoft Office Project. This chapter is devoted to expanding your knowledge of the Gantt Chart view (and several other views) to effectively work with a project schedule. You'll find a number of cross-references in this chapter, pointing you to other sections of the book that provide more detailed information on scheduling and customizing the views. One of the reasons the Gantt Chart view is so widely used is the array of information that is readily available in this view. The Gantt Chart view is divided into two components : the task table and the timescale . The task table is similar to a spreadsheet. It displays task data in columns and rows. The default table is the Entry table, although other tables are available for you to view. Components of the Task TableAs you can see in Figure 7.1, each row in the task table represents a separate task. Each column in the table displays some information about that task. The columns are fields in the project database. Typically you enter new tasks and their durations. Then, based on the project start date and the links between the various tasks , Project calculates the start and finish dates for that task. Figure 7.1. The Gantt Chart view is comprised of the task table and the timescale. Outlined Task ListsAs you build a project schedule, you typically have phases and specific tasks underneath each phase. These phases, or main tasks, are called summary tasks and are displayed in bold in the task table. Project indents the specific tasks, called subtasks , under the summary tasks. Any task that has subtasks displays an outline symbol in front of the task name . Collapsed summary tasks display a plus (+) sign; expanded summary tasks display a minus () sign (refer to Figure 7.1).
Task Indicators
In addition, there are other types of indicators that you might encounter. For instance, some indicators alert you when a task is complete, when the task has slipped past its assigned deadline, or when the task has been assigned to a resource but the resource has not yet confirmed the assignment. Moving Around in the Task TableAs you enter tasks and work with a task list, it is useful to understand how to move from row to row and column to column. Likewise, in a large project, it is helpful to be able to locate tasks quickly. You can move around the task table by using some of the keyboard movement keys:
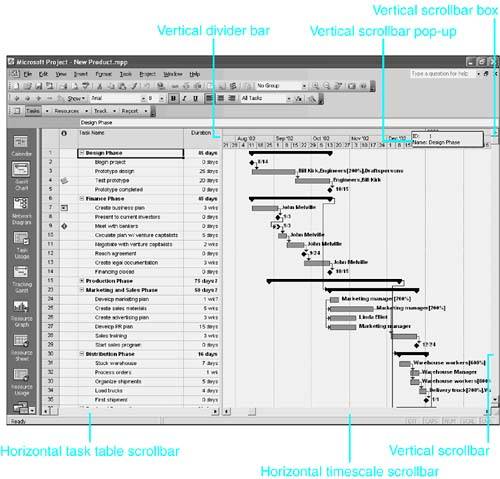
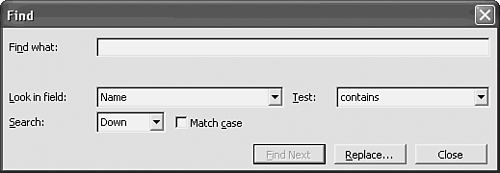
Other techniques for moving around include scrolling and using the Edit, Find command. These techniques are described in the next two sections. Scrolling in the Task TableThe Gantt Chart view has three scrollbars : A vertical scrollbar on the far right of the view changes which tasks are shown onscreen, a horizontal scrollbar at the bottom of the task table changes which table columns are visible, and a second horizontal scrollbar at the bottom of the timescale moves the bar display along in time. When you drag the vertical scrollbar box, a pop-up appears to indicate what task will be listed at the top of the view when you release the mouse (see Figure 7.2). Figure 7.2. You can drag the scrollbar box to quickly move down or up the task list. The task table is composed of a series of columns, or fields . Initially, just a few columns are visible when you display the Gantt Chart view: ID, Indicators, Task Name, and Duration. However, several other columns are hidden underneath the timescale. There are three ways to see the data in these columns: You can use the horizontal task table scrollbar, move the vertical divider bar out of the way, or use the Home, End command and arrow keys to scroll in the table columns. When you drag the horizontal scrollbar in the task table, it does not display a pop-up or even move the display. You have to guess when to release the mouse. As a result, it can be a little tricky to figure out just how far to scroll to see additional columns. Clicking the arrows on the scrollbar gives you more control. Using Find to Locate TasksWhen you have a long list of tasks and you want to search for all the tasks that contain a specific word or numbers in a task field, you can use the Find command. To find a task by searching for one or more words in the task name, follow these steps:
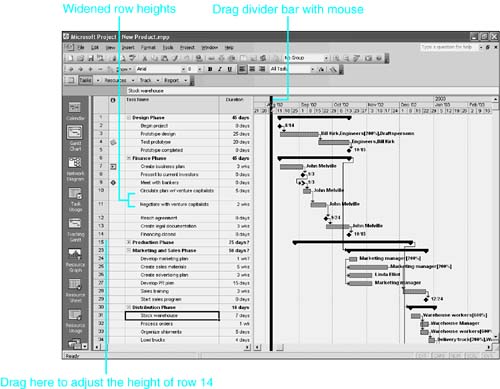
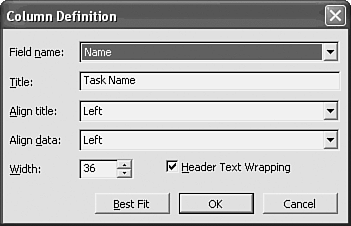
You might have to move the dialog box to see the selected task. After you have located the task(s) you are looking for, click the Close button to close the Find dialog box. TIP If you've closed the dialog box, you can use your last Find criteria again by pressing Shift+F4 to continue searching through the task list in the same direction, or you can press Ctrl+Shift+F4 to search the task list in the opposite direction. Altering the Task Table DisplayAs you work with projects in the Gantt Chart view, there will be times when you want to change the display of the task table to show more data or change the appearance of the data. One of the changes you might want to make is to the font and font attributes of the tasks. For example, although the default settings have summary tasks in bold, you can customize the appearance to display in other colors, in italic, or in a different font. If you want to apply an entirely different table, you can choose a table by using the View, Table command. Other display changes you might want to make include showing more of the built-in columns in the task table, adjusting the height of individual rows, using the rollup task feature, altering the date format, and inserting new columns in the task table. These display options are illustrated in the next few sections. Viewing More Columns in the TableWhen you want to see more of the task table columns that are hidden beneath the timescale, you have to move the vertical divider bar. When positioned over the vertical divider bar, the mouse pointer changes to the shape of two vertical parallel lines with arrows pointing left and right. Hold the mouse button down and drag it to the desired position. A thick gray line appears, indicating the bar's position (as shown in Figure 7.4). Figure 7.4. You can drag the vertical divider bar to adjust the view of the task table columns. NOTE If you position the vertical divider bar in the middle of a column, double-click to move it to the closest border of the column. NOTE You can adjust the widths of columns displayed in the task table. Position the mouse pointer on the right-column border, up next to the column name. The mouse pointer changes to a single vertical line with arrows pointing left and right. Click and drag it to make the column width wider or more narrow, or double-click to cause the column to adjust to the longest entry. You can adjust the positions of individual columns displayed in the task table by simply highlighting and clicking and dragging the column to a new position. Adjusting Row HeightYou can adjust the height of each row independently. Position the mouse pointer on the bottom row border, beneath the row number. The mouse pointer changes to a plus sign with arrows pointing up and down. Click and drag to make the row height deeper or more shallow . Figure 7.4 shows a few rows that have been adjusted; the text automatically word-wraps in the cell to fit the new height. Inserting and Changing Columns in the Task TableSometimes, you might want to change the column titles to match some more common names used within your organization, or you might want to change which field is displayed in a column. For example, you could change the title of the Task Name column to What Has to Be Done. To modify a column, simply double-click its column title, and Project displays the Column Definition dialog box (see Figure 7.5). The following list describes the options in the Column Definition dialog box:
Figure 7.5. You access the Column Definition dialog box by double-clicking the column title in the task table. Instead of changing the contents and layout of a displayed column, you might want to add or remove table columns. There are two methods for showing and hiding columns:
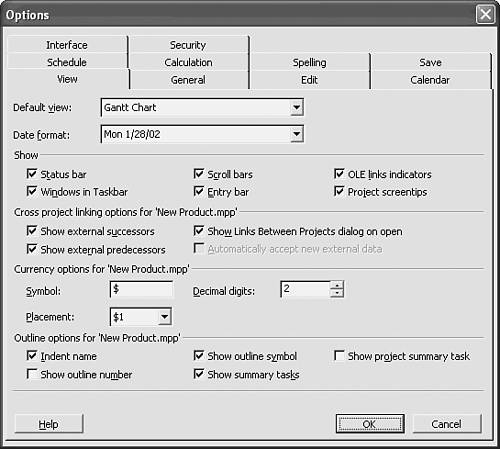
NOTE Double-clicking on a column title edge applies best-fit width formatting to the column. NOTE It's important to note that hiding or deleting a column from view does not delete the data stored in the cells of that column. The contents are still stored in the database and will be visible when the hidden column is reinserted into any table. You cannot mix and match the two techniques for adding and hiding columns. Columns hidden by choosing Hide Column can't be reopened via the mouse dragging method. If you use the methods described here to delete (or hide) and insert columns in the task table, you are in fact customizing the table for the active project. When a modified table is applied to any other view, the revised layout, not the original table, is displayed. Changing the Date FormatThe default date display format uses the mm/dd/yy pattern. This is the format that you see in the Start and Finish columns of the task table. You can add the time of day to the display, or you can switch to any one of a number of data format options. Be aware, however, that changes you make to the date format affect the date display in all your project filesnot just the active project. You can change the date display at any time. To change the date display format, follow these steps:
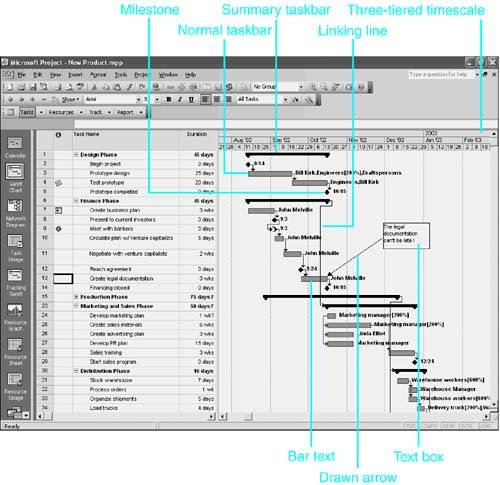
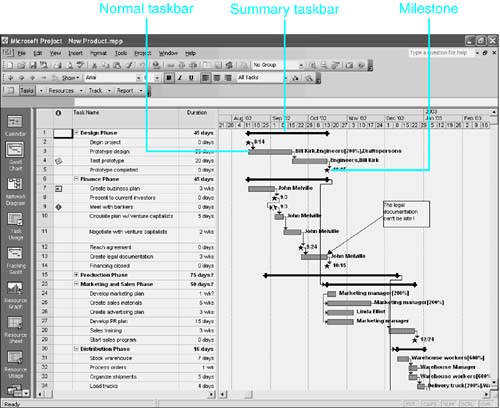
Depending on the date format you select, you might see a series of # symbols displayed in the cells in the Start and Finish columns. This indicates that you need to widen the column to display the date in the new format. NOTE If you want to use an international date or time format, you must set this through the Regional Settings applet in the Microsoft Windows Control Panel. Components of the TimescaleThe timescale is the graphic portion on the right side of the Gantt Chart view. The timescale displays several items: a time line, taskbars, bar text, and linking lines. These items are identified in Figure 7.7. Figure 7.7. The timescale is the right portion of the Gantt Chart view. In addition, you can add graphic drawing objects to the timescale, such as text boxes and arrows. Placing graphic objects on the timescale is discussed later in this chapter. TaskbarsThere are three types of taskbars in Project : Summary, Normal, and Milestone. The default display of these bars is shown in Figure 7.7. However, by using the Gantt Chart Wizard, you can significantly alter the display of the taskbars, as shown in Figure 7.8. Figure 7.8. You can significantly alter the display of the timescale by using a number of tools, the easiest of which is the Gantt Chart Wizard.
Bar TextThe default settings for the taskbars display the name of the resource at the end of Normal tasks and the start date next to Milestones. You can designate the data and placement that appear with a taskbar in the Bar Styles dialog box. Choose Format, Bar Styles, and select the bar type at the top of the dialog box. Two tabs at the bottom of the dialog box display the Text and Bars settings for the selected bar type. Linking LinesThe lines that connect the taskbars represent links between tasks, and they define the order in which the tasks must be done. The position of a linking line indicates the type of link. If the linking line extends from the end of one task to the beginning of another, there is a Finish-to-Start link between the tasks. There are four different link types. In addition, you can build in lead time and lag time between linked tasks.
CAUTION Linking lines may sometimes be drawn on top of each other, making it difficult to tell which tasks they are connecting. Also, two similar, but different, relationships can result in identical linking lines being drawn. You can verify the link types by reviewing the Predecessors column on the Entry table or the Predecessors tab in the Task Information dialog box. Moving Around in the TimescaleAfter you have created a project schedule, it is useful to understand how to quickly move around the timescale. This is especially true when you have a large, extensive project. With a few keystrokes or mouse clicks, you can move from the beginning to the end of the timescale, move incrementally through the timescale, or scroll to a specific task. The following are some of the techniques you can use:
CAUTION Pressing Alt+up-arrow key or Alt+down-arrow key might appear to have no effect. These combinations do not scroll the timescale horizontally, but they do have effects on the table. If the active cell is in a date column, pressing Alt+up-arrow key or Alt+down-arrow key displays a calendar object in the cell and scrolls through the calendar, selecting a different date for the cell unless you press Esc to turn off the object. Similarly, if the active cell is in the Duration column, pressing Alt+up-arrow key or Alt+down-arrow key activates the spinner in the cell, and a new duration value is chosen unless you press Esc to leave the cell-edit mode. Scrolling in the TimescaleThe timescale uses two scrollbars : the vertical scrollbar on the far right of the view and a horizontal scrollbar at the bottom of the timescale portion of the Gantt Chart view. The vertical scrollbar is used primarily to scroll through the task list. As discussed earlier in the chapter, the horizontal scrollbar at the bottom of the table changes which columns are visible. However, when you drag the horizontal scrollbar in the timescale, it displays a pop-up to indicate the date you will be scrolling to when you release the mouse button (see Figure 7.9). Figure 7.9. You can drag the horizontal scrollbar box on the timescale to quickly move to a specific date. Locating a Taskbar or Specific Date in the Gantt ChartOften when you are working in the Gantt Chart view, you have a task selected but the corresponding taskbar is not visible on the screen. This is especially true when you zoom in to see minutes, hours, or days in the timescale.
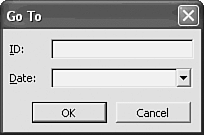
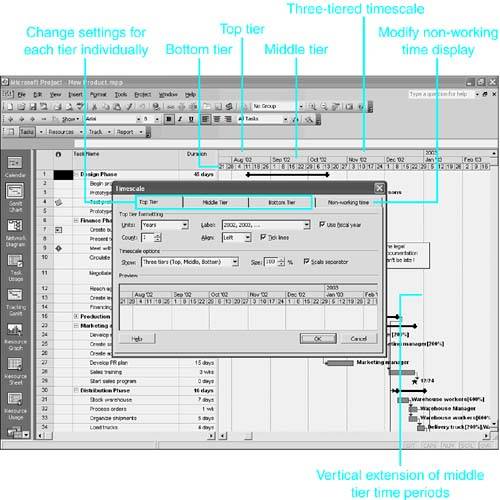
You can also use the Edit, Go To command (or press Ctrl+G) to display the Go To dialog box (see Figure 7.10) if you want to jump to a specific date in the timescale. You can enter a date in the Date box or click the drop-down calendar object to select a date. Figure 7.10. You can type in a task ID to go to a specific task. NOTE You can use today or tomorrow in the Date box to jump to the corresponding dates. Altering the Timescale DisplayThe timescale in the right side of the Gantt Chart view is made up of the rows at the top of the view. A maximum of three rows, or tiers , can be displayed: a top tier, middle tier, and bottom tier. At least one tier must be visible onscreen at any time. Gray dotted lines extend down the screen to mark the division between units on the middle tier only, if the tier is turned on. You can customize the amount of time encompassed by the units on each of the scales and you can change the labels that appear in the units.
Another way to adjust the timescale is to choose Format, Timescale to access the Timescale dialog box (shown in Figure 7.11). You use the Timescale tab to establish the settings for each of the three tiers. You use the Non-working Time tab to set the display options for non-working days, such as weekends. Figure 7.11. Individual adjustments to the timescale can be set by using the Timescale dialog box. Viewing More Task DetailsAlthough the Gantt Chart view contains a lot of information, you can see even more details about individual tasks either with the Task Information dialog box or by splitting the screen and viewing the Task Form view. Using the Task Information Dialog Box
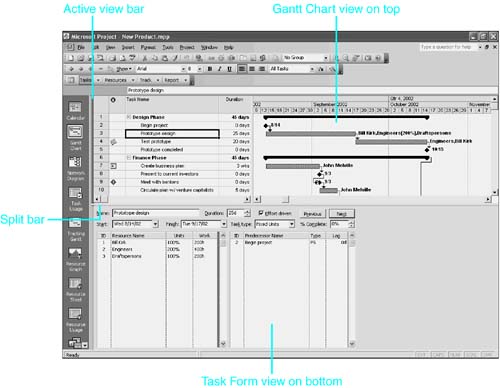
Using Combination ViewsOne of the most useful and powerful display techniques that Microsoft Project provides is the capability to split the screen in half (top and bottom) to see two different views of the project simultaneously . Choose Window, Split to create a combination view screen (see Figure 7.12). Figure 7.12. You can remove the bottom pane from a combination view by choosing Window, Remove Split. The window splits into two panes : The top pane shows the view you were working in before splitting the screen, and the bottom pane shows either the Task Form view (if you started with a task view) or the Resource Form view (if you started with a resource view). Figure 7.12 shows the Gantt Chart view in the top pane and the Task Form view in the bottom pane. Task 3, "Prototype Design," is selected in the top pane in Figure 7.12. The bottom pane shows detailed information about Task 3. The bottom pane displays all the fields that are in the columns in the Gantt Chart view, including the ones that are hidden beneath the standard timescale. This screen arrangement enables you to see the values in those fields, eliminating the need to display a large number of columns in the task table. With a split screen, you can see how the task fits into the overall scheme of things in the top pane, and view many significant details in the bottom pane. You can enter task information in either pane, but you must activate the pane before you can use it. To activate the bottom pane, simply click anywhere in the bottom pane. You can also use the F6 function key to toggle back and forth between panes. The pane that is active displays a dark blue color on its half of the Active View bar (refer to Figure 7.12). The two minitables at the bottom of the Task Form view initially display resource and predecessor details. You can select different details to display in these areas. First, activate the bottom pane. Then choose Format, Details. A submenu appears, with alternative data you can display. |
| < Day Day Up > |
EAN: 2147483647
Pages: 283
 For a complete discussion of the task tables,