Using VBA to Apply Chart Formatting
A common type of chart macro applies formatting to one or more charts. For example, you may create a macro that applies consistent formatting to all charts on a worksheet. If you experiment with the macro recorder, you'll find that commands in the following Ribbon groups are recorded:
-
Chart Tools
 Design
  Chart Layouts
 -
Chart Tools
 Design
  Chart Styles
 -
Chart Tools
 Layout
  Labels
 -
Chart Tools
 Layout
  Axes
Axes -
Chart Tools
 Layout
  Background
Unfortunately, formatting any individual chart element (for example, changing the color of a chart series) is not recorded by the macro recorder. Therefore, you'll need to figure out the objects and properties on your own.
Formatting a chart
I used output from the macro recorder as the basis for the FormatChart procedure shown here, which converts the active chart to a clustered column chart (using Chart Tools ![]() Design
Design ![]() Type
Type ![]() Change Chart Type), applies a particular layout (using Chart Tools
Change Chart Type), applies a particular layout (using Chart Tools ![]() Design
Design ![]() Chart Layouts), applies a chart style (using Chart Tools
Chart Layouts), applies a chart style (using Chart Tools ![]() Design
Design ![]() Chart Styles), and removes the gridlines (using Chart Tools
Chart Styles), and removes the gridlines (using Chart Tools ![]() Layout
Layout ![]() Axes
Axes ![]() Gridlines):
Gridlines):
Sub FormatChart() If ActiveChart Is Nothing Then Exit Sub With ActiveChart .ChartType = xlColumnClustered .ApplyLayout 10 .ChartStyle = 30 .SetElement msoElementPrimaryValueGridLinesNone .ClearToMatchStyle End With End Sub
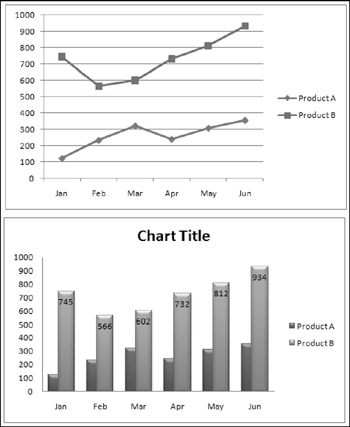
Figure 18-6 shows a chart before and after executing the FormatChart macro.

Figure 18-6: A chart, before and after being formatted.
| Note | Keep in mind that, after executing this macro, the actual appearance of the chart depends on the document theme that's in effect. |
| CD-ROM | A workbook with this example is available on the companion CD-ROM as a file named |
In the FormatChart procedure:
-
The ChartType property is straightforward enough, and VBA provides constants for the various chart types.
-
The ApplyLayout method uses a number to represent the layout, and the numbers vary with the chart type. These numbers appear as ToolTips when you hover the mouse over an icon in the Chart Tools
 Design
  Chart Layouts gallery. The ApplyLayout method can also specify a chart type as its second argument. Therefore, I could have eliminated the statement that changes the ChartType property and used this statement:
 .ApplyLayout 10, xlColumnClustered
-
The ChartStyle property also uses a nondescriptive number (from 1 to 48) for its argument. These numbers appear as ToolTips when you hover the mouse over an icon in the Chart Tools
 Design
  Chart Styles gallery.
 -
The SetElement method controls the visibility of just about every aspect of the chart. It accepts more than 120 descriptive constants. For example, the constant msoElementChartTitleNone hides the chart's title.
-
The ClearToMatchStyle method clears all user -applied formatting in the chart. This method is usually used in conjunction with the ChartStyle property to ensure that the applied style does not contain any formatting that's not part of the style.
More chart formatting examples
As I noted earlier, the macro recorder in Excel 2007 ignores many formatting commands when working with a chart. This deficiency is especially irksome if you're trying to figure out how to apply some of the new formatting options such as shadows, beveling, and gradient fills.
In this section, I provide some examples of chart formatting. I certainly don't cover all of the options, but it should be sufficient to help you get started so you can explore these features on your own. These examples assume an object variable named MyChart , created as follows :
Dim MyChart As Chart Set MyChart = ActiveSheet.ChartObjects(1).Chart
If you apply these examples to your own charts, you need to make the necessary modifications so MyChart points to the correct Chart object.
| Tip | To delete all user-applied (or VBA-applied) formatting from a chart, use the ClearToMatchStyle method of the Chart object. For example: MyChart.ClearToMatchStyle |
ADDING A SHADOW
One of the most interesting formatting effects in Excel 2007 is shadows. A shadow can give a chart a three-dimensional look and make it appear as if it's floating above your worksheet.
The following statement adds a default shadow to the chart area of the chart:
MyChart.ChartArea.Format.Shadow.Visible = msoTrue
In this statement, the Format property returns a ChartFormat object, and the Shadow property returns a ShadowFormat object. Therefore, this statement sets the Visible property of the ShadowFormat object, which is contained in the ChartFormat object, which is contained in the ChartArea object, which is contained in the Chart object.
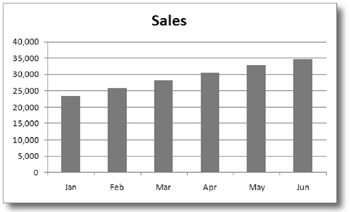
Not surprisingly, the ShadowFormat object has some properties that determine the appearance of the shadow. Here's an example of setting five properties of the ShadowFormat object, contained in a ChartArea object, and Figure 18-7 shows the effect:

Figure 18-7: Applying a shadow to a chart.
With MyChart.ChartArea.Format.Shadow .Visible = msoTrue .Blur = 10 .Transparency = 0.4 .OffsetX = 6 .OffsetY = 6 End With
The example that follows adds a subtle shadow to the plot area of the chart:
With MyChart.PlotArea.Format.Shadow .Visible = msoTrue .Blur = 3 .Transparency = 0.6 .OffsetX = 1 .OffsetY = 1 End With
If an object has no fill, applying a shadow to the object has no visible effect. For example, a chart's title usually has a transparent background (no fill color). To apply a shadow to an object that has no fill, you must first add a fill color. This example applies a white fill to the chart's title and then adds a shadow:
MyChart.ChartTitle.Format.Fill.BackColor.RGB = RGB(255, 255, 255) With MyChart.ChartTitle.Format.Shadow .Visible = msoTrue .Blur = 3 .Transparency = 0.3 .OffsetX = 2 .OffsetY = 2 End With
ADDING A BEVEL
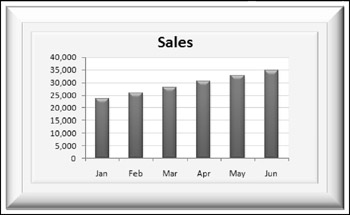
Adding a bevel to a chart can provide an interesting 3-D effect. Figure 18-8 shows a chart with a beveled chart area. To add the bevel, I used the ThreeD property to access the ThreeDFormat object. The code that added the bevel effect is:

Figure 18-8: This chart has a bevel effect.
With MyChart.ChartArea.Format.ThreeD .Visible = msoTrue .BevelTopType = msoBevelDivot .BevelTopDepth = 12 .BevelTopInset = 32 End With
| CROSS-REFERENCE | Chapter 30 contains some additional charting examples that deal with color. |
EAN: 2147483647
Pages: 319