| Quicken provides many options for customizing reports. You can change the appearance of a report, weed out information that you don't want to see, add criteria that you do want to see, specify dates or time frames, or specify the category groups you want to include or not include. Remember that categories are the groups that you assign to a transaction when you enter it in your register, and they are used for tracking and reporting on those categories. Your options for customizing a report vary, depending on which report you are customizing. You can customize a report from the Reports & Graphs window before you view the report or after the report opens, you can customize it from there as well. This task customizes the a Cash Flow report after it has been opened. See Also See "Viewing Reports" on page 310 to learn how to run reports. |
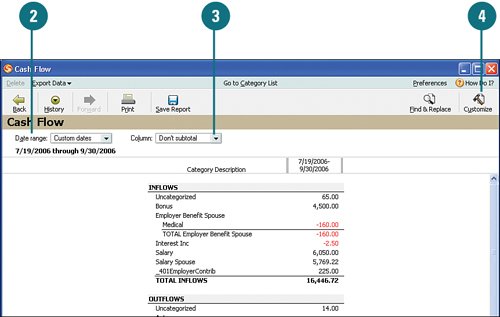
Set Display Options  Open a report, if you don't already have one open. Open a report, if you don't already have one open.
 To view a different time period, click the Date Range drop-down list and make a selection. To view a different time period, click the Date Range drop-down list and make a selection.
 Click the Column drop-down list to change the columns you want to see for the report. Click the Column drop-down list to change the columns you want to see for the report.
 To customize the report options, click Customize. To customize the report options, click Customize.
  To change the standard time period for this report, from Date Range, select the time period that you want to use. To change the standard time period for this report, from Date Range, select the time period that you want to use.
 On the Display tab, you can change the title of the report to be more descriptive. On the Display tab, you can change the title of the report to be more descriptive.
 Set row and column headings by making selections from the drop-down menus. Set row and column headings by making selections from the drop-down menus.
 Arrange content using the options in the Organization drop-down list. Arrange content using the options in the Organization drop-down list.
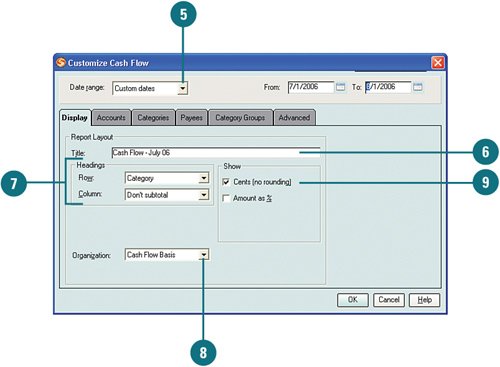  Select whether you want to see cents or percentages. Select whether you want to see cents or percentages.
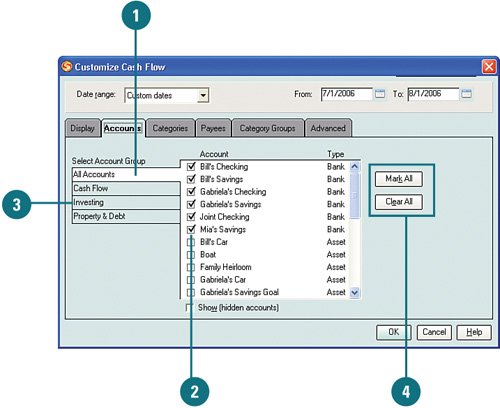
Set Account Options - On the Accounts tab, click the account group you want to include in the report.
- Select the accounts that you want to include in the report or graph. To remove an account, clear the box next to the account name by clicking the check mark.
- To include accounts from other account groups, click another account group and select the account(s) that you want.
- To select all accounts in an account group, click Mark All or click Clear All to remove all selected accounts.
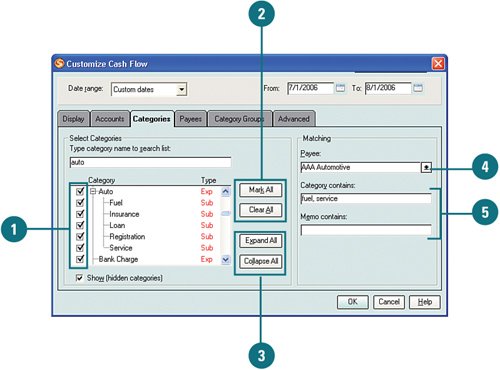
Set Category Options - On the Categories tab, select the categories that you want to include in the report or graph or clear those that you do not want to include.
- Select all categories by clicking Mark All or clear all categories by clicking Clear All.
- Click the Expand All button to see all subcategories or to view only the top categories, click Collapse All. You can then make your selection.
TIMESAVER Quickly find the categories that you want to include in the report or graph. Rather than scrolling through the category list to find the category you want to include in the report, you can search for the category and ensure hidden categories are shown. First, select the Show (Hidden Categories) check box. Then click in the box underneath the Type Category Name to Search List and type the name or partial name of the category that you are looking for. Quicken locates or finds the closest match to the one you are looking for in the category list. To include transactions that are not assigned to a specific category, from the top of the category list, select Not Categorized.
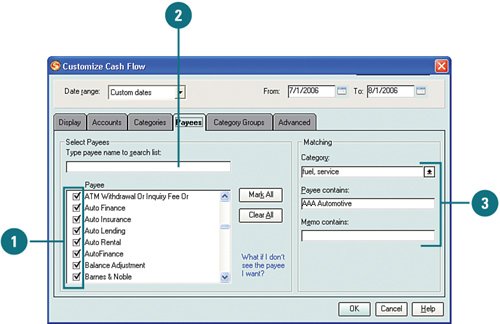
- From the Payee drop-down menu, you can select a specific payee so that the report includes only transactions and categories assigned to that payee.
- Use the Category Contains and Memo Contains areas to enter specific category and transaction information that you want to see for that payee.
Set Payee Options - On the Payees tab, select the payees that you want to see in the report or graph.
- To search for a specific payee, type the name. The list scrolls to the payee, if it exists.
- As with the options on the other tabs, you can use the options in the Matching section to enter specific category and transaction information that you want to see for that payee.
Did You Know? Use the No Payee option to view transactions that match the category requirements. If there are transactions that do not have a payee assigned to them, you can still view those transactions in the report or graph by selecting the No Payee option shown at the top of the payee list. This tells Quicken to include all transactions that match the category requirements that you specified in the Category text box, even if they are not assigned to a specific payee. |
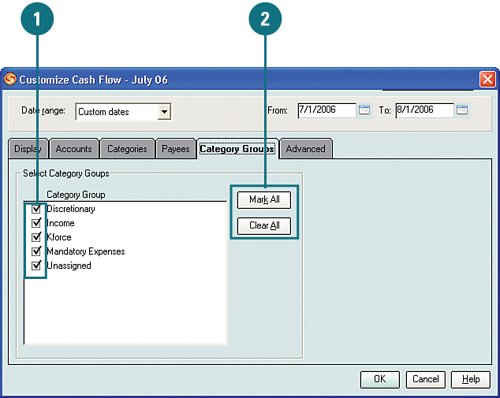
Set Category Group Options - On the Category Groups tab, select or clear the category groups that you want to include in the report or graph. Selecting groups tells Quicken to include any transaction sums and totals that are associated with that category group.
- To select all groups listed, click Mark All and to remove all selected groups, click Clear All.
Did You Know? Use the Unassigned option to view transactions that match the category requirements. To ensure that all transactions are included that meet your requirements, select the Unassigned option shown at the bottom of the Category Group list in step 2. This tells Quicken to include all transactions that match the requirements that you specified on the Accounts tab, even if they are not assigned to a category group. |
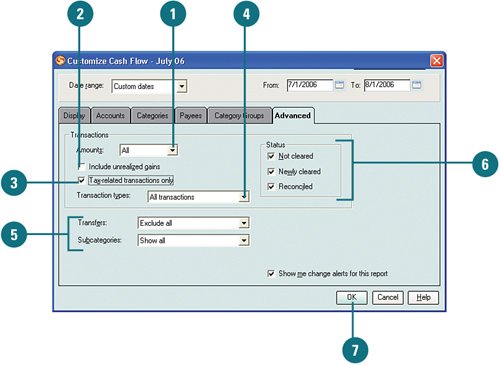
Set Advanced Options - On the Advanced tab, to view all transaction amounts, select All from the Amounts drop-down menu. Or, to view amounts greater or less than a specific figure, select another option and type the figure you want to use as the baseline.
- Select Include Unrealized Gains to show any investment transactions that reflect increases and/or decreases in security values.
- Select Tax-Related Transactions Only to show only transactions that are related to your taxes.
- Select the type of transactions you want to view in the report or graph.
- Select whether or not you want to view transfer transactions and sub-categories in the report or graph.
- Select the transaction statuses you want to view.
- Click OK to save your changes.
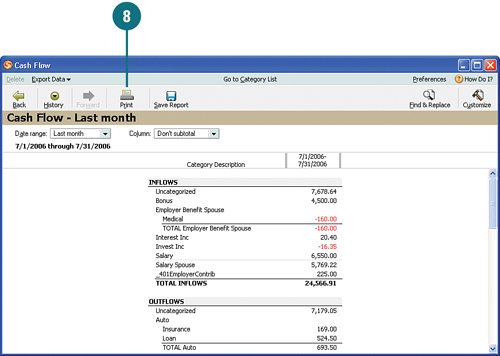
 - To print the report, click Print.
Did You Know? You can use the Quicken taskbar to return to the Reports & Graphs window. You can go back to the Reports & Graphs window to view and run other reports by clicking the Reports & Graphs icon on the Quicken taskbar (at the bottom of the Quicken main window). When you open a report, the Reports & Graphs window doesn't go away; it minimizes to the taskbar. The Quicken taskbar works just like the Windows taskbar. If you have more than one program open in Windows, the programs you are not using are minimized on your taskbar, next to the Start menu. Quicken works the same way. |
|