Run Charts
Run charts are also frequently used for software project management; numerous reallife examples can be found in books and journals on software engineering. For example, the weekly arrival of defects and defect backlog during the formal machine testing phases can be monitored via run charts. These charts serve as real-time statements of quality as well as workload. Often these run charts are compared to the historical data or a projection model so that the interpretation can be placed into proper perspective. Another example is tracking the percentage of software fixes that exceed the fix response time criteria. The goal is to ensure timely deliveries of fixes to customers.
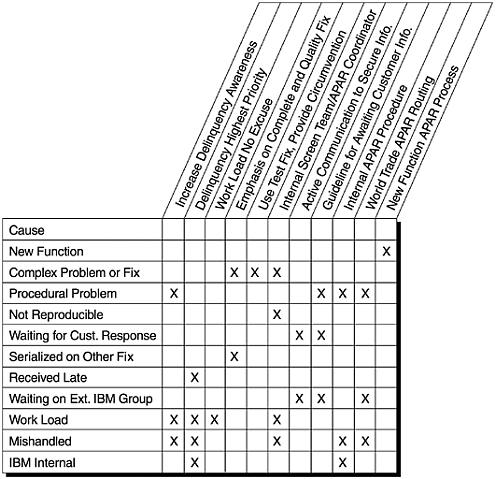
Figure 5.7 shows a run chart for the weekly percentage of delinquent open reports of field defects (defect reports that were not yet closed with fixes by the response time criteria) of an IBM Rochester product. The horizontal line (denoted by the letter T ) is the target delinquency rate. The dashed vertical line denotes the time when special remedial actions were rolled out to combat the high delinquency rate. For each delinquent defect report, causal analysis was done and corresponding actions implemented. A sample of the cause categories and the actions implemented are shown in Figure 5.8. As a result, the delinquent-defect report rate was brought down to target in about one month. The rate fluctuated around the target for about four months and eventually was brought under control. (The acronym APAR in Figure 5.8 stands for Authorized Programming Analysis Report, which refers to reports of postrelease problem.)
Figure 5.7. Run Chart of Percentage of Delinquent Fixes
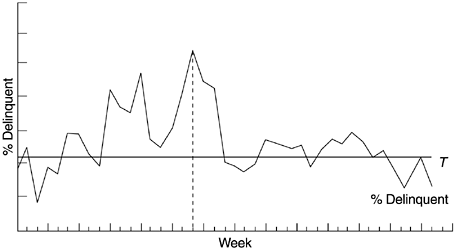
Figure 5.8. Causes of and Actions to Reduce Delinquent Fixes
Another type of run chart used by many software development organizations for project and schedule management is the S curve, which tracks the cumulative progress of the parameter of interest over time compared to the plan. At IBM Rochester, parameters that are tracked for every project in terms of actual versus planned include:
- Completion of design review over time
- Completion of code inspection over time
- Completion of code integration over time
- Completion of component test in terms of number of test cases attempted and successful over time
- Completion of system test in terms of number of test cases attempted and successful over time
- Other parameters related to project and quality management
What Is Software Quality?
Software Development Process Models
- Software Development Process Models
- The Waterfall Development Model
- The Prototyping Approach
- The Spiral Model
- The Iterative Development Process Model
- The Object-Oriented Development Process
- The Cleanroom Methodology
- The Defect Prevention Process
- Process Maturity Framework and Quality Standards
Fundamentals of Measurement Theory
- Fundamentals of Measurement Theory
- Definition, Operational Definition, and Measurement
- Level of Measurement
- Some Basic Measures
- Reliability and Validity
- Measurement Errors
- Be Careful with Correlation
- Criteria for Causality
Software Quality Metrics Overview
- Software Quality Metrics Overview
- Product Quality Metrics
- In-Process Quality Metrics
- Metrics for Software Maintenance
- Examples of Metrics Programs
- Collecting Software Engineering Data
Applying the Seven Basic Quality Tools in Software Development
- Applying the Seven Basic Quality Tools in Software Development
- Ishikawas Seven Basic Tools
- Checklist
- Pareto Diagram
- Histogram
- Run Charts
- Scatter Diagram
- Control Chart
- Cause-and-Effect Diagram
- Relations Diagram
Defect Removal Effectiveness
- Defect Removal Effectiveness
- Literature Review
- A Closer Look at Defect Removal Effectiveness
- Defect Removal Effectiveness and Quality Planning
- Cost Effectiveness of Phase Defect Removal
- Defect Removal Effectiveness and Process Maturity Level
The Rayleigh Model
- The Rayleigh Model
- Reliability Models
- The Rayleigh Model
- Basic Assumptions
- Implementation
- Reliability and Predictive Validity
Exponential Distribution and Reliability Growth Models
- Exponential Distribution and Reliability Growth Models
- The Exponential Model
- Reliability Growth Models
- Model Assumptions
- Criteria for Model Evaluation
- Modeling Process
- Test Compression Factor
- Estimating the Distribution of Total Defects over Time
Quality Management Models
- Quality Management Models
- The Rayleigh Model Framework
- Code Integration Pattern
- The PTR Submodel
- The PTR Arrival and Backlog Projection Model
- Reliability Growth Models
- Criteria for Model Evaluation
- In-Process Metrics and Reports
- Orthogonal Defect Classification
In-Process Metrics for Software Testing
- In-Process Metrics for Software Testing
- In-Process Metrics for Software Testing
- In-Process Metrics and Quality Management
- Possible Metrics for Acceptance Testing to Evaluate Vendor-Developed Software
- How Do You Know Your Product Is Good Enough to Ship?
Complexity Metrics and Models
- Complexity Metrics and Models
- Lines of Code
- Halsteads Software Science
- Cyclomatic Complexity
- Syntactic Constructs
- Structure Metrics
- An Example of Module Design Metrics in Practice
Metrics and Lessons Learned for Object-Oriented Projects
- Metrics and Lessons Learned for Object-Oriented Projects
- Object-Oriented Concepts and Constructs
- Design and Complexity Metrics
- Productivity Metrics
- Quality and Quality Management Metrics
- Lessons Learned from OO Projects
Availability Metrics
- Availability Metrics
- 1 Definition and Measurements of System Availability
- Reliability, Availability, and Defect Rate
- Collecting Customer Outage Data for Quality Improvement
Measuring and Analyzing Customer Satisfaction
- Measuring and Analyzing Customer Satisfaction
- Customer Satisfaction Surveys
- Analyzing Satisfaction Data
- Satisfaction with Company
- How Good Is Good Enough
Conducting In-Process Quality Assessments
- Conducting In-Process Quality Assessments
- The Preparation Phase
- The Evaluation Phase
- The Summarization Phase
- Recommendations and Risk Mitigation
Conducting Software Project Assessments
- Conducting Software Project Assessments
- Audit and Assessment
- Software Process Maturity Assessment and Software Project Assessment
- Software Process Assessment Cycle
- A Proposed Software Project Assessment Method
Dos and Donts of Software Process Improvement
- Dos and Donts of Software Process Improvement
- Measuring Process Maturity
- Measuring Process Capability
- Staged versus Continuous Debating Religion
- Measuring Levels Is Not Enough
- Establishing the Alignment Principle
- Take Time Getting Faster
- Keep It Simple or Face Decomplexification
- Measuring the Value of Process Improvement
- Measuring Process Adoption
- Measuring Process Compliance
- Celebrate the Journey, Not Just the Destination
Using Function Point Metrics to Measure Software Process Improvements
- Using Function Point Metrics to Measure Software Process Improvements
- Software Process Improvement Sequences
- Process Improvement Economics
- Measuring Process Improvements at Activity Levels
Concluding Remarks
- Concluding Remarks
- Data Quality Control
- Getting Started with a Software Metrics Program
- Software Quality Engineering Modeling
- Statistical Process Control in Software Development
A Project Assessment Questionnaire
EAN: 2147483647
Pages: 176
