Reliability Growth Models
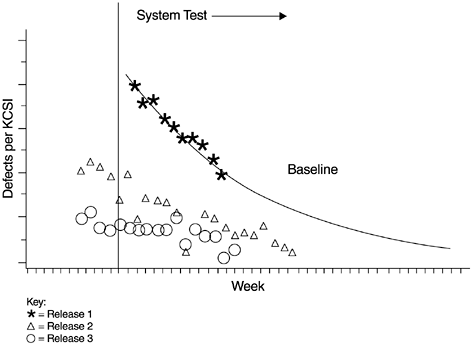
Although reliability growth models are meant for reliability assessment, they are also useful for quality management at the back end of the development process. Models developed from a previous product or a previous release of the same product can be used to track the testing defects of the current product. To have significant improvement, the defect arrival rate (or failure density) of the current project must fall below the model curve. Figure 9.15 shows an example from a systems software product developed at IBM Rochester. Each data point represents a weekly defect arrival rate during the system test phase. The defect arrival patterns represented by the triangles and circles indicate two later releases of the same product. Compared to the baseline model curve, both new releases witnessed a significant reduction in defect rate during the system test phase.
Figure 9.15. Reliability Growth Model for Quality Management

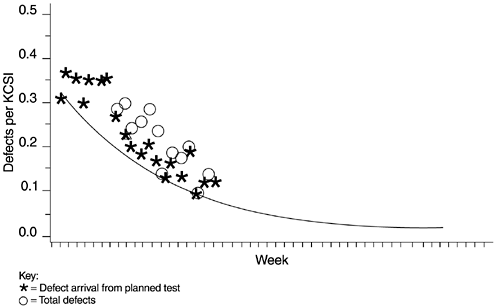
As a second example, when another product was just about at the start of system testing, the PTR arrival rates were unusually high compared to the model. It was clear that proceeding in a business-as-usual manner would not result in meeting the product's quality goal. A special quality improvement program (QIP) was then pro-posed, evaluated, approved, and swiftly implemented. The QIP involved five extra activities:
- Blitz testing ” "artistic" testing in stressful environments
- Customer evaluation ” customers conducting testing in the development laboratory
- Code inspections ” additional inspections of error-prone modules, especially routines that are difficult to test such as the error recovery/exception handling routines
- Design reviews ” rereview of designs of suspect components and modules
- Extension of system test ” improvement of test suites and extension of testing schedules to allow thorough final test execution
Because of the special QIP activities, the product ship date was delayed one month. As a result, more than 250 would-be field defects were found and removed. The field quality of the product, evidenced by field defect arrivals reported in later years , improved significantly.
Figure 9.16 shows the defect arrival pattern of the product during system test. The data points represent the weekly defect rate (per thousand new and changed code ”KCSI). The asterisks represent the defect arrival from the originally planned system test. The circles represent the total defect rates including the additional defects discovered and removed via the QIP activities. Since the QIP activities and defects were specially marked in the defect tracking system, we were able to assess the additional defect removal by the program.
Figure 9.16. High Defect Arrival During System Test Compared to Model

One of the advantages of using the reliability growth models as a quality management tool is that comparisons can be made when the first data points become available. If unfavorable signs are detected (e.g., defect arrivals are much too high), timely actions can be taken. In contrast, for reliability assessment and projection, a substantial amount of data has to be available for the models to be reliable. For models with an inflection point (such as the delayed S and inflection S models), data must be available beyond the inflection point if the models are to work. As discussed in the preceding chapter, studies show that the exponential process model needs to have data from about 60% of the system test in order to provide reasonably adequate fit and projection. Therefore, the reliability models can be used more liberally for quality management than for reliability projection.
The typical use of reliability models for quality management, as described in the software reliability literature, is to determine the end date of testing given a reliability goal or a specific defect level to be achieved. If the model derived from the current data indicates less-than -desirable quality, then more testing will be done until the reliability reaches the goal. This strategy assumes an abundance of extra test cases is available or the generation of extra test cases is relatively easy. For many commercial development projects, such an assumption may be difficult to meet. Test plans and test cases are developed over time along with design and code development; adding effective test cases is not a task that can be accomplished in a short time. Therefore, actions other than simply prolonging the testing (such as customer beta test, special stress testing, etc.) should also be considered .
Managing development quality based on reliability models at the back end should be used as the last step in the broader context of a series of quality management models. It should not be the sole approach. A software development quality management system should put as much focus as possible at the front end, and actions should be triggered as early as possible if negative indicators are observed . Actions taken at design, code, unit test, code integration time, and even at early formal machine testing time, are apt to be more cost effective and have a smaller chance of affecting the delivery date than later actions. Unfortunately, in the software reliability literature, one often gets the impression that the main way to achieve quality is to keep on testing until the defect arrival rate or the mean time to failure rate reaches the desirable level. Such a testing strategy to achieve quality improvement is not a good one. It is more applicable to research projects than to commercial developments, which often do not have the luxury to react at the back end and to delay delivery. The QIP example given earlier was the last major improvement action of that product, not the only one.
Finally, when interpreting the defect arrival data against a predetermined model, the variable of testing effort or coverage must be taken into consideration. For instance, if the defect arrivals are substantially below the model curve (as is the case in Figure 9.15), questions arise such as, "are the lower defects due to less effective testing or really due to better quality?" In this regard, the effort/outcome model in Figure 9.4 also applies to the testing phases. In Chapter 10, we discuss the effort/ outcome model with respect to in-process metrics for testing.
What Is Software Quality?
Software Development Process Models
- Software Development Process Models
- The Waterfall Development Model
- The Prototyping Approach
- The Spiral Model
- The Iterative Development Process Model
- The Object-Oriented Development Process
- The Cleanroom Methodology
- The Defect Prevention Process
- Process Maturity Framework and Quality Standards
Fundamentals of Measurement Theory
- Fundamentals of Measurement Theory
- Definition, Operational Definition, and Measurement
- Level of Measurement
- Some Basic Measures
- Reliability and Validity
- Measurement Errors
- Be Careful with Correlation
- Criteria for Causality
Software Quality Metrics Overview
- Software Quality Metrics Overview
- Product Quality Metrics
- In-Process Quality Metrics
- Metrics for Software Maintenance
- Examples of Metrics Programs
- Collecting Software Engineering Data
Applying the Seven Basic Quality Tools in Software Development
- Applying the Seven Basic Quality Tools in Software Development
- Ishikawas Seven Basic Tools
- Checklist
- Pareto Diagram
- Histogram
- Run Charts
- Scatter Diagram
- Control Chart
- Cause-and-Effect Diagram
- Relations Diagram
Defect Removal Effectiveness
- Defect Removal Effectiveness
- Literature Review
- A Closer Look at Defect Removal Effectiveness
- Defect Removal Effectiveness and Quality Planning
- Cost Effectiveness of Phase Defect Removal
- Defect Removal Effectiveness and Process Maturity Level
The Rayleigh Model
- The Rayleigh Model
- Reliability Models
- The Rayleigh Model
- Basic Assumptions
- Implementation
- Reliability and Predictive Validity
Exponential Distribution and Reliability Growth Models
- Exponential Distribution and Reliability Growth Models
- The Exponential Model
- Reliability Growth Models
- Model Assumptions
- Criteria for Model Evaluation
- Modeling Process
- Test Compression Factor
- Estimating the Distribution of Total Defects over Time
Quality Management Models
- Quality Management Models
- The Rayleigh Model Framework
- Code Integration Pattern
- The PTR Submodel
- The PTR Arrival and Backlog Projection Model
- Reliability Growth Models
- Criteria for Model Evaluation
- In-Process Metrics and Reports
- Orthogonal Defect Classification
In-Process Metrics for Software Testing
- In-Process Metrics for Software Testing
- In-Process Metrics for Software Testing
- In-Process Metrics and Quality Management
- Possible Metrics for Acceptance Testing to Evaluate Vendor-Developed Software
- How Do You Know Your Product Is Good Enough to Ship?
Complexity Metrics and Models
- Complexity Metrics and Models
- Lines of Code
- Halsteads Software Science
- Cyclomatic Complexity
- Syntactic Constructs
- Structure Metrics
- An Example of Module Design Metrics in Practice
Metrics and Lessons Learned for Object-Oriented Projects
- Metrics and Lessons Learned for Object-Oriented Projects
- Object-Oriented Concepts and Constructs
- Design and Complexity Metrics
- Productivity Metrics
- Quality and Quality Management Metrics
- Lessons Learned from OO Projects
Availability Metrics
- Availability Metrics
- 1 Definition and Measurements of System Availability
- Reliability, Availability, and Defect Rate
- Collecting Customer Outage Data for Quality Improvement
Measuring and Analyzing Customer Satisfaction
- Measuring and Analyzing Customer Satisfaction
- Customer Satisfaction Surveys
- Analyzing Satisfaction Data
- Satisfaction with Company
- How Good Is Good Enough
Conducting In-Process Quality Assessments
- Conducting In-Process Quality Assessments
- The Preparation Phase
- The Evaluation Phase
- The Summarization Phase
- Recommendations and Risk Mitigation
Conducting Software Project Assessments
- Conducting Software Project Assessments
- Audit and Assessment
- Software Process Maturity Assessment and Software Project Assessment
- Software Process Assessment Cycle
- A Proposed Software Project Assessment Method
Dos and Donts of Software Process Improvement
- Dos and Donts of Software Process Improvement
- Measuring Process Maturity
- Measuring Process Capability
- Staged versus Continuous Debating Religion
- Measuring Levels Is Not Enough
- Establishing the Alignment Principle
- Take Time Getting Faster
- Keep It Simple or Face Decomplexification
- Measuring the Value of Process Improvement
- Measuring Process Adoption
- Measuring Process Compliance
- Celebrate the Journey, Not Just the Destination
Using Function Point Metrics to Measure Software Process Improvements
- Using Function Point Metrics to Measure Software Process Improvements
- Software Process Improvement Sequences
- Process Improvement Economics
- Measuring Process Improvements at Activity Levels
Concluding Remarks
- Concluding Remarks
- Data Quality Control
- Getting Started with a Software Metrics Program
- Software Quality Engineering Modeling
- Statistical Process Control in Software Development
A Project Assessment Questionnaire
EAN: 2147483647
Pages: 176
