Collecting Customer Outage Data for Quality Improvement
How does one collect customer outage data to determine the availability level of one's product (be it software, hardware, or a server computer system including hardware and software) and use the data to drive quality improvement? There are at least three approaches: collect the data directly from a small core set of customers, collect the data via your normal service process, and conduct special customer surveys.
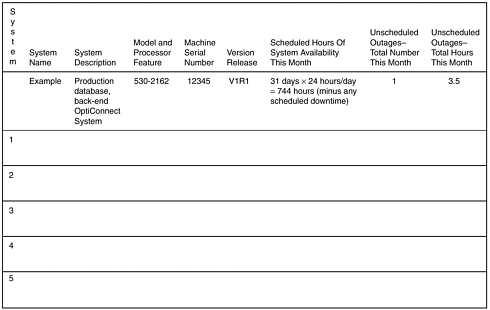
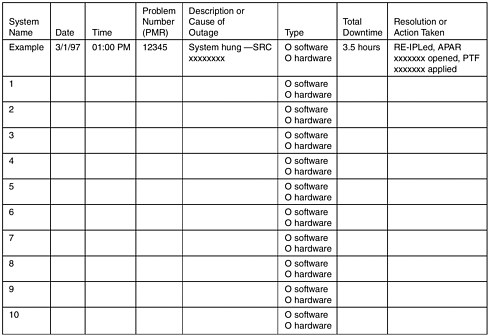
Collecting outage data directly from customers is recommended only for a small number of customers. Otherwise, it would not be cost-effective and the chance of success would be low. Such customers normally are key customers and system availability is particularly important to them. The customers' willingness to track outage data accurately is a critical factor because this is a joint effort. Examples of data collection forms are shown in Figures 13.1 and 13.2. The forms gather two types of information: the demographics of each system (Figure 13.1) and the detailed information and action of each outage (Figure 13.2). These forms and data collection can also be implemented in a Web site.
Figure 13.1. A Tracking Form for System Demographics and Outage Summary

Figure 13.2. A Tracking Form for Outage Specifics

The raw data gathered via the two forms is sufficient to derive the following indicators:
- Scheduled hours of operations (uptime)
- Equivalent system years of operations
- Total hours of downtime
- System availability
- Average outages per system per year
- Average downtime (hours) per system per year
- Average time (hours) per outage
The value of these metrics can be estimated every month or every quarter, depending on the amount of data available (i.e., sufficient number of equivalent system years of operations for each period). Trends of these metrics can be formed and monitored , and correlated with the timing of new releases of the product, or special improvement actions.
With more data, one can analyze the causes of outages, identify the problem components of the system, and take systematic improvement actions. Note that in the form in Figure 13.2, the problem management record (PMR) number should be used to link the outage incident to the customer problem record in the normal service process. Therefore, in-depth data analysis can be performed to yield insights for continual improvement.
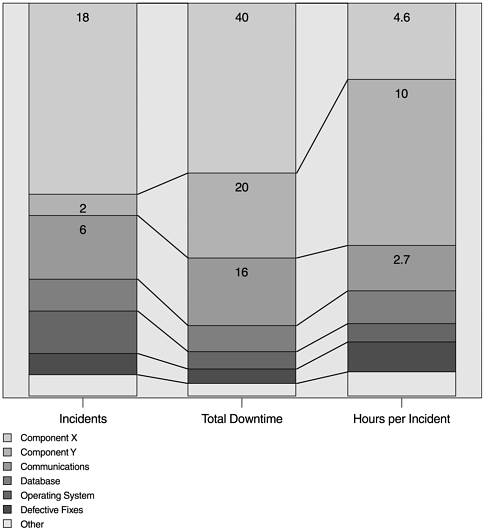
Figure 13.3 shows a hypothetical example of the contribution of software components to the unavailability of a software system. In this case, component X of the system accounted for the most outages and downtime. This is likely an indication of poor intrinsic product quality. On the other hand, component Y accounts for only two incidents but the total downtime caused by these two outages are significant. This may be due to issues related to problem determination or inefficiencies involved in developing and delivering fixes. Effective improvement actions should be guided by these metrics and results from causal analyses.
Figure 13.3. Incidents of Outage, Total Downtime, and Hour per Incident by Software Component

The second way to obtain customer outage data is via the normal service process. When a customer experiences a problem and calls the support center, a call record or problem management record (PMR) is created. A simple screening procedure (e.g., via a couple of standard questions) can be established with the call record process to identify the outage-related customer calls. The total number of licenses of the product in a given time period can be used as a denominator. The rate of outage-related customer problem calls normalized to the number of license data can then be used to form some indicator of product outage rate in the field. Because this data is from the service problem management records, all information gathered via the service process is available for in-depth analysis.
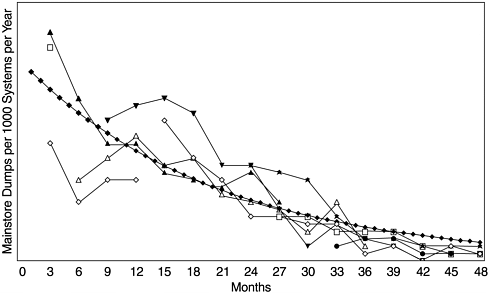
Figure 13.4 shows an example of the outage incidence rate (per 1000 systems per year) for several releases of a software system over time, expressed as months after the delivery of the releases. None of the releases has complete data over the 48-month time span. Collectively, the incidence curves show a well-known pattern of the exponential distribution. Due to the fluctuations related to small numbers in the first several months after delivery, initially we wondered whether the pattern would follow a Rayleigh model or an exponential model. But with more data points from the last three releases, the exponential model became more convincing and was confirmed by a statistical goodness-of-fit test.
Figure 13.4. Software High-Impact Outage Rate and Exponential Model

We note that outage data from the service process is related to the frequencies of outages and their causes. However, the outage duration data is usually not available because it would require a two-pass process that is expensive to implement ” following up with the customers and requesting duration data when the problem is resolved. Because of this, the metric derived from this data (such as the example in Figure 13.4) pertains more to the reliability concept instead of the system availability. Nonetheless, it is also an availability measurement because the numerator data is outages. The delineation between reliability and availability in this case becomes blurred.
The third approach to collecting customer outage information is through special customer surveys, which have several advantages. First, through sampling designs, one can get a representative and sufficiently large sample of one's entire customer set. Second, the survey can cover related topics in addition to outage information per se, such as customers' maintenance practices, scheduled downtime, scheduled uptime, satisfaction with system availability, and specific elements that contribute to system availability. Responses from these related topics can provide useful information for the product vendor with regard to its improvement strategies and customer relationship management. Third, surveys are cost-effective. On the other hand, a major drawback of the survey approach is that the accuracy of the quantitative outage data is not likely as good as that of the previous approaches. If the customers didn't have regular outage tracking in place, their responses might be based on recollection and approximation . Another limitation is that survey data is not adequate for root cause analysis because it is not meant to provide in-depth information of specific outage incidents.
Our experience is that special customer surveys can provide useful information for the overall big picture and this approach is complementary to the other approaches. For example, a representative survey showed that the customers' profile of scheduled uptime (number of hours per week) for a software system is as follows :
- 40 hours: 11%
- 41 “80 hours: 17%
- 81 “120 hours: 8%
- 121 “160 hours: 11%
- 168 hours (24 x 7): 53%
It is obvious from this profile that the customers of this software would demand high availability. When this data is analyzed together with other variables such as satisfaction with system availability, maintenance strategy, type of business, types of operations the software is used for, and potential of future purchases, the information will be tremendously useful for the product vendor's improvement plans.
What Is Software Quality?
Software Development Process Models
- Software Development Process Models
- The Waterfall Development Model
- The Prototyping Approach
- The Spiral Model
- The Iterative Development Process Model
- The Object-Oriented Development Process
- The Cleanroom Methodology
- The Defect Prevention Process
- Process Maturity Framework and Quality Standards
Fundamentals of Measurement Theory
- Fundamentals of Measurement Theory
- Definition, Operational Definition, and Measurement
- Level of Measurement
- Some Basic Measures
- Reliability and Validity
- Measurement Errors
- Be Careful with Correlation
- Criteria for Causality
Software Quality Metrics Overview
- Software Quality Metrics Overview
- Product Quality Metrics
- In-Process Quality Metrics
- Metrics for Software Maintenance
- Examples of Metrics Programs
- Collecting Software Engineering Data
Applying the Seven Basic Quality Tools in Software Development
- Applying the Seven Basic Quality Tools in Software Development
- Ishikawas Seven Basic Tools
- Checklist
- Pareto Diagram
- Histogram
- Run Charts
- Scatter Diagram
- Control Chart
- Cause-and-Effect Diagram
- Relations Diagram
Defect Removal Effectiveness
- Defect Removal Effectiveness
- Literature Review
- A Closer Look at Defect Removal Effectiveness
- Defect Removal Effectiveness and Quality Planning
- Cost Effectiveness of Phase Defect Removal
- Defect Removal Effectiveness and Process Maturity Level
The Rayleigh Model
- The Rayleigh Model
- Reliability Models
- The Rayleigh Model
- Basic Assumptions
- Implementation
- Reliability and Predictive Validity
Exponential Distribution and Reliability Growth Models
- Exponential Distribution and Reliability Growth Models
- The Exponential Model
- Reliability Growth Models
- Model Assumptions
- Criteria for Model Evaluation
- Modeling Process
- Test Compression Factor
- Estimating the Distribution of Total Defects over Time
Quality Management Models
- Quality Management Models
- The Rayleigh Model Framework
- Code Integration Pattern
- The PTR Submodel
- The PTR Arrival and Backlog Projection Model
- Reliability Growth Models
- Criteria for Model Evaluation
- In-Process Metrics and Reports
- Orthogonal Defect Classification
In-Process Metrics for Software Testing
- In-Process Metrics for Software Testing
- In-Process Metrics for Software Testing
- In-Process Metrics and Quality Management
- Possible Metrics for Acceptance Testing to Evaluate Vendor-Developed Software
- How Do You Know Your Product Is Good Enough to Ship?
Complexity Metrics and Models
- Complexity Metrics and Models
- Lines of Code
- Halsteads Software Science
- Cyclomatic Complexity
- Syntactic Constructs
- Structure Metrics
- An Example of Module Design Metrics in Practice
Metrics and Lessons Learned for Object-Oriented Projects
- Metrics and Lessons Learned for Object-Oriented Projects
- Object-Oriented Concepts and Constructs
- Design and Complexity Metrics
- Productivity Metrics
- Quality and Quality Management Metrics
- Lessons Learned from OO Projects
Availability Metrics
- Availability Metrics
- 1 Definition and Measurements of System Availability
- Reliability, Availability, and Defect Rate
- Collecting Customer Outage Data for Quality Improvement
Measuring and Analyzing Customer Satisfaction
- Measuring and Analyzing Customer Satisfaction
- Customer Satisfaction Surveys
- Analyzing Satisfaction Data
- Satisfaction with Company
- How Good Is Good Enough
Conducting In-Process Quality Assessments
- Conducting In-Process Quality Assessments
- The Preparation Phase
- The Evaluation Phase
- The Summarization Phase
- Recommendations and Risk Mitigation
Conducting Software Project Assessments
- Conducting Software Project Assessments
- Audit and Assessment
- Software Process Maturity Assessment and Software Project Assessment
- Software Process Assessment Cycle
- A Proposed Software Project Assessment Method
Dos and Donts of Software Process Improvement
- Dos and Donts of Software Process Improvement
- Measuring Process Maturity
- Measuring Process Capability
- Staged versus Continuous Debating Religion
- Measuring Levels Is Not Enough
- Establishing the Alignment Principle
- Take Time Getting Faster
- Keep It Simple or Face Decomplexification
- Measuring the Value of Process Improvement
- Measuring Process Adoption
- Measuring Process Compliance
- Celebrate the Journey, Not Just the Destination
Using Function Point Metrics to Measure Software Process Improvements
- Using Function Point Metrics to Measure Software Process Improvements
- Software Process Improvement Sequences
- Process Improvement Economics
- Measuring Process Improvements at Activity Levels
Concluding Remarks
- Concluding Remarks
- Data Quality Control
- Getting Started with a Software Metrics Program
- Software Quality Engineering Modeling
- Statistical Process Control in Software Development
A Project Assessment Questionnaire
EAN: 2147483647
Pages: 176
