6.6 TMTP Version 5.2 best practices
|
| < Day Day Up > |
|
6.6 TMTP Version 5.2 best practices
This section describes our recommendations on how to implement and configure TMTP Version 5.2 to maximize effectiveness and performance in your production environment. Please note that although the following recommendations are general and suitable to most typical production environments, you may need to customize configurations for your environment and particular requirements.
Overview of recommendations
-
Use the following default J2EE Monitoring settings for long term monitoring during normal operation in the production environment.
-
Only record aggregate records.
-
Discovery Policies for J2EE and QoS transactions should be run and then disabled once listening policies have been created off the discovered transactions.
Note The Discovery Policies may be re-enabled at a future date if further transaction discovery is required.
-
Use a 20% sampling rate.
-
Set low tracing detail.
-
-
Define the URI filters as narrow as possible to match the transaction patterns you are interested in monitoring. This will optimize monitoring overhead during normal operation in the production environment. The narrow URI filters also help the effectiveness of analysis of TMTP reports, as you can selectively investigate transaction data of interest.
-
It is suggested to avoid using regular expressions that contain wildcard (.*) in the middle of URI filter, if possible.
-
Only turn up the tracing details when a performance or availability violation is detected for the J2EE application server to allow for quick debugging of the situation. It is recommended for high traffic Web sites to set the Sample Rate lower than 20% when a tracing detail higher than the "Low" level is used. Setting the maximum number of sample per minute instead of the sample rate is also recommended to better regulate monitoring overhead during a high traffic period.
-
In a production environment, we recommend collecting Aggregate Data Only. TMTP will automatically collect a certain number of Instance records when a failure is detected. It is not recommended to collect Aggregate and Instance records during normal operation in a production environment, as it may generate overwhelming data.
-
In a large-scale environment with more than 100 Management Agents uploading ARM data to the Management Server database, the scheduled data persistence may take more than a few minutes. As disk access may be a bottleneck for persisting or retrieving data to/from the DB, make sure the hard drive and the disk interface have good read/write performance. Consider keeping the database on a dedicated physical disk if possible and using RAID.
-
In a large-scale environment, we suggest increasing the Maximum Heap size for the WebSphere Application Server 5.0 JVM where the Management Server runs.
From the WebSphere Application Server admin console, select Servers → Application Servers → server1 → Process Definition → Java Virtual Machine, and set the Max heap Size to 256 > Larger Value.
Consider changing the WebSphere Application Server JVM Maximum Heap size to half the physical memory on the system if there are no competing products that require the unallocated memory.
Note Having a higher setting for the WebSphere Application Server JVM Maximum Heap size means that WebSphere Application Server can use up to this maximum value if required.
-
Run db2 reorgchk daily on the database to prevent the UI/Reports performance from degrading as the database grows. This command will reorganize the indexes.
Note The db2 reorgchk command might take some time to complete and may need to be scheduled at off peak times.
Best practice for J2EE application monitoring and debugging
Out of the box, the TMTP J2EE Monitoring Component records a summary of the transactions in the J2EE application server. This default summary level is optimal for long term monitoring during normal operation. The default settings include the following characteristics:
-
Only record aggregate records
-
20% sampling rate
-
Low tracing detail
With these settings, the normal transaction flow is recorded for 20% of the actual user transactions and only a summary or aggregate of the data is saved. The Low trace level turns on tracing for all inbound HTTP requests and all outbound JDBC and RMI requests. This setting allows for minimal performance impact on the monitored application server while still providing informative real time and historical data.
However, when a performance or availability violation is detected for the J2EE application server, it may become necessary to turn up some of the tracing detail to allow for quick debugging of the situation. This can easily be done by editing the existing Listening Policy and, under the section Configure J2EE settings the J2EE Trace Detail Level to Medium or High. Figure 6-9 shows how to change the default J2EE Trace Detail Level.
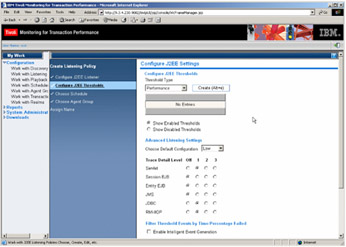
Figure 6-9: Configuring the J2EE Trace Level
The next time a violation occurs on that system, the monitoring component will automatically switch to collect instance data at its higher tracing detail. Customers with high traffic Web sites should set the sample rate lower than 20% and specify the maximum number of instances after failure on the Configure J2EE Listener page. Figure 6-10 shows how to set Sample Rate and specify the maximum number of Instances after failure.
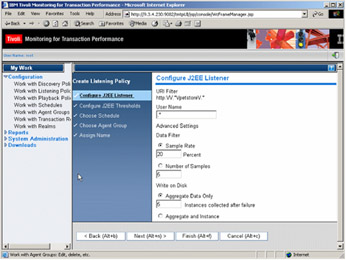
Figure 6-10: Configuring the Sample Rate and Failure Instances collected
This approach is recommended instead of manually changing the policy to collect Aggregate and Instance records. Collecting both Aggregate and full instance records has the potential to produce significant amounts of data that may not necessarily be required at normal operating levels. If you allow the Management Agent to dynamically switch to instance data collection when a violation occurs, then your instance records will only contain situations that resulted in the violation. With the higher J2EE Trace Detail Level, more transaction context information will be collected. Therefore, it will incur larger overhead on the instrumented J2EE application server. There are also larger amounts of data to be uploaded to the Management Server and persisted in the database. As a result, it may take a longer time to retrieve the latest data from Big Board.
You can now drill down into the topology for the violating policy and view the instance records that violated with the highest J2EE tracing detail. You can see exactly which J2EE class is performing outside its threshold and view its metric data to see what it was doing when it violated.
Once you have finished debugging the performance violation, it is recommended that the Listening Policy be changed to its default trace level of Low so that a minimal amount of data is collected at normal operation levels. This will improve the performance of the monitored J2EE application server and reduce the amount of data to be rolled up to Management Server.
Running DB2 on AIX
-
Do not create a 64-bit DB2 instance if you intend to use TEDW 1.1, as the DB2 7.2 client cannot connect to a 64-bit database.
-
Make sure to select Large File Enabled during the file system creation, so it can support files larger than 2 GB in size.
-
While performing large scale testing, we found that creating a file system of 14 GB in size to accommodate the TMTP DB was sufficient.
-
The database instance owner must have unlimited file size support. DB2 defaults to this, but double check in /etc/security/olimits. The instance owner should have fsize = -1.
|
| < Day Day Up > |
|
EAN: 2147483647
Pages: 105