Hack 33. Debug Ajax-Generated Tags in Firefox
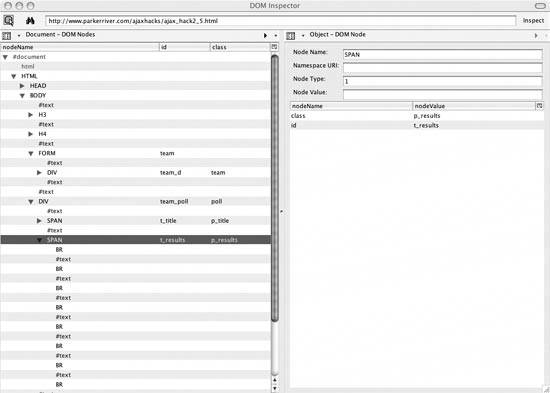
| Look at the new tags in a tree structure using Firefox's DOM Inspector. View The page, from "Submit Checkbox Values to the Server Without a Round Trip" [Hack #17], shows two sets of checkboxes representing team sports and individual sports. The application asks users to participate in a poll, choosing their favorite sports by checking the appropriate checkboxes. It then gets the latest results of the poll from a server program and displays them on the page. The checkboxes exist in the HTML source code; however, the text that eventually displays the poll results is dynamically generated on the page, without any visual submission or page refresh. To view the relevant code using Firefox, choose the menu command Tools Figure 4-9. DOM Inspector view in Firefox The left side of the window shows the entire hierarchical structure of the page's Document Object Model, with all the parent and child tags available for inspectionsimply click the little triangle widget next to a tag's name, then select an element or Node. These are the DOM nodes for the entire web page. Viewing the HTML page as a tree structure beginning from the top-level or root element, html, the nodes are the tree branches. Nodes contain parent nodes and child nodes, such as the body element containing p or div elements. In the DOM, Node objects represent the web page nodes. Click on an individual Node, such as the DIV tag in Figure 4-7, and the right side of the DOM Inspector shows all the Node object's properties and methods.
The provided information is highly valuable for programmers who write dynamic HTML (DHTML), which involves altering web pages on the fly. Despite all of this "DOM speak," believe me, this is heaven for a web developer who is working on a page with Ajax techniques! Inspecting Dynamic CreationsWhat if your page does not display as expected, and you want to look at the underlying code to see what's going on? View Figure 4-10. Voil\x88 , JavaScript-generated nodes
Figure 4-10 shows that an existing span element has new content in the form of BR tags and text nodes. If you click on a text node in the Inspector, the right side of the Inspector window shows the value of the node. This information can be invaluable for DOM programmers who are encountering a lot of text nodes, for example, that are empty strings. These empty nodes sprinkled throughout a page often pose difficulties for any code that iterates through the document nodes looking for specific nodes or structures. The DOM Inspector is a great tool for debugging Ajax applications, not to mention a handy way to examine the DOM structure of any web page and to learn about the available object properties and methods. |
EAN: 2147483647
Pages: 138
- Article 426: Fixed Outdoor Electric De-Icing and Snow-Melting Equipment
- Article 501 Class I Locations
- Notes to Tables
- Annex C. Conduit and Tubing Fill Tables for Conductors and Fixture Wires of the Same Size
- Example No. D5(b) Optional Calculation for Multifamily Dwelling Served at 208Y/120 Volts, Three Phase
 Page Source has always been a popular (if primitive) programmer tool for inspecting a web pages code, but the HTML generated by this menu command will not show the newly generated widgets that your Ajax applications might produce. It shows only the original HTML source code. Firefox, however, includes a DOM Inspector tool that shows these newly generated tags in a detailed hierarchical tree-type widget. Let's look at the web page http://www.parkerriver.com/ajaxhacks/ajax_hack2_5.html.
 DOM Inspector. Figure 4-9 shows the Inspector window that pops up.