Section 11.6. Networks of Queues
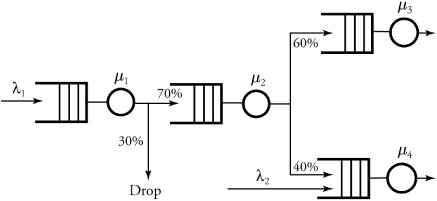
| Example. | Figure 11.20 shows four queueing nodes. There are two external sources at rates: » 1 = 2 million packets per second and » 2 = 0.5 million packets per second. Assume that all service rates are identical and equal to ¼ 1 = ¼ 2 = ¼ 3 = ¼ 4 = 2.2 million packets per second. Find the average delay on a packet passing through nodes 1, 2, and 4. Figure 11.20. A Four-queueing-node system solved using Burke's theorem |
| Solution. | The figure shows the utilizations as and The expected numbers of packets in nodes 1, 2 and 4 are, respectively: and The expected overall delay, then, is |
Burke's Theorem on Parallel Nodes
We can now easily apply Burke's theorem in cases of in-parallel queueing nodes, as shown in Figure 11.21. Suppose that the incoming traffic with rate » is distributed over m parallel queueing nodes with probabilities P 1 through P m , respectively. Also assume that the queuing nodes' service rates are ¼ 1 through ¼ m , respectively. In this system, the utilization for any node i is expressed by
Equation 11.66
![]()
Figure 11.21. Application of Burke's theorem on parallel nodes
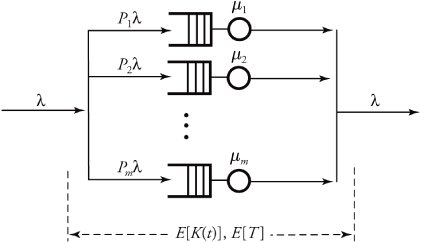
Assuming that each node is represented by an M/M/ 1 queueing model, we calculate the expected number of packets in the queue of a given node i by
Equation 11.67
![]()
But the main difference between a cascaded queueing system and a parallel queueing system starts here, at the analysis on average delay. In the parallel system, the overall average number of packets, ![]() , is an irrelevant metric. The new argument is that a packet has a random chance of P i to choose only one of the m nodes (node i ) and thus is not exposed to all m nodes. Consequently, we must calculate the average number of queued packets that a new arriving packet faces in a branch i . This average turns out to have a perfect stochastic pattern and is obtained by E [ K(t) ]:
, is an irrelevant metric. The new argument is that a packet has a random chance of P i to choose only one of the m nodes (node i ) and thus is not exposed to all m nodes. Consequently, we must calculate the average number of queued packets that a new arriving packet faces in a branch i . This average turns out to have a perfect stochastic pattern and is obtained by E [ K(t) ]:
Equation 11.68

Using Little's formula, we can first estimate the delay incurred in branch i :
Equation 11.69
![]()
Now, the total queueing delay that a packet should expect in the entire system, E [ T ], is the average delay over all m parallel branches. This delay is, in fact, a stochastic mean delay of all parallel branches, as follows :
Equation 11.70

Obviously, E [ T ] can help us estimate the speed of a particular m parallel-node system. An important note here is that Equations (11.64) and (11.68) may look the same. But the fact is that since the utilization in the case of cascaded nodes, i = » i /¼ i , and the one for parallel nodes, i = P i » i /¼ i , are different, the results of E [ K(t) ] in these cases too are different. We can argue identically on E [ T ] for the two cases. Although Equations (11.65) and (11.70) are similar, we should expect the overall delay in the parallel-node case to be far less than the one for in-series case, owing to the same reason.
11.6.2. Jackson's Theorem
One of the most frequently applied theorems in analyzing a network of queues is known as Jackson's theorem , which has several segments. Here, we emphasize the most applicable phase, known as open networks of queues. The essence of Jackson's theorem is applied to situations in which a packet visits a particular queue more than once. In such conditions, the network typically contains loops , or feedback .
Modeling Feedback in Networks
Figure 11.22 shows a basic cascaded queueing network, including a simple M/M/ 1 queueing element with a server in which simple feedback is implemented. Packets arrive at the left at rate ± , passing through a queue and server with service rate ¼ and are partially fed back to the system at rate ± 1 . Thus, this queueing architecture allows packets to visit the queue more than once by circulating them back to the system. This system is a model of many practical networking systems. One good example is switching systems that multicast packets step by step, using a recycling technique discussed in later chapters. In Figure 11.22, if the probability that a packet is fed back to the input is p , it is obvious that the total arrival rate to the queue, or » , is
Equation 11.71
![]()
Figure 11.22. A feedback system and its simplified equivalent

Equation (11.71) demonstrates that the equivalent of the system surrounded by the dashed line can be configured as shown in Figure 11.22. Since ± 1 = p» , we can combine this equation and Equation 11.71 and derive a relationship between » and ± as
Equation 11.72
![]()
The utilization of the simplified system denoted by ![]() is, clearly:
is, clearly:
Equation 11.73
![]()
By having the utilization of the system, we can derive the probability that k packets are in the system, P [ K(t) = k ], knowing that the system follows the M/M/ 1 rule:
Equation 11.74
![]()
The expected number of packets in the system, E [ K(t) ], can be derived by using the M/M/ 1 property:
Equation 11.75
![]()
Using Little's formula, we can now estimate the total queueing and service delay that a packet should expect. Let E [ T u ] be the expected delay for the equivalent unit shown in Figure 11.22 with lump sum arrival rate » . Let E [ T f ] be the expected delay for the system with arrival rate ± :
Equation 11.76
![]()
and
Equation 11.77
![]()
Note that we should always see the inequity E [ T u ] <E [ T f ] as expected.
Open Networks
Figure 11.23 shows a generic model of Jackson's theorem when the system is open. In this figure, unit i of an m -unit system is modeled with an arrival rate sum of » i and a service rate ¼ i . Unit i may receive an independent external traffic of ± i . The unit can receive feedback and feed-forward traffic from i - 1 other units. At the output of this unit, the traffic may proceed forward with probability P ii +1 or may leave the system with probability 1 - P ii +1 . The total arrival rate, » i , is then
Equation 11.78

Figure 11.23. Generalization of a node model for Jackson's theorem
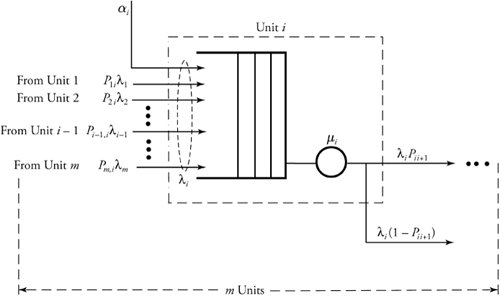
The instantaneous total number of packets in all m nodes, K(t) , is a vector consist of the number of packets in every individual node and is expressed by
Equation 11.79
![]()
The probability that k packets are in the system is the joint probabilities of numbers of packets in m units:
Equation 11.80

The expected number of packets in all units is obtained by
Equation 11.81
![]()
Finally, the most significant factor used in evaluating a system of queueing nodes, total delay at stage i , is calculated by applying Little's formula:
Equation 11.82

We assume that ± i is the only input to the entire system. In practice, there may be other inputs to the system, in which case the total delay can be obtained by using superposition . Equations (11.80) through (11.82) are the essence of Jackson's theorem on open queueing networks.
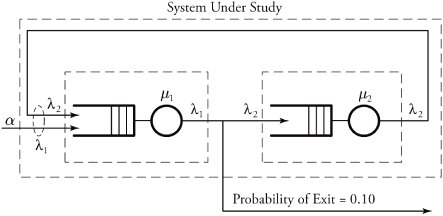
| Example. | Figure 11.24 shows a cascade of two M/M/ 1 nodes in which packets arrive at rate ± = 10, 000 packets per second. Service rates of both nodes are ¼ 1 = ¼ 2 = 200, 000 packets per second. At the output of node 1, packets exit with probability of p = 0.10; otherwise , they are driven into node 2 and then fed back to node 1. Find the estimated delay incurred on a packet, including the delay from circulations. Figure 11.24. Two communication nodes with feedback |
| Solution. | We first calculate the arrival rates to two nodes, » 1 and » 2 : » 1 =» 2 +± and » 2 =(1- p )» 1 . By applying the values of ± = 10, 000 and p = 0.10, this set of equations results in » 1 = 100, 000 and » 2 = 90, 000. The utilization for each system can now be derived as 1 = » 1 /¼ 1 = 0.5 and 2 = » 2 /¼ 2 = 0.45. According to M/M/ 1 discipline results obtained in the previous chapter, the average number of packets in each system is and The delay is and |
EAN: 2147483647
Pages: 211

