Chapter Fifteen Sales Management System: Managers Managing Pipelines and Salespeople
Fifteen Sales Management System Managers Managing Pipelines and Salespeople
Overview
The purpose of this chapter is threefold: (1) to help increase the performance and productivity of sales managers by introducing you to a sales management system, (2) to introduce you to forecasting methods and aids, and (3) to assist you with specific recommendations for getting started with the Solution Selling process.
First, it’s important to realize that outstanding individual sales performance doesn’t happen by chance. Although most world-class athletes are born with a lot of talent, that talent must be nurtured to reach its maximum potential. The same requirement applies to salespeople. There are very few natural-born superstar salespeople. Most of them need sales process and training. The most important roles a sales manager can play are coach, mentor, and trainer. This can be especially difficult for sales managers who weren’t prepared for these roles.
Research and results prove that the very best sales managers follow a sales process for selling and use a sales management system for managing. When it’s time to develop or coach salespeople, they draw on their expertise in these two areas to ensure success.
If you’re a sales manager, consistency is a key element of your success with your salespeople. It is also what most salespeople are looking for from you. Salespeople want to know that if they need help, you’ll be there with a consistent approach that always works, and you won’t be an overactive, aggressive sales manager questioning their decisions. The best thing you can do as a sales manager is to have a sales process and a management system that prompts you to consistently ask the right questions. The right questions can lead salespeople to positive and predictable outcomes. The rate of sales success rises sharply in direct relationship to a sales manager’s leadership.
Leadership is essential. Sales managers must set the example by their focus and actions. They must use a common language throughout the organization and ask the right questions. They must have appropriate expectations and communicate those effectively. They must set goals and measure against them. They must motivate and coach individuals to maximize sales results.
SALES MANAGEMENT CRITERIA
Most sales managers strive to meet three success criteria: (1) make the revenue numbers, (2) forecast sales revenues accurately, and (3) coach and develop the right team of people to get the job done. Which of these three criteria is most important may shift over time, but these three always seem to make it to the top of the list.
According to a recent Sales Performance International survey of sales managers at 134 different companies, inaccurate forecasting had become a big problem for them. In the survey, sales managers cited poor forecasting more often (54 percent) than either declining revenue (49 percent) or inadequate coaching (34 percent).
Sales managers certainly don’t like missing their revenue goals, but they really hate getting the forecasts wrong. It’s no wonder. In today’s mistrustful climate stemming from large corporate failures, they’re under more pressure than ever because companies need to know exactly where they are at all times, especially publicly traded companies. Wall Street doesn’t respect a management team that’s not in full control of the business, and that becomes evident when the business misses a forecast, negative or positive.
Forecasts are missed for many reasons. Whether it’s the economy, misunderstood sales pipelines, customer budget cuts, competition, market shifts, product inadequacies, or supply shortages, they all affect the forecast. Wall Street’s expectations compound the pressures. Good forecasting facilitates good goal setting, the right inventory levels, and maintaining manufacturing and customer service levels and ultimately revenues. As a result, accurate forecasting is one of the sales manager’s most critical responsibilities.
FORECASTING CHALLENGES
In the past, forecasting depended solely on a sales manager’s experience and judgment, which in turn depended on input from the sales force. But sales methodologies and processes have since emerged that need specific customer feedback to track such things as chains of selling events or pipeline Milestones and thereby improve forecasting accuracy.
For technology companies and companies selling large-ticket items or strategic applications, the challenge is even greater, because they have long and highly complex selling cycles. Some sales take over a year to close, so it’s not surprising that such companies are among the first trying to make forecasting a more reliable, systematic process.
The number one question CEOs ask their sales managers is, Are you going to make your numbers? Sales managers must answer this question and answer it correctly. I find that if sales managers are offended by this question (let’s call it what it is, “pressure”), it’s probably because the forecast is out of sync with reality. Consequently, sales managers always live with the anxiety of not being able to meet the number that the executive wants. This challenge will probably never go away, but it can be made much less risky by implementing two things: a reliable systematic sales process and a sales management system.
SOLUTION SELLING SALES MANAGEMENT SYSTEM
Our goals in developing the Solution Selling Sales Management System are to help sales managers (1) make their revenue numbers, (2) forecast revenues more accurately, and (3) coach and develop the right team of people to get the job done.
Figure 15.1 is a flow chart of our sales management system. On the basis of the Solution Selling Milestones you learned about in Chapter Fourteen, Coaching and Diagnosing (shown on the left axis) become two primary functions in this system. The flow goes like this: sales managers are able to diagnose pipeline content and quality, including individual pipeline opportunities; certain findings can be discovered and remedial action decided on; and then two kinds of coaching can take place—opportunity coaching and skill coaching. All this is followed up and reflected in corporate reporting, allowing a more accurate reality. I will discuss diagnosing and coaching separately.
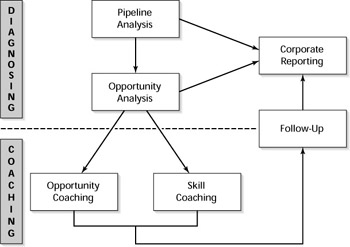
Figure 15.1: Sales Management System Flow Chart
Diagnosing
The sales pipeline is the cornerstone of the sales management system. In this pipeline is information about opportunities that will eventually deliver the much-needed revenues. Whether pipeline information (reporting) is automated or manual, very few sales managers have been taught how to diagnose their pipelines.
Diagnosis involves pipeline analysis (macromanagement) and opportunity analysis (micromanagement). Pipelines, pipeline reports, and pipeline analysis are the tools of the trade for sales managers, much like balance sheets and income statements are for accountants.
When you analyze a pipeline, what are you looking for? What do you want to find? Likely you are looking for the following:
- A pipeline’s overall health, including the projected sales revenue attainment for the quarter, the year, and beyond
- Bottlenecks in the pipeline
- Deficient selling behavior, such as the inability to get to Power
- Sales support deficiencies, such as inadequate presale technical support
- Marketing weak spots that need immediate action
- Revenue and timing deficiencies. For example, will sales revenues support the forecast, and will the likely revenue be adequate and at the right time?
By assessing the opportunities in the pipeline, you can project what you’re likely to attain in the future—both short term and long term. You can compare the shape of the pipeline, meaning the way opportunities are distributed by Milestone, and see bottlenecks that tell you about problems you would otherwise miss.
You can also compare the distribution of revenue by Milestone and get an improved picture of the forecast based on factual data. All this becomes more effective because you use customer-verifiable events to define your sales process steps.
Business Unit Pipeline Look at Figure 15.2. This report shows the pipeline for a sales unit. In Chapter Fourteen, I introduced this pipeline report, and we looked at it from an individual salesperson’s perspective.
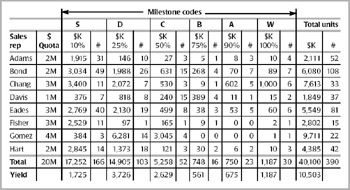
Figure 15.2: Business Unit Pipeline Report
In Figure 15.2 you see a chart of eight salespeople, each with a quota, followed by their individual pipelines graded according to Milestone codes. Gross totals are calculated in the two columns to the far right. At the bottom of the chart are the sales unit’s unweighted and weighted yield pipeline totals. In case you didn’t see it, the total row (second from the bottom) is multiplied by the Milestone grade (yield) percentage probability (second row from the top), resulting in the unit’s yield (the last row).
Although the unit’s total work in its pipeline is $40,100,000, the actual likely yield given all the work-to-date is only $10,503,000. That’s a different reality! That’s a different bottom line.
But can this aggregate data be analyzed in such a way that you know the total yield in your pipeline relative to your quota? For example, are you over or under the quota? What’s the shortfall, if any? What can you do about it?
Pipeline Analysis Worksheet Chapter Fourteen went into some detail about how an individual salesperson can use a Pipeline Analysis Worksheet. Let’s advance our analysis and look at the whole sales team.
Can you reliably estimate the amount of good business in your current pipeline? Are you able to estimate future pipeline sales? Can you answer the question, Are you going to attain your goals for the year? I believe you can if you use our sales management system.
Examine the example of a Pipeline Analysis Worksheet in Figure 15.3. Take note of the following:
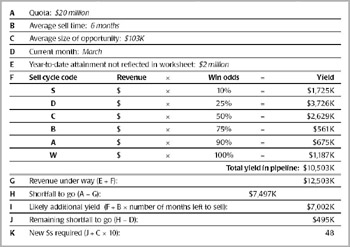
Figure 15.3: Pipeline Analysis Worksheet—Example
- The Average Size of Opportunity (row C) was calculated from the previous business unit pipeline report by dividing $40,100,000 by 390—the total number of opportunities. The result is an average opportunity size of $103,000.
- The Year-to-Date Attainment (row E), which is not reflected in the pipeline, tells us that in January and February, business closed at $2M.
- In this example, we know from past experience that the normal average sell time for an opportunity is six months (row B).
- The current month, March, is shown in D. This means that this worksheet covers business that will close, on average, in the months of March through August.
- The total yield in the sales unit’s existing pipeline is calculated in row F.
- The unknown (the likely additional yield that will happen in the months remaining in the year but not covered by the pipeline) can be seen in row I. This covers the months of September through December.
- Row J indicates and warns that there is a shortfall of $495,000.
We can use this early warning of a shortfall to calculate what additional effort is needed to close the gap. If you are facing a shortfall, you have at least four options.
Option 1 You could ask your sales unit to generate additional opportunities. The question here is, How many? If you choose this option (row K on the Pipeline Analysis Worksheet), you must know how many new sales must be initiated. To find out in this example, simply divide $495K (row J) by $103K (row C)—you will need 4.8 additional opportunities to close the gap. But you take this one step further. Since you only close one out of ten S Milestone opportunities, multiply 4.8 times 10. Thus you need to get your sales unit to generate forty-eight new opportunities to allow you to close the gap. So, you’ve got to hit the prospecting trail.
Option 2 You could ask your salespeople to increase the average opportunity size. You would go back to selected pipeline opportunities and renegotiate larger transactions.
Option 3 You could work with your salespeople and get them to improve the win odds of selected opportunities. What do I mean? You could, for example, where salespeople are not yet at Power, move them to dealing with the Power people. Or you could examine your salespeople’s evaluation plans and improve any weak plans. Or you could improve your buyers’ perceived value.
Option 4 You could work with your salespeople to shorten the length of the sales cycles. For example, for those pipeline opportunities that have not yet reached the Evaluation Plan stage, you could coach your salespeople to shorten their sales cycles. For deals already in the Evaluation Plan stage, you could ask your salespeople to renegotiate the events and their timing.
Whichever option you choose and manage successfully, you now have the ability to look ahead to the end of the year and estimate whether you will make your revenue goals. What is comforting in the example we evaluated is that ten months remain in which to close gaps discovered as of March 1. The forecasting enables a sales manager to avoid the mad scramble of December.
In our workshops, participants learn other things about pipeline opportunity identification and analysis. For example, they learn to analyze whether opportunities are moving through the pipeline consistently. They also learn to determine whether revenue is positioned to close in a particular target quarter. Our sales management system addresses these and other questions.
Coaching
Go back and take a look at the left axis in Figure 15.1, page 247. Since you’ve diagnosed a pipeline—both its aggregate and individual components—you are now in a position to manage by exception. Doing so saves time and money, and management by exception helps keep salespeople focused on what to do first.
When sales managers get into opportunity analysis, they enter the world of coaching. On a short-term basis, a manager ought to be prepared to coach each sales opportunity with the idea of winning the business and, if required (it usually is), be prepared to coach selling skills for long-term performance improvement.
Consistency is the key to good coaching. The sales process gives us consistency by defining the selling activities and the standard for results. Today I find it hard to imagine how to coach effectively without a well-defined sales process. Being a sales process expert and enabling salespeople to see things for themselves are two important aspects of good coaching. In major sporting events, coaches don’t play the game; players do. It should be the same in selling. Unfortunately, too many times sales managers take over the opportunities, and little, if any, coaching, mentoring, or training takes place.
Effective coaching requires sales managers to (1) coach key opportunities based on objective information, not subjective information, and (2) participate in and conduct regularly scheduled training and practice sessions that address selling skill deficiencies as well as reinforce the sales process.
Too many companies and too many sales managers hire experienced salespeople, believing they know how to sell. However, even the very best salespeople need ongoing coaching, mentoring, and training to maintain their peak performance.
Sales Management Job Aids Managers can use two job aids to objectively determine the status of an opportunity and uncover potential salesperson deficiencies: the Key Opportunity Debriefing Guide and the Strength of Sale Check.
The Key Opportunity Debriefing Guide (See Figure 15.4.) This guide can help you track where a salesperson is in his or her execution of the Solution Selling sales process for a specific opportunity. In addition, it provides you, the sales manager, with a list of verifiable outcomes that helps you measure the actual progress of your sales rep’s opportunity.
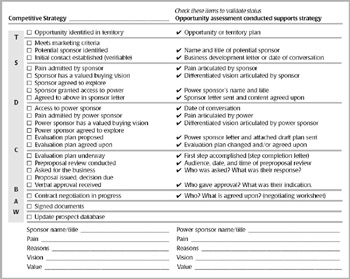
Figure 15.4: Key Opportunity Debriefing Guide
After a brief overview of the selling situation—such as what is being sold and to whom and the opportunity size—the Milestone status code is determined. If, for example, the opportunity is a D, the sales manager should ask to see the Sponsor Letter. A Sponsor Letter is an excellent point of validation. Review it for quality and for the customer’s agreement to the letter.
If no letter exists, this Milestone cannot be validated. Whether verbal or written, you need Sponsor Letters in order to validate the position of the opportunity in the Milestones.
If a Sponsor Letter exists, the manager should review it for six key points—pain, reasons, vision, agreement to explore, bargain for access to power, and proof. In this way, the manager can verify that the appropriate communication has occurred. If the manager is satisfied, then the Milestone is a confirmed D. If not, it is reset to S or T. The manager then discusses how to achieve the next Milestone for that opportunity. This focuses the salesperson on actions that will improve the chances of winning the sale.
Figure 15.5 shows another way you can look at and diagnose a situation where a salesperson is having difficulty moving from one Milestone status to the next.
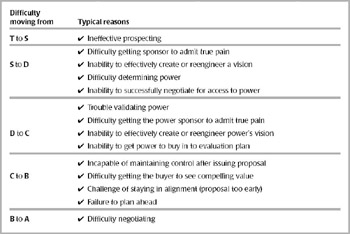
Figure 15.5: Selling Difficulties
There are many selling difficulties—some severely disabling, others not so important. Figure 15.5 is used by a number of sales managers to identify why a salesperson is having difficulty moving from one Milestone to another. For example, if a salesperson is having trouble moving from Milestone D to C, the sales manager should look for (1) trouble validating power, (2) difficulty getting the Power Sponsor to admit true pain, (3) inability to effectively create or reengineer the power person’s vision, or (4) inability to get the power people to buy into an Evaluation Plan.
This opportunity debriefing approach helps determine the true status of the opportunity from a process execution perspective. It gives some insight into how much work and time are required to close the business, but it can be difficult to judge progress well enough to forecast with confidence. Another job aid that can help judge quality of the sale, and the progress through the sales process, is the Strength of Sale Check.
Strength of Sale Check In Chapter Two I introduced the formula for sales success and talked about its five critical elements: Pain, Power, Vision, Value, and Control. Experience has shown us that if we focus our efforts on these five elements, we increase our probability of success. Our job aid, the Strength of Sale Check (Figure 15.6), does three things: mea-sures the five elements, estimates the strength of the opportunity, and determines the remaining effort required to complete the sale.
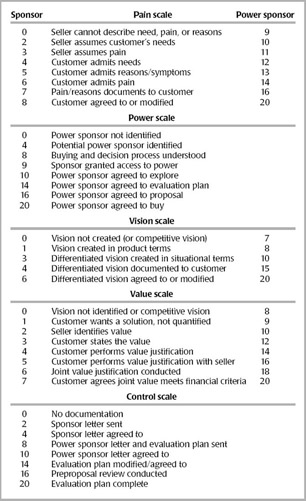
Figure 15.6: Strength of Sale Check
There are different levels of customer commitment in each of these five elements. Putting metrics on each task or step within an element allows you to determine the actual strength of each element, and it also helps you to estimate how long it will take to complete the sale.
If you can attain level 20 for each of these five elements, it means that the sale is imminent and you will almost certainly win the opportunity. As a sales manager, it is frequently difficult to objectively determine the strength of any particular opportunity. This job aid can help you with this difficulty.
FORECASTING
Forecasting is a critically important part of a sales manager’s job. A primary reason for implementing this sales process and sales management system is to improve the accuracy of the sales forecast.
One of the important elements of forecasting is, first, to recognize the sources of revenues that make up the forecast. Next, it’s important to apply an appropriate forecasting method.
In Figure 15.7, Forecast Elements, two different revenue sources and the three forecasting methods that apply to them are identified.
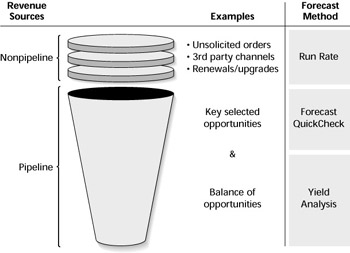
Figure 15.7: Forecast Elements
Revenue Sources
Most people are familiar with the revenue that a sales organization produces from opportunities that are in its traditional pipeline. These include key selected opportunities, often called “must-wins,” and the balance of opportunities that we work on that are more routine. However, these are not all the revenues we need to consider when forecasting. There are also nonpipeline sources, such as through third parties or unsolicited orders.
Forecast Method
As indicated in Figure 15.7, there are three forecast methods: Run Rate, Forecast QuickCheck, and Yield Analysis.
Run Rate What does this mean? It means using the historical financial performance or revenue results of a company’s or unit’s nonpipeline revenue (for example, annuity income) and extrapolating it into the future. For example, some software companies take their renewing software licenses for a given accounting period and extrapolate them into the future. They call it their run rate.
So, there are nonpipeline sources of revenue that never hit the pipeline. As you can see from Figure 15.7, unsolicited orders, third-party distribution channels, and product/services renewals and upgrades all make up nonpipeline revenue. Although these may not be revenue sources that the organization manages through the sales process, they still need to be forecast. So when I talk about your Run Rate, I’m asking you about your nonpipeline revenue.
In the context of extrapolating future performance, the run rate helps put the company’s or business unit’s latest results in perspective. For example, if in its first quarter a company had nonpipeline revenues of $10 million, the sales manager might say, “Our latest quarter puts us at a $40 million run rate for the year for nonpipeline opportunities.” What this means is that if the business unit were to perform at the same level for the next year, it would have nonpipeline revenues of $40 million annually.
A word of caution: you have to be careful using a run rate, because certain variables can affect it, like seasonal industries. A great example of this is a retailer after the Christmas holiday. Almost all retailers experience higher sales during the holiday season. It’s unlikely that the coming quarters will have sales as strong as in the fourth quarter, and so the run rate would likely overstate the following quarters and, subsequently, next year’s revenue if such seasonality is not considered.
Forecast QuickCheck Here you want to focus on your key opportunities, which can include (1) big opportunities and (2) the strategic opportunities important to your business—usually where you have the best chance of winning. For these we combine the five elements of the formula for sales success (Pain, Power, Vision, Value, and Control) with the Forecast QuickCheck method.
This method establishes measurable guidelines that become forecast thresholds using the five elements. We use the same 20-point scale for each of the five elements discussed earlier in the Strength of Sale Check.
Figure 15.8 illustrates how you can get a Forecast QuickCheck. You are trying to forecast the likelihood of closing a specific key opportunity in any particular given time period.
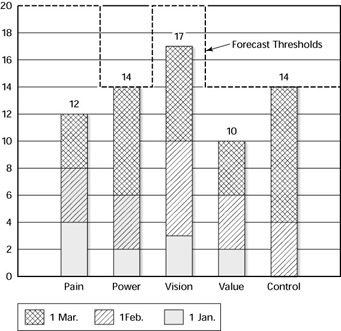
Figure 15.8: Forecast QuickCheck
If the opportunity doesn’t have all the five elements at the predetermined forecast thresholds, then the opportunity is not likely to close during the forecast period. On the success side of the ledger, your forecast will include those key opportunities that meet or exceed the predetermined forecast thresholds. Those below the thresholds will not be included. This allows you to communicate quickly and easily with all interested parties about the strength and predictability of a key opportunity. Thus, the Forecast QuickCheck analyzes a simple set of variables that provide a basis for forecast discussions.
Note that the thresholds may also be different depending on when the forecast is being made. For example, a forecast done at the beginning of a quarter will have a different threshold from one done one week before the quarter ends. Each selling organization must establish the right set of thresholds for its own forecasting environment.
Yield Analysis This is business as usual—the grading of your normal pipeline opportunities. Recall that yield is the expected revenue from a collection of opportunities in the pipeline. Yield represents the total revenue by Milestone multiplied by the win odds or probability.
This method is based on the Solution Selling Milestone probabilities. (You learned about Milestones earlier in this chapter and in Chapter Fourteen.) The key to good forecasting rests on accurate Milestone grading and validation of where each opportunity is in its Milestone status.
GETTING STARTED WITH THE SALES MANAGEMENT SYSTEM
I’ve covered a lot of ground in this chapter, and if you’re like most people, you’re probably asking yourself, How do I get started? We originally thought we should start with pipeline analysis. We encouraged clients to analyze their pipelines. That seemed logical. That’s the way most managers would start. Once that was completed and operating, people could begin to manage pipeline opportunities. The objective was correct. Start with pipeline analysis, identify problem opportunities, and deal with the exceptions. It sounded great, but most clients discovered they were going in the wrong direction.
This approach assumes that there is good data in the pipeline—and this is usually wrong. The reality is that there usually isn’t good data in the pipeline. It’s badly flawed. So, it turned out to be a wrong assumption.
Here’s my recommendation. Instead, start the sales management process by working with your salespeople and help them to use the pipeline Milestones, to grade their pipeline opportunities—opportunity by opportunity. You want to ensure the quality of the sales information. If you do that, then pipeline analysis will work, because it’s based on fact, not opinion.
Recommendations for Getting Started
- Ask each salesperson to complete the Pipeline Milestones Worksheet
- Debrief pain, reasons, buying visions, and next step with each key opportunity
- Ask salespeople to convert current key opportunities to C status
- Participate in refocus calls (conference calls or face to face) on key opportunities
- Review and edit Sponsor and Power Sponsor Letters before they are sent
- Schedule role-play sessions with each salesperson within the next two weeks
- Using the Milestones, regrade all opportunities and determine the actual health of your pipeline
- Build the pipeline to a level that will enable you to achieve your sales goals
What is the biggest reason that most managers fail to implement a winning sales process and sales management system? I’m reminded of the story of the lumberjack chopping down a tree. It goes something like this: A lumberjack is furiously chopping at a tree with a dull ax. Another lumberjack asks, “Why don’t you sharpen your ax?” The lumberjack growls, “Can’t you see I’m busy chopping down this tree?” Like the lumberjack, too many managers don’t follow through because they’re busy and everything seems to be working.
If you’re a sales manager who’s achieving your revenue goals, consistently forecasting accurately, and you have all Eagle salespeople, then you probably don’t need to change. On the other hand, if all three of these criteria for successful sales management aren’t where they need to be, then give the Solution Selling sales process and sales management system a try.
Part One - Solution Selling Concepts
Part Two - Creating New Opportunities
- Chapter Four Precall Planning and Research
- Chapter Five Stimulating Interest
- Chapter Six Defining Pain or Critical Business Issue
- Chapter Seven Diagnose Before You Prescribe
- Chapter Eight Creating Visions Biased to Your Solution
Part Three - Engaging in Active Opportunities
Part Four - Qualify, Control, Close
- Chapter Eleven Gaining Access to People with Power
- Chapter Twelve Controlling the Buying Process
- Chapter Thirteen Closing: Reaching Final Agreement
Part Five - Managing the Process
EAN: N/A
Pages: 106
