Appendix A Value Justification Example
The following value justification is an example constructed around the fictitious company referenced throughout this book, Titan Games, Inc. (TGI). A short review of TGI follows.
TGI s CURRENT ENVIRONMENT
TGI is a twenty-year-old organization that manufactures and distributes educational and recreational games and toys throughout the world. TGI has suffered a decline in overall profits—its primary critical business issue. Three primary reasons are identified for this problem of declining profits: (1) the VP Sales is unable to meet new account revenue targets (2) there are increasing credit write-offs and (3) operational costs are rising. All this affects and concerns the VP Finance, who has watched profits decline for two consecutive quarters. He needs the VP Sales to turn this bad news around.
New account revenues were supposed to contribute 20 percent of TGI’s overall sales revenues. Only half of that goal will be realized. The VP Sales feels his salespeople spend too much time servicing existing customers instead of selling to new ones. Further, rising operational costs are mostly attributed to TGI’s growing customer service staff. They are needed to handle an increasing volume of customer calls for help. Also, credit write-offs are partially due to shipping games and toys to delinquent, bad-pay accounts. So what follows is an analysis of the important components necessary for creating a good value justification.
VALUE JUSTIFICATION ELEMENTS
- What elements of the customer’s business will be impacted and measured?
- Who is responsible for the changes within the impacted areas?
- How much impact and value is possible over what period of time?
- What capabilities will be needed?
- When will the investment pay for itself?
What Elements of the Customer s Business Will Be Impacted and Measured?
|
Increased profit |
From additional sales revenue |
|
Increased revenue |
From new account sales and current account sales |
|
Reduced cost |
From reduction in the amount of credit write-offs |
|
Avoided cost |
From the traditional hiring of one CSR per quarter |
Who Is Responsible for the Changes Within the Impacted Areas?
|
Additional sales revenue from new accounts |
VP Sales |
|
Additional sales revenue from current accounts |
VP Sales |
|
Reduced cost associated with credit write-offs |
VP Finance |
|
Avoided cost associated with hiring CSRs |
VP Finance |
How Much Impact and Value Is Possible and over What Period of Time?
This part of value justification illustrates how much quantifiable value each element in your solution can hope to realize. See Figure A.1 for a detailed view of the benefits.
|
Increased revenue |
5% more selling time per salespeople |
= $4M |
|
Average 1 new account per rep |
= $3M |
|
|
Broadcast of personalized promotions |
= $2M |
|
|
Prompt customers for referrals |
= $2M |
|
|
Reduced cost |
50% credit write-off reduction |
= $400K |
|
Avoided cost |
Avoid hiring 1 CSR pre quarter |
= $130K |
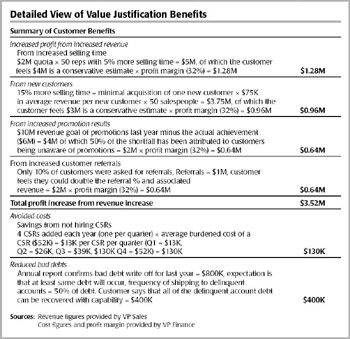
Figure A.1: Detailed View of Value Justification Benefits
These figures represent the possible value over a one-year period
What Capabilities Will Be Needed?
Articulation of the Corporate Buying Vision. See Figure A.2 for a detailed view of the customer investment required to obtain these capabilities.
For Steve Jones:
- IF salespeople spent more time prospecting into new accounts instead of taking repeat order from existing clients, and
- IF salespeople spent more time prospecting into new accounts instead of responding to frequently asked questions by the customer, and
- IF prospects could be made aware of all promotions, and
- IF every customer would be asked for referrals in exchange for discounts,
THEN Steve Jones (VP Sales) could meet his new account revenue targets, also . . .
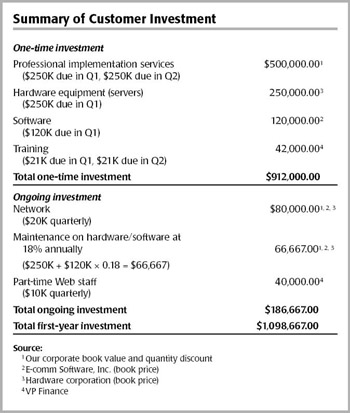
Figure A.2: Detailed View of Value Justification Investment
For Jim Smith:
- IF Steve Jones could meet his new account revenue targets, and
- IF customers could utilize frequently asked questions menus instead of calling customer service, and
- If delinquent customers were connected to accounting during their order process
THEN Jim Smith (VP Finance) could meet his profitability goals
For Susan Brown:
- If Jim Smith (VP Finance) can meet his profit goals
THEN Susan Brown (CEO) feels that she can better meet her earnings per share target.
When Will the Investment Pay for Itself?
Whether buyers “see” the value of your solution depends on whether it falls within a time period they find acceptable. For example, if they see themselves realizing an agreed-on return on investment soon enough for them to solve their problem, then that can create a compelling reason to take action. If, however, their perceived value happens too far out into the future, they may be discouraged and make a “no decision” or choose to invest the funds elsewhere.
Benefits of cost reduction can be seen immediately in the first quarter due to the avoidance of hiring additional customer service representatives. Because the revenue benefits will “ramp up” fully after one year, only partial benefits should be expected in the second and third quarters, with full benefits being recognized in the fourth quarter. The breakeven point, where return outweighs investment, will be achieved early in the fourth quarter.
So, when the investment will pay for itself becomes an important understanding for you and your buyer to mutually agree on.
Value Justification
Figure A.3 is a summary spreadsheet that answers three primary questions that buyers will have: (1) What is the first year net return? (2)
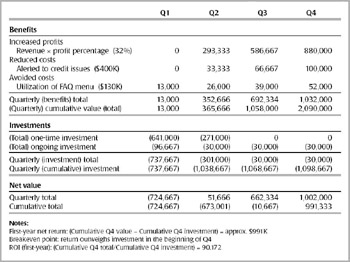
Figure A.3: Value Justification (ROI)—Example
What is their investment’s breakeven point? (3) What is their return on investment (ROI)? For this sample summary, we have not taken into account more involved elements of value analysis such as discounted cash flow, internal rates of return, and so on. This sample summary is intended to focus primarily on the comparison of benefits against investment over a given time period. Note: revenue and cost benefits do not all show maximum return until Q4.
The First Year Net Return TGI's first year cumulative net return of $2.1 million on their cumulative investment of $1.1 million is about $991 thousand.
There is an annual $991 thousand net return. TGI gets back its investment of $1.1 million by the beginning of the fourth quarter.
Return on Investment (ROI) TGI should realize a one-year ROI of 90.2 percent on their investment in the solution.
IMPLEMENTATION PLANS AND VALUE
Note: The Implementation Plan provides the customer with a visual bridge of how they are going to transition from the current state of business to the desired status. In Figure A.4 you will see what the postpurchase part of an evaluation looks like. This includes ongoing (mutual) Success Criteria to be measured (see Figure A.5).
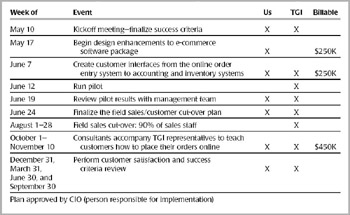
Figure A.4: Implementation Plan—Example
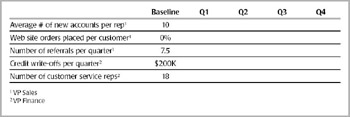
Figure A.5: Success Criteria—Example
Part One - Solution Selling Concepts
Part Two - Creating New Opportunities
- Chapter Four Precall Planning and Research
- Chapter Five Stimulating Interest
- Chapter Six Defining Pain or Critical Business Issue
- Chapter Seven Diagnose Before You Prescribe
- Chapter Eight Creating Visions Biased to Your Solution
Part Three - Engaging in Active Opportunities
Part Four - Qualify, Control, Close
- Chapter Eleven Gaining Access to People with Power
- Chapter Twelve Controlling the Buying Process
- Chapter Thirteen Closing: Reaching Final Agreement
Part Five - Managing the Process
EAN: N/A
Pages: 106
