Section 14.2. Using KGDB for Kernel Debugging
14.2. Using KGDB for Kernel DebuggingTwo popular methods enable symbolic source-level debugging within the Linux kernel:
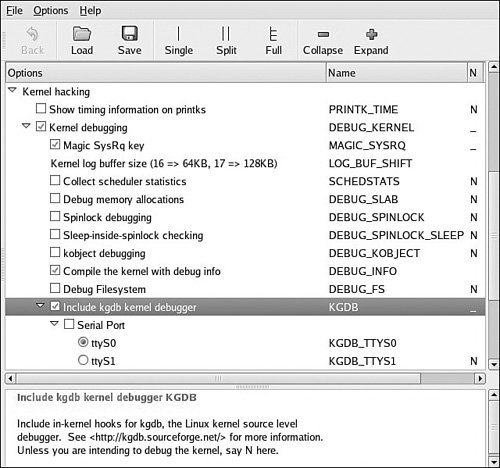
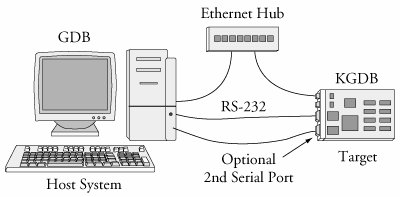
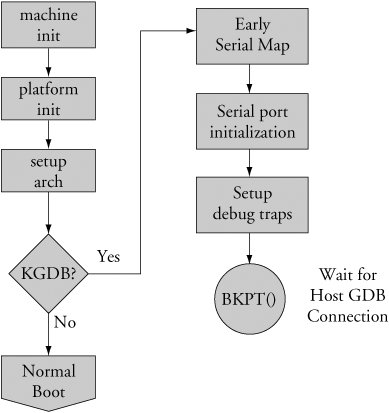
We cover JTAG debugging in Section 14.4, "Hardware-Assisted Debugging." KGDB (Kernel GDB) is a set of Linux kernel patches that provide an interface to gdb via its remote serial protocol. KGDB implements a gdb stub that communicates to a cross-gdb running on your host development workstation. Until very recently, KGDB on the target required a serial connection to the development host. Some targets support KGDB connection via Ethernet, although this is relatively new. Complete support for KGDB is still not in the mainline kernel.org kernel. You need to port KGDB to your chosen target or obtain an embedded Linux distribution for your chosen architecture and platform that contains KGDB support. Most embedded Linux distributions available today support KGDB. Figure 14-1 describes the KGDB debug setup. Up to three connections to the target board are used. Ethernet is used to enable NFS root mount and telnet sessions from the host. If your board has a ramdisk image in Flash that it mounts as a root file system, you can eliminate the Ethernet connection. Figure 14-1. KGDB debug setup A serial port is dedicated for the connection between KGBD and gdb running on the development host system, and an optional second serial port serves as a console. Systems that have only one serial port make KGDB somewhat more cumbersome to use. As you can see in Figure 14-1, the debugger (your cross-version of gdb) runs on your development host system. KGDB is part of the kernel running on your target system. KGDB implements the hooks required to interface gdb with your target board to enable features such as setting breakpoints, examining memory, and enabling single-step program execution. 14.2.1. KGDB Kernel ConfigurationKGDB is a kernel feature and must be enabled in your kernel. KGDB is selected from the Kernel Hacking menu, as shown in Figure 14-2. As part of the configuration, you must select the serial port for KGDB to use. Notice also from Figure 14-2 that we enabled the option to compile the kernel with debug information. This adds the -g compiler flag to the build process to enable symbolic debugging. Figure 14-2. Kernel configuration for KGDB 14.2.2. Target Boot with KGDB SupportAfter your kernel is built with KGDB support, it must be enabled. Unfortunately, the method to enable it is not yet uniform across all architectures and implementations. In general, KGDB is enabled by passing a command line switch to the kernel via the kernel command line. If KGDB support is compiled into the kernel but not enabled via a command line switch, it does nothing. When KGDB is enabled, the kernel stops at a KGDB-enabled breakpoint very early in the boot cycle to allow you to connect to the target using gdb. Figure 14-3 shows the logic for generating an initial breakpoint when KGDB is enabled. Figure 14-3. KGDB logic KGDB requires a serial port for connection to the host.[3] The first step in setting up KGDB is to enable a serial port very early in the boot process. In many architectures, the hardware UART must be mapped into kernel memory before access. After the address range is mapped, the serial port is initialized. Debug trap handlers are installed to allow processor exceptions to trap into the debugger.
Listing 14-1 displays the terminal output when booting with KGDB enabled. This example is based on the AMCC 440EP Evaluation Kit (Yosemite board), which ships with the U-Boot bootloader. Listing 14-1. Booting with KGDB Enabled Using U-Boot
Most of the boot sequence is familiar from our coverage of U-Boot in Chapter 7, "Bootloaders." This kernel boot sequence has two unique features: the command-line parameter to enable KGDB and the odd-looking text string after the kernel is uncompressed. Recall from Chapter 7 that the kernel command line is defined by the U-Boot bootargs environment variable. Notice that we have added the gdb parameter, which instructs the kernel to force an early breakpoint and wait for the host debugger (your cross-gdb) to connect. As diagrammed in Figure 14-3, the kernel detects the presence of the gdb parameter and attempts to pass control to the remote (host-based) debugger. This is evidenced by the sequence of ASCII characters dumped to the serial port in Listing 14-1. If you are curious about this gdb remote serial protocol, it is documented in the gdb manual cited at the end of this chapter. In this example, KGDB is sending a Stop Reply packet reporting the breakpoint trap to the remote gdb session on the host. The two 32-bit parameters indicate the location of the program and the stack frame. Now that the kernel is set up and waiting for the host debugger, we can begin our debugging session. We invoke cross-gdb from our host development workstation and connect to the target via gdb's remote protocol. In this example, we are sharing the serial port, so we must disconnect the terminal emulator from the target before trying to connect with gdb. Listing 14-2 highlights the gdb connection process. This assumes that we have already exited our terminal emulator and freed the serial port for gdb to use. Listing 14-2. Connecting to KGDB
Here we have performed three actions:
At the risk of pointing out the obvious, the vmlinux image that we pass to gdb must be from the same kernel build that produced the target kernel binary. It also must have been compiled with the -g compiler flag to contain debug information. When we issued the target remote command, gdb responded by displaying the location of the program counter (PC). In this example, the kernel is stopped at the breakpoint defined by the inline assembler statement at line 823 in file .../arch/ppc/kernel/ppc-stub.c. When we issue the continue (c) command, execution resumes starting at line 825, as indicated. 14.2.3. Useful Kernel BreakpointsWe have now established a debug connection with the kernel on our target board. When we issue the gdb continue (c) command, the kernel proceeds to boot, and if there are no problems, the boot process completes. There is one minor limitation of using KGDB on many architectures and processors. An engineering trade-off was made between the need to support very early kernel debugging (for example, before a full-blown interrupt-driven serial port driver is installed) and the desire to keep the complexity of the KGDB debug engine itself very simple and, therefore, robust and portable. KGDB uses a simple polled serial driver that has zero overhead when the kernel is running. As a drawback to this implementation, the traditional Ctl-C or Break sequence on the serial port will have no effect. Therefore, it will be impossible to stop execution of the running kernel unless a breakpoint or other fault is encountered. For this reason, it has become common practice to define some system-wide breakpoints, which provide the capability to halt the current thread of execution. Two of the most common are highlighted in Listing 14-3. Listing 14-3. Common Kernel Breakpoints
Using the gdb breakpoint command, again using its abbreviated version, we enter two breakpoints. One is at panic() and the other is at the sync system call entry sys_sync(). The former allows the debugger to be invoked if a later event generates a panic. This enables examination of the system state at the time of the panic. The second is a useful way to halt the kernel and trap into the debugger from user space by entering the sync command from a terminal running on your target hardware. We are now ready to proceed with our debugging session. We have a KGDB-enabled kernel running on our target, paused at a KGDB-defined early breakpoint. We established a connection to the target with our host-based cross debuggerin this case, invoked as ppc_4xx-gdband we have entered a pair of useful system breakpoints. Now we can direct our debugging activities to the task at hand. One caveat: By definition, we cannot use KGDB for stepping through code before the breakpoint() function in .../arch/ppc/setup.c used to establish the connection between a KGDB-enabled kernel and cross-gdb on our host. Figure 14-3 is a rough guide to the code that executes before KGDB gains control. Debugging this early code requires the use of a hardware-assisted debug probe. We cover this topic shortly in Section 14.4, "Hardware-Assisted Debugging." |
EAN: 2147483647
Pages: 167

