II - Physiology of the Lungs
Editors: Shields, Thomas W.; LoCicero, Joseph; Ponn, Ronald B.; Rusch, Valerie W.
Title: General Thoracic Surgery, 6th Edition
Copyright 2005 Lippincott Williams & Wilkins
> Table of Contents > Volume I - The Lung, Pleura, Diaphragm, and Chest Wall > Section III - Thoracic Imaging > Chapter 9 - Radiographic Evaluation of the Lungs and Chest
function show_scrollbar() {}
Chapter 9
Radiographic Evaluation of the Lungs and Chest
Anne Mcb Curtis
Wallace T. Miller Jr.
For the physician interested in diseases of the chest, chest radiography is of paramount importance in detecting a disease process and providing clues as to the etiology.
ROUTINE EXAMINATION
Two views of the thorax are needed to provide a three-dimensional view of the chest: posteroanterior (PA) and lateral projections.
High-kilovoltage technique is now generally accepted practice. This technique involves the use of x-rays at the 129-kV (peak) range with a fine-line grid, which increases the information on the radiograph by providing less contrast but more penetration. Information about the mediastinum and retrocardiac areas is increased compared with films taken at a lower kilovoltage. This high-kilovoltage technique decreases exposure time and minimizes motion. Ideally, chest films should be performed on a dedicated chest radiographic unit, allowing for the best and most consistent technique.
If the high-kilovoltage technique for standard films is not available, a grid radiograph with higher kilovoltage, higher milliamperage, or both, and a fixed or moving grid allow better visualization of the mediastinum and lesions behind the heart and diaphragm. This technique, however, is not optimal for imaging of the pulmonary parenchyma (Fig. 9-1).
The lateral radiograph is of considerable importance in the routine examination of the chest because some lesions in the chest are apparent only in the lateral view. Examples include small mediastinal lesions, some masses in the anteromedial portions of the lung adjacent to the mediastinum (Fig. 9-2), lesions in the vertebral column, lesions behind the heart and diaphragm on the PA view, and small pleural effusions. For routine screening films, in the absence of apparent chest disease, Sagel and associates (1974) found that a lateral view may not be indicated because the yield of information is low. However, lesions may be easier to recognize on a lateral film and, in retrospect, may be visible on the frontal projection.
SUPPLEMENTARY RADIOGRAPHIC VIEWS
Occasionally, other views may be added to the PA and lateral examination to confirm the parenchymal origin of a lesion. These include shallow (5-degree) oblique views. In the shallow oblique projections, the patient is rotated slightly, about 5 degrees to the right and left. The slight change in position of the patient between the two films allows separation of overlapping structures that have produced a confluence of shadows or pseudonodule, whereas a parenchymal nodule is seen in both positions (Fig. 9-3). Similar additional views may be obtained in the lateral position. Of course, computed tomography (CT) can clarify whether a nodule is seen. However, if CT is not readily available or if expense is a consideration, the oblique technique may be useful.
It is helpful when examining oblique radiographs to remember that posteriorly placed lesions in the lung maintain a constant relationship with the spine, and anteriorly placed lesions in the lung maintain a constant relationship with the heart.
Fig. 9-4 demonstrates some of the normal anatomic structures seen on the oblique radiograph. Note that these are not shallow obliques.
The lordotic and reverse lordotic views are based on the same principles as the shallow oblique views: a change in position separates overlapping structures. These views are used frequently in evaluation of the pulmonary apices in which lesions may be obscured by overlying ribs and clavicles in the PA projection. In the lordotic view, anteriorly placed lesions appear to move upward, and those located posteriorly move downward (Fig. 9-5). A full chest lordotic
P.116
view demonstrates middle lobe collapse or consolidation if a lateral film is not obtainable.
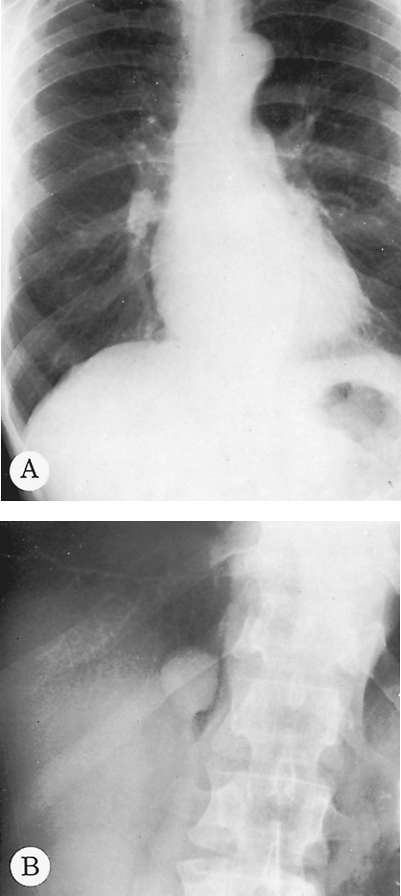 |
Fig. 9-1. Pulmonary granuloma. A. The routine PA radiograph at a low-kilovoltage technique appears normal. B. An overpenetrated grid radiograph demonstrates a pulmonary nodule in the right lung seen through the right hemidiaphragm. |
Lateral decubitus radiographs are extremely important in the investigation of suspected pleural effusion or of air fluid levels in pulmonary or pleural cavities. The decubitus radiograph is made with the x-ray beam projected in a horizontal plane and the patient lying on his or her side. In a left lateral decubitus view, the patient lies on the left side, and free pleural fluid forms a layer along the left lateral chest wall (Fig. 9-6). Amounts of fluid as small as 50 to 100 mL can be identified in the lateral decubitus position. If a pneumothorax is present and the examination is being made to investigate the air-outlined pleura, the x-ray beam should be centered on the elevated rather than the recumbent side of the patient. If effusion and pneumothorax, hydropneumothorax, are present, an air fluid level is seen on the lateral decubitus projection.
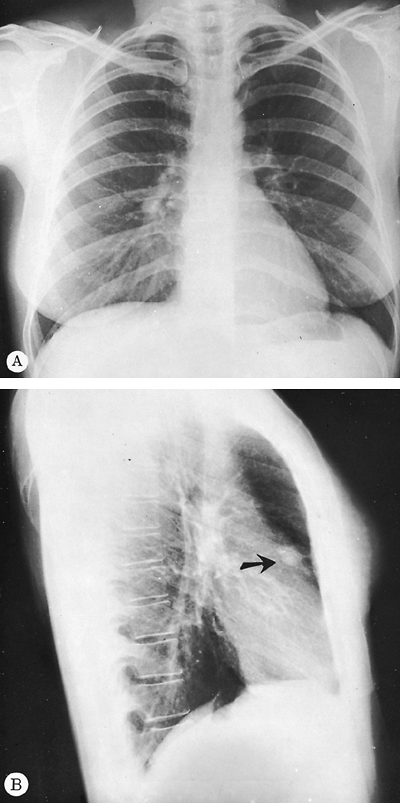 |
Fig. 9-2. Carcinoma of the lung. A. The PA radiograph demonstrates a subtle increase in density at the inferior portion of the right hilum that would probably be unobserved without the lateral film. B. The lateral view demonstrates an obvious retrosternal abnormality (arrow). The mass was in the right upper lobe and was a primary lung cancer. |
It is critical to remember that a fluid level, and particularly an air fluid level, is not visible unless the beam is in a horizontal projection, regardless of the patient's position;
P.117
the beam must be tangential to the fluid or air fluid interface. With the patient in a supine position with a vertical beam or in a semierect position with a nonhorizontal beam, the air fluid level is not visualized (Figs. 9-7 and 9-8).
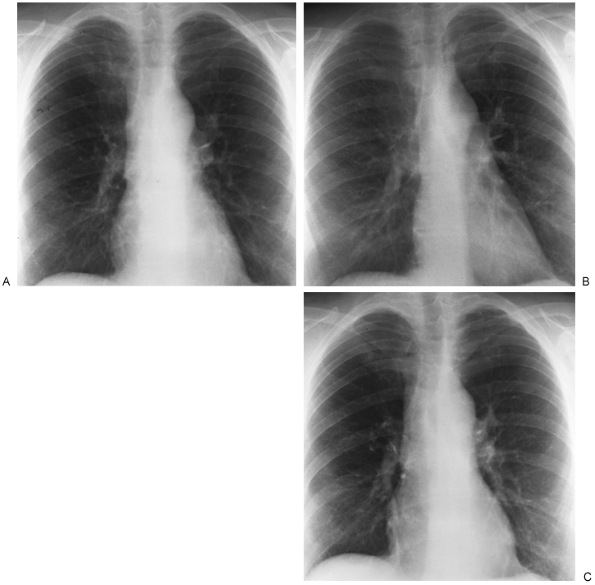 |
Fig. 9-3. PA (A) and shallow oblique (B, C) views. A nodule was questioned behind the right anterior second rib and in the fourth to fifth intercostal space posteriorly. On oblique views, no nodule is appreciated. |
Lateral decubitus views are useful also when air trapping is suspected, usually when an inhaled endobronchial foreign body is suspected. Normally, the dependent lung decreases in size (see Fig. 9-6). With bronchial obstruction, the obstructed lung fails to decrease in size when placed in the dependent or downside position (Fig. 9-9). Both decubitus views are helpful for comparison if available. In small children, the decubitus views are the easiest way to evaluate for possible foreign body aspiration.
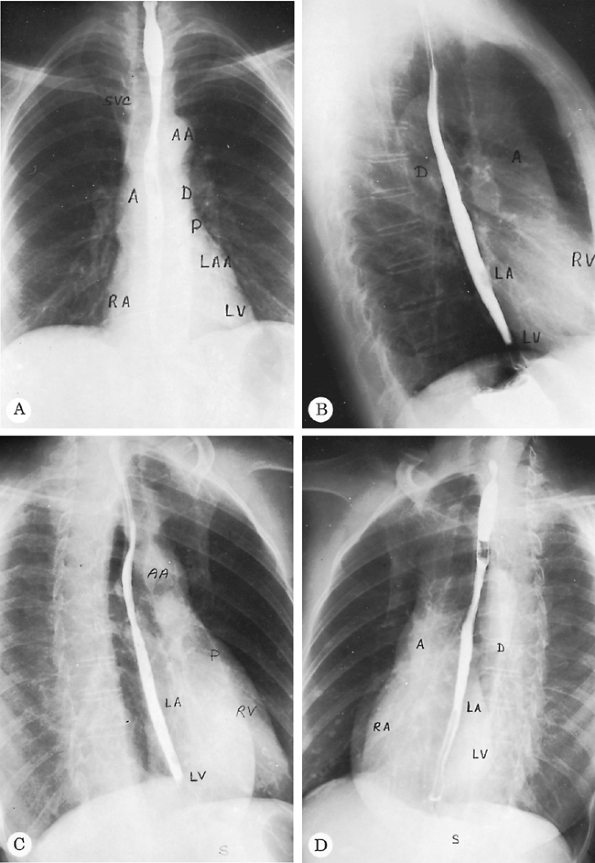 |
Fig. 9-4. Normal PA (A), lateral (B), right anterior oblique (C), and left anterior oblique (D) radiographs. A, ascending aorta; AA, aortic arch; D, descending aorta; LA, left atrium; LAA, left atrial appendage; LV, left ventricle; P, main pulmonary artery; RA, right atrium; RV, right ventricle; S, stomach; SVC, superior vena cava. Barium is in the esophagus. |
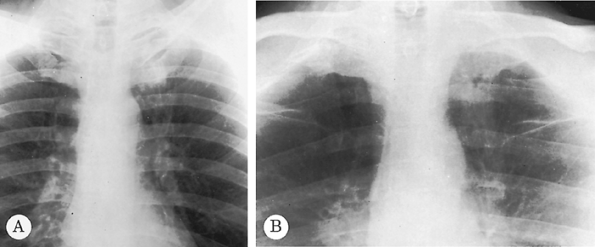 |
Fig. 9-5. Carcinoma of the lung. A subtle increase in density is seen to the left anterior first rib in comparison with the right, which raises suspicion of a mass on the PA radiograph (A). An apical lordotic view (B) demonstrates a definite mass in the left apex below the left first rib. Note asymmetry when compared with the right apex. |
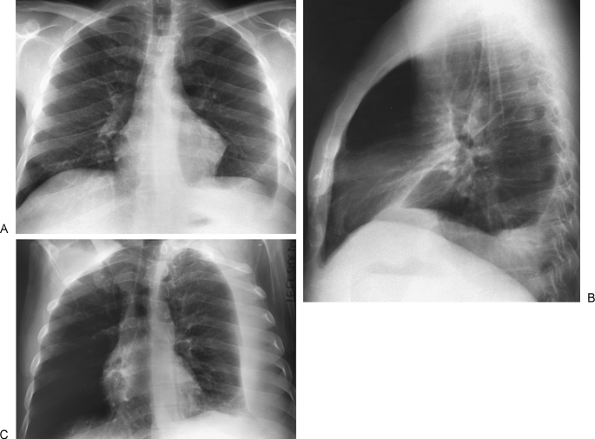 |
Fig. 9-6. Pleural effusion. PA (A) and lateral (B) views demonstrate blunting of the left costophrenic angle. Left lateral decubitus view (C) demonstrates a large layering pleural effusion against the left chest wall. Note on the posteroanterior view (A) the increased distance between gastric bubble and left hemidiaphragm (compare with Fig. 9-2A), indicating a subpulmonic component of the pleural fluid. |
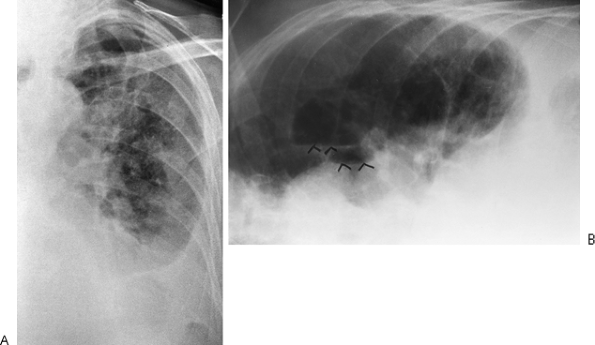 |
Fig. 9-7. Pyopneumothorax. A. No air fluid level is seen on the PA supine view. B. Left lateral decubitus radiograph with horizontal projection of the x-ray beam shows multiple air fluid levels (arrowheads) consistent with unsuspected empyema and pneumothorax. |
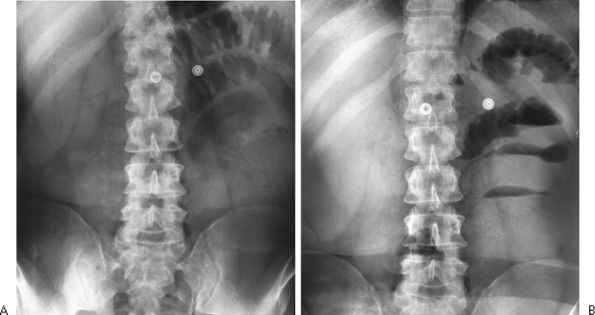 |
Fig. 9-8. Air fluid levels. A. Supine abdomen demonstrates a few dilated loops of bowel in the left upper quadrant. B. With the erect position and a horizontal beam, multiple air fluid levels are identified, indicating small bowel obstruction. |
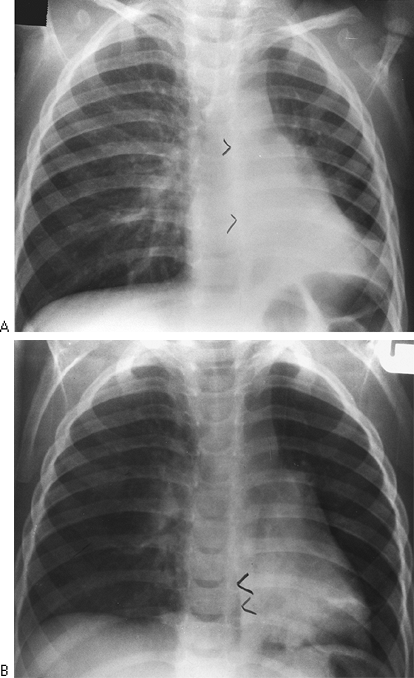 |
Fig. 9-9. Obstructed right main-stem bronchus form inhaledpeanut.A Erect PA radiograph demonstrates sign of air traping with shift of the mediastinum and the azygoesophageal (AE)recess to the left (arrowheads) B. Aright lateraldecubitus viwe shows no collapse of right lung and persistent shift to the left (arowheads) indicating airway obstruction (compare with Fig. 9-6). |
P.118
P.119
P.120
P.121
An expiratory chest radiograph may also be helpful in assessing pulmonary air trapping, either local or diffuse. A foreign body usually results in an emphysematous lobe or lung so that, on the expiratory radiograph, the mediastinum shifts to the side opposite the foreign body or obstructed bronchus. Fluoroscopy also demonstrates the mediastinal shift with air trapping. The expiratory radiograph is also useful in investigating a suspected pneumothorax that may be poorly visualized with routine inspiration. The pneumothorax is better demonstrated with expiration because the volume of air in the lungs decreases, whereas that in the pleural space remains the same. In addition, contrast between the pleural air and the collapsed lung is increased as the lung becomes denser in expiration.
A supine radiograph is made when the patient is unable to sit or stand and is the routine projection for infants. Intensive care unit radiology is done primarily with patients in the supine position. Limitations of imaging imposed by the medical conditions of the patients, as well as the portable imaging modality, require meticulous technique. Tocino (1996) noted that a supine position is preferred to the semierect position for reproducibility of technique from day to day. When possible, all foreign objects that are superimposed on the patient should be removed to avoid confusion. Milne (1986) cautioned that the interpretation of the supine radiograph should take into consideration the magnification of the cardiomediastinal structures as a result of the anteroposterior projection. The supine position also results in engorgement of mediastinal veins, producing mediastinal widening and increasing the upper lobe pulmonary vessels. This should not be confused with the vascular engorgement of congestive failure. Milne (1986) described the vascular
P.122
pedicle as an indicator of fluid overload status. The pedicle is measured on the supine film as the sum of the distances to the midline of the superior vena cava as it crosses the right main-stem bronchus and the left subclavian artery where it arises from the aorta. A width of 70 mm or more correlates with fluid overload. In addition, a cardiothoracic ratio of 55 also correlates with volume status. Ely and associates (2001) reported that both of these measurements correlate better than subjective assessment of volume status, particularly when dealing with complex pulmonary problems, such as adult respiratory distress syndrome (ARDS).
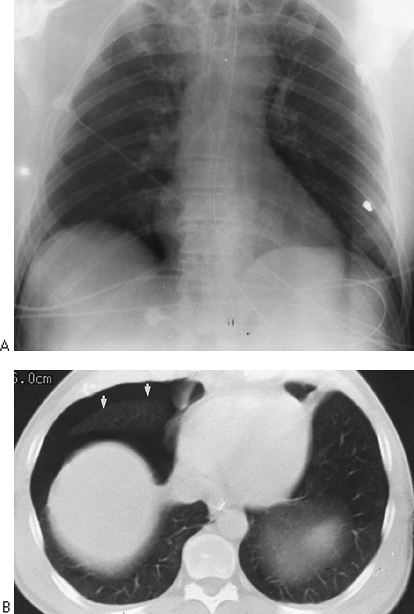 |
Fig. 9-10. Pneumothorax on supine films. A. The right costophrenic angle is deeper and more lucent than the left as a result of anterior location of pleural air in the supine position. B. CT scan confirms location anteriorly (arrows). |
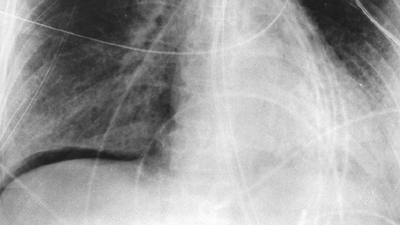 |
Fig. 9-11. Subpulmonic pneumothorax on supine film. Intrapleural air outlines base of right lung. |
Both pleural effusions and pneumothoraces distribute differently in the thorax when the patient is in a supine position, as demonstrated by Tocino and Westcott (1996). Added lucency may be seen anteromedially and laterally above the hemidiaphragms with a supine pneumothorax. The anterolateral location of a pneumothorax results in asymmetric costophrenic angles (deep sulcus sign) (Fig. 9-10). Pleural air also may be seen beneath the lung in a subpulmonic location (Fig. 9-11). In the supine position, pleural effusions may redistribute from the costophrenic angles to the apices of the thorax (Fig. 9-12). If the presence of a pneumothorax is not obvious but is suspected, a lateral decubitus film should be done with attention to the up side.
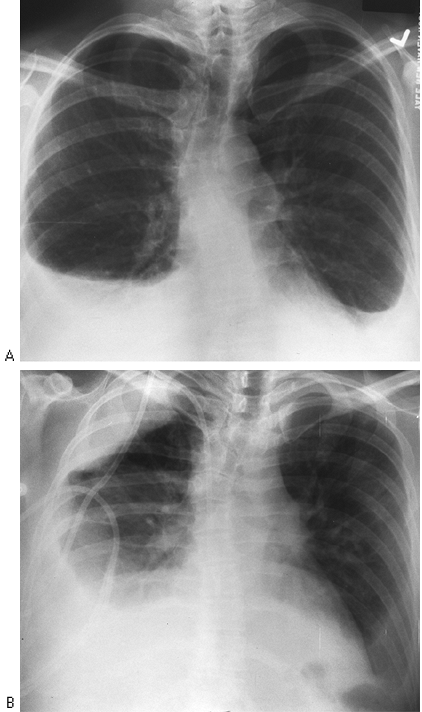 |
Fig. 9-12. Pleural effusion on erect (A) and supine (B) films. Fluid layers over right apex from the right costophrenic angle when patient is supine. |
DIGITAL RADIOGRAPHY
Digital radiography was initially used for portable images, particularly those in the intensive care unit, as noted in the Seminars in Roentgenology edited by one of us (WTM) and Freedman (1997) and by Hartman (1997), as well as by Freedman and Artz (1997). It is a technique in which storage systems other than film are used to record the radiographic image. The most widely used is the photostimulable phosphor plate storage system. When the phosphor plate is radiated, energy is stored in the form of trapped electrons. When the phosphor plate is scanned with laser light, visible light is emitted, and the analog signal is converted to a digital signal for further analysis. As Ravin and Chotas (1997) noted, digital image receptors have a wide range of sensitivity and a linear response to radiation over that range. The detected image is therefore less dependent on the exposure level. This decreases the need for repeat radiography.
The acquisition, archiving, processing, and transmission of digital images has a major impact on the practice of radiology and on availability to clinicans of the radiographic images. The advantages of digital storage of images versus film-based storage are myriad. First and foremost, films cannot be lost. Retrieval of prior films is rapid. Image processing of soft copy allows selective visualization of mediastinal tubes and catheters in one window and lung parenchyma in another. Schaefer and colleagues (1989)
P.123
demonstrated improved visibility of these structures in comparison with standard film-screen combinations. This is also advantageous in the intensive care unit when looking for tubes and catheters. Reported turnaround time is markedly decreased, again improving patient care.
Image processing also can enhance noise. This may decrease conspicuity of low-contrast objects, such as nodules with hazy margins. In addition, patients may seem to have interstitial lung disease if edge enhancement is overused. One has to allow for a learning curve when working initially with computed radiography as compared with film-screen images.
COMPUTED TOMOGRAPHY
Computed tomography has changed markedly since it was introduced in the 1970s, both in improved image quality and in the development of slip-ring gantry technology that eliminates the need for electric cables and allows continuous rotation of the gantry for data acquisition. Spiral-helical CT (volumetric data acquisition) has significant advantages over conventional CT as described by Leung (1997). Multidetector CT, in which there are multiple detectors, combines high-resolution imaging with increased scanning speed. The thorax can be imaged in a single breath-hold, which decreases respiratory misregistration of lesions and minimizes motion artifacts, as pointed out by Rydberg and associates (2003) and Ravenel and McAdams (2003). Images may be displayed in the conventional fashion or in a multiplanar or three-dimensional mode. Nonionic contrast with increased speed of injection, efficient use of scanning time, overlapping reconstructions, and decreased reconstruction time are also significant developments according to Zeman and colleagues (1998). New applications as a result of this improved technology include CT pulmonary angiography and cardiac imaging. CT pulmonary angiography routinely demonstrates clots to the fourth-order vessles (segmental branches) and is becoming the radiographic standard for evaluation of pulmonary emboli. Three-dimensional reconstruction, manipulation of the three-dimensional images, and cardiac gating will allow evaluation of coronary artery calcification as well as coronary artery anatomy. Three-dimensional imaging may be particularly useful to the chest surgeon when evaluating involvement of mediastinal structures, particularly of the great vessels, by malignant lymphadenopathy.
CT is far more sensitive in the detection of density differences: differences of 0.5% can be recognized by this technique, whereas density differences of 4% to 5% are necessary for recognition on the usual radiograph. Subtle differences in density may be accentuated by changing the scale of contrast and the center point (i.e., window width and level). An example of abnormal increase in density in the lung may be seen with amiodarone therapy. This may result in an accumulation of iodine within the pulmonary macrophages. Although the increase in density is not appreciated on a plain film, it may be seen on CT scan and indicates pulmonary toxicity (Fig. 9-13).
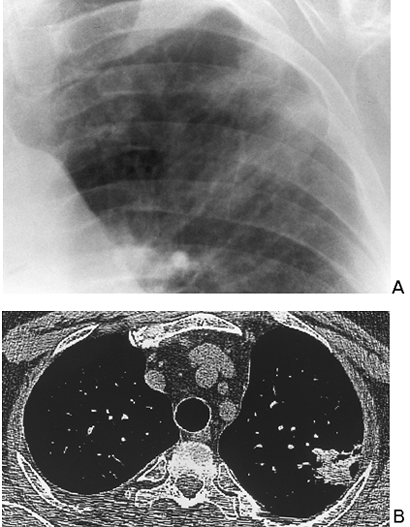 |
Fig. 9-13. Amiodarone toxicity. A. poorly marginated focal opaccity in the left upper lobe. patient had no pulmonary symtops. B.On CT. opacity measures 127 hounsfield units compatible with iodine accumulation in the lung. sign of amiodarone toxicity. |
CT scanning is particularly useful in identifying mediastinal nodes when the routine chest radiograph is equivocal or normal. Unfortunately, size criteria for enlargement do not allow complete separation of malignant from benign lymphadenopathy. McCloud and colleagues (1992) noted a sensitivity of 64% and a specificity of 62% when results of CT scanning of the mediastinum in patients with lung cancer were correlated with surgical findings. This may not obviate mediastinoscopy but does provide guidelines for further surgical staging or may identify patients who are candidates for adjunct chemotherapy. In addition, CT scanning is useful in the mediastinum, where absorption characteristics of various masses may yield useful information (Fig. 9-14).
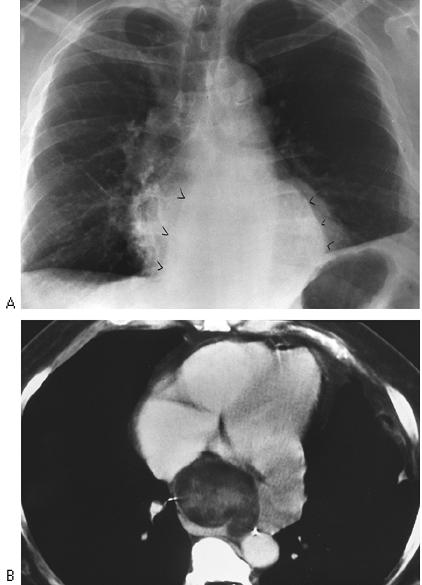 |
Fig. 9-14. Liposarcoma of the mediastinum. A. Posteroanterior chest view shows mediastinal mass (arrowheads) of indeterminate origin. B. Computed tomography demonstrates heterogeneous mass with some low densities compatible with fat. |
P.124
MAGNETIC RESONANCE IMAGING
Magnetic resonance (MR) imaging uses radio waves modified by a magnetic field to produce images that contain somewhat different information than that obtained in the standard radiograph or CT scan. Intravenous contrast is also not required. MR imaging in the chest is particularly useful in studying mediastinal structures. Lymph nodes are distinguished easily from mediastinal fat. The great vessels are readily imaged in a multiplanar fashion, and no contrast is required for the evaluation of thoracic aortic disease. MR imaging is superior to CT in imaging the brachial plexus in the case of a suspected Pancoast's or apical tumor (see Chapter 11).
FLUOROSCOPY
Air trapping is readily identified using fluoroscopy. Limitation or absence of diaphragmatic motion can be evaluated with fluoroscopy when an elevated hemidiaphragm is seen on routine chest radiography. Evaluation of diaphragmatic motion fluoroscopically must be done with the subject in the supine position in both PA and lateral projections. True paralysis of the diaphragm may be overlooked if fluoroscopy is done with the patient breathing quietly or if the fluoroscopy is performed with the patient in the erect position. Asking the supine patient to sniff quickly demonstrates elevation or paradoxic motion of the paralyzed diaphragm.
Partial eventration of the diaphragm is a common finding. It may be misinterpreted as diaphragmatic paralysis if the patient is fluoroscoped only in the PA position. The dome of the diaphragm may move paradoxically with the patient in this position. However, in the lateral position, a portion of the diaphragm, usually the posterior portion, is seen to move normally. This finding indicates a localized diaphragmatic weakness (eventration) rather than true paralysis.
Fluoroscopy is useful to demonstrate air trapping, particularly when an inhaled foreign body is suspected. On expiration, bronchial obstruction prevents decrease in volume of the obstructed lung and results in shift of the mediastinum away from the obstructed side. In young children, correlation of mediastinal motion with the phase of respiration may be difficult to evaluate. Decubitus views produce similar results. The obstructed side fails to collapse in the dependent position, indicating obstruction (see Supplementary Radiographic Views, earlier in this chapter).
Fluoroscopy is an excellent technique for transthoracic needle aspiration biopsy of pulmonary lesions if the lesion is large enough to be seen in two projections. Being able to visualize the lesion in real time is a significant advantage over CT-guided biopsy and decreases the time of the biopsy considerably. However, small lesions may not be evident in two projections on fluoroscopy, and CT guidance is needed. Real-time CT guidance systems are becoming available. This allows biopsy of small moving lesions adjacent to vital structures.
LUNG
The anatomic positions of the lung and the normal fissures are described in Chapter 5. The interlobar septa or major fissures are frequently visible on chest radiography (Fig. 9-15) and are of great help in assessing loss of volume in any of the lobes. Anomalous septa are not uncommon. Any pulmonary segment may have an anomalous fissure between that segment and the remainder of the lobe, resulting in an accessory lobe. The most common anomalous fissures are the superior and inferior accessory fissures. The superior accessory fissure occurs in 5% of anatomic specimens and separates
P.125
the superior segment of the lower lobe from the basilar segments. The inferior accessory fissure occurs in about 30% of anatomic specimens and separates the medial basal segment of the right lower lobe from the remainder of the right lower lobe. Another commonly seen anatomic fissure is the azygos fissure, which extends superolaterally from the azygos vein to the apex of the right lung. This fissure is seen in 1% of specimens and does not create a true accessory lobe, as do most other anomalous fissures. More often than not, the fissures are incomplete. This allows collateral air drift between lobes of the lung. It also may account for peripheral distribution of pleural effusions because they are prevented from uniform distribution through the incomplete fissure (see Fig. 9-15).
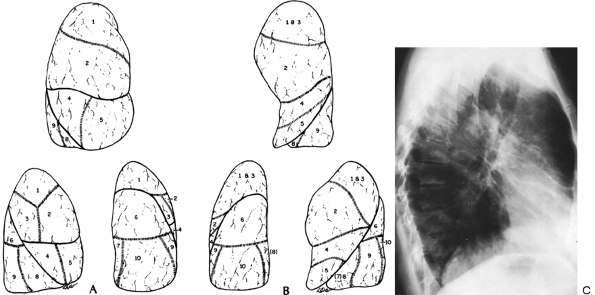 |
Fig. 9-15. A. Topographic positions of the bronchopulmonary segments of the right lung seen in the anterior, lateral, and posterior views. B. Topographic positions of the bronchopulmonary segments of the left lung seen in the anterior, lateral, and posterior views. C. Radiograph revealing the major fissures bilaterally and minor fissure on the right. Patient had interstitial edema and fluid in the fissures. |
Each lobe of the lung is divided into several pulmonary segments, each of which is supplied by a segmental bronchus. Various names have been applied to the pulmonary subsegments. The widely used classification of Jackson and Huber (1943) and the numeric classification of Boyden (1955) are presented in Table 9-1 and are illustrated in Fig. 9-15. The pulmonary segments may undergo consolidation or atelectasis. The characteristic configuration of pulmonary consolidation of the various segments is schematically presented in Figs. 9-16, 9-17, 9-18, 9-19 and 9-20. Occasionally, consolidation of an anomalous pulmonary segment can be recognized on routine radiography. Identification of a segmental distribution of an opacity is helpful in developing a differential diagnosis.
The pulmonary arteries accompany the bronchial tree and exhibit a segmental distribution similar to that of the bronchial tree. The pulmonary veins are slightly larger than the arteries and lie lateral to them in the upper lobes and somewhat more horizontal in the lower lobes. The pulmonary veins run in the intralobular septa, whereas the arteries and bronchi are distributed centrally in the pulmonary lobules. It frequently is possible to distinguish between the arteries and veins on routine radiography of the chest.
Table 9-1. Bronchopulmonary Segments | |||||||||||||||||||||||||||||||||||||||||||||||||||||||||||||||||
|---|---|---|---|---|---|---|---|---|---|---|---|---|---|---|---|---|---|---|---|---|---|---|---|---|---|---|---|---|---|---|---|---|---|---|---|---|---|---|---|---|---|---|---|---|---|---|---|---|---|---|---|---|---|---|---|---|---|---|---|---|---|---|---|---|---|
| |||||||||||||||||||||||||||||||||||||||||||||||||||||||||||||||||
 |
Fig. 9-16. Consolidation of the right upper lobe. A. Apical segment. B. Posterior segment. C. Anterior segment.Fig. 9-17. Consolidation of the right middle lobe. A. Lateral segment. B. Medial segment. |
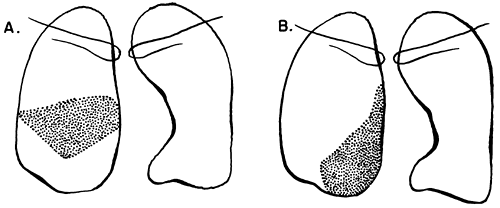 |
Fig. 9-17. Consolidation of the right middle lobe. A. Lateral segment. B. Medial segment. |
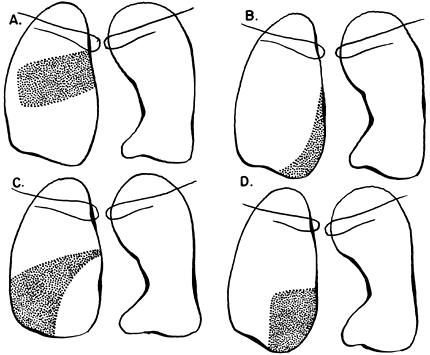 |
Fig. 9-18. Consolidation of the right lower lobe. A. Superior segment. B. Medial basal segment. C. Lateral basal segment. D. Posterior basal segment. |
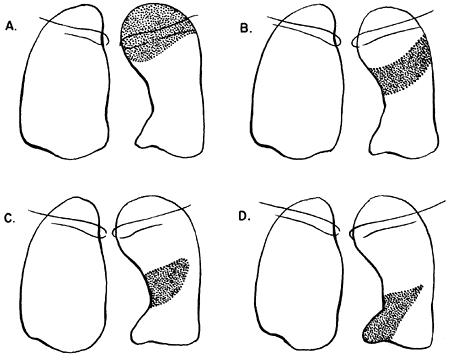 |
Fig. 9-19. Consolidation of the left upper lobe. A. Apical posterior segment. B. Anterior segment. C. Lingular segment, superior division. D. Lingular segment, inferior division. |
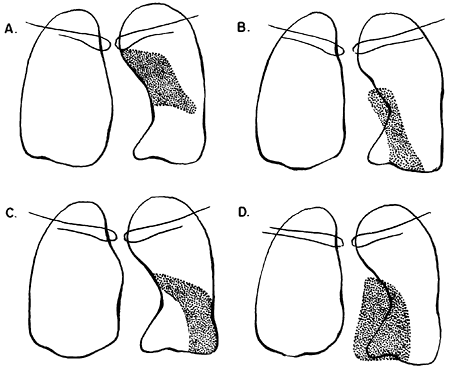 |
Fig. 9-20. Consolidation of the left lower lobe. A. Superior segment. B. Lateral basal segment. C. Anteromedial basal segment. D. Posterior basal segment. |
P.126
P.127
MEDIASTINUM
The hea rt occupies the major part of the lower half of the mediastinum anterior to the spine. On the PA radiograph, the transverse diameter of the heart is normally one half or less of the maximum transverse diameter of the chest. Detailed discussion of the anatomy and pathology of the heart is beyond the scope of this text. Fig. 9-4 demonstrates the normal position of the cardiac chambers and the great vessels in the PA and lateral projections.
Anatomists divide the mediastinum into the superior and inferior mediastinum and into anterior, middle, and posterior compartments. For the surgeon, designation of superior and inferior compartments is of little importance. What is important, however, is the division of the mediastinum into three compartments: the anterior, middle (visceral), and posterior or paravertebral compartments, as seen on the lateral radiograph (see Chapter 154).
In the anatomic division of the mediastinum, the heart, aorta, and brachiocephalic vessels bound the anterior compartment posteriorly, and the sternum bounds it anteriorly. The middle mediastinum contains the heart, ascending aorta, great vessels, trachea, main-stem bronchi, and esophagus. The posterior mediastinum, in reality, is nonexistent and should be considered to be the two paravertebral sulci. The radiologic classification of mediastinal lesions becomes simple when one includes the descending aorta and the esophagus in the middle (visceral) compartment and those structures that lie posterior to the anterior spinal ligament in the paravertebral areas or posterior compartments. Thus, arbitrary divisions can be made on the lateral radiograph (Fig. 9-21) to divide the mediastinum into these three compartments.
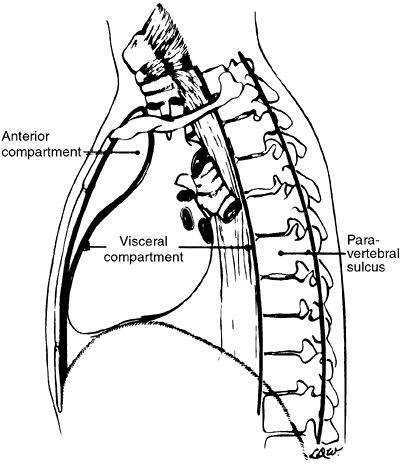 |
Fig. 9-21. The mediastinal compartments. The anterior compartment is defined by an imaginary line from the anterior border of the trachea extended to the xiphoid. The middle or visceral compartment is defined by the posterior margin of the anterior mediastinum and posteriorly by the anterior border of the spine. The posterior or paravertebral compartment lies behind the anterior margin of the spine. |
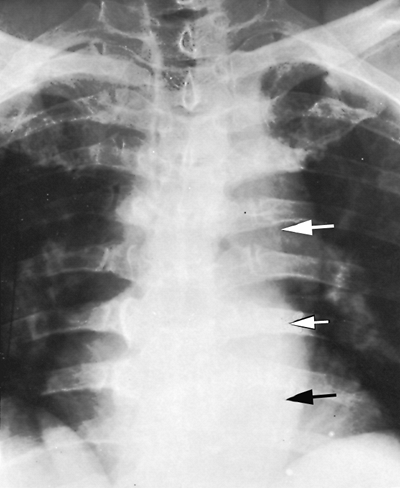 |
Fig. 9-22. Paraspinal line is seen only on the left in most patients. It increases in width with ectasia or tortuosity of the aorta, as in this patient (arrows). |
Various lines or stripes occur around the mediastinum on the PA radiograph. Displacement of these stripes is often indicative of mediastinal pathology. These stripes are described by Groskin (1993) in Heitzman's The Lung: Radiographic-Pathologic Correlations.
The paraspinal line, as Brailsford (1943) described, is a longitudinal density lying to the left of the thoracic spine (Fig. 9-22). The paraspinal line is related to the left-sided position of the descending aorta and is seen on the right side if the descending aorta is present on the right. Ordinarily, no paraspinal line is seen on the right, but in patients with large hypertrophic spurs, the spurs may push the paraspinal line out, making it visible. Tumors or inflammatory processes involving the vertebral bodies and paravertebral space characteristically displace the paraspinal line (Fig. 9-23). The line is ordinarily less than 1 cm from the left border of the vertebral column, but in some people, it may lie normally as far as 3 cm to the left of the vertebral column (see Fig. 9-22). This is usually the result of a tortuous or ectatic aorta.
The anterior junction line is an oblique linear density presenting from right to left downward over the trachea for a distance of several centimeters (Fig. 9-24). The line is produced by the contiguous pleura of the right and left upper lobes as they touch anterior to the great vessels. The posterior junction line results similarly from contiguous
P.128
pleura behind the trachea and above the transverse aorta. This line is differentiated from the anterior junction line by the fact that it extends above the clavicles.
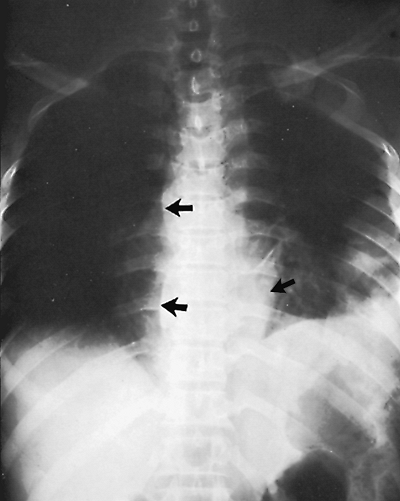 |
Fig. 9-23. Tuberculosis of the spine. Displacement of paraspinal line (arrows) on the right secondary to tuberculous abscess. |
The inferior esophageal pleural interface represents the medial border of the right lung in the azygoesophageal recess and lies posterior to the heart and anterior to the azygos vein. The lung in the recess outlines the right side of the distal esophagus (see Fig. 9-24). The superior esophageal pleural stripe is slightly higher than the anterior junction line and is slightly to the left. It represents the apposition of the two lungs against the esophagus in the retrotracheal area of the upper mediastinum. All of these mediastinal lines and interfaces can be displaced by lesions in the adjacent mediastinum.
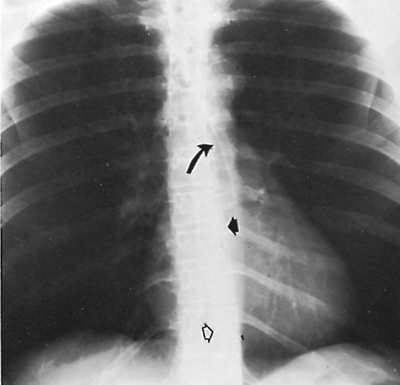 |
Fig. 9-24. Mediastinal lines and interfaces. Anterior junction line (curved arrow); paraspinal stripe (short, closed arrow); and azygoesophageal recess (open arrow). |
DIAPHRAGM AND CHEST WALL
The diaphragm is a musculotendinous structure that separates the thorax from the abdomen. It is divided into right and left hemidiaphragms. The hemidiaphragm is usually lower on the side where the heart is anatomically placed in the absence of displacement caused by some pathologic process. Thus, the right hemidiaphragm is usually higher than the left. Felson (1973) found, in a series of 500 normal chests, that the left hemidiaphragm was at a level even with or higher than the right in 9% of the subjects.
Variations of diaphragmatic contour are frequent. Most commonly, a segment of the diaphragm is elevated because of a lack of muscle in the segment (localized eventration). Fluoroscopy is helpful in distinguishing between eventration and paralysis.
The chest wall is composed of the bones and muscles of the thoracic cage. The bones are readily identifiable on radiography because of their increased radiographic density. The muscular shadows are not readily identifiable except when absent or occasionally hypertrophied. In a well-positioned chest radiograph, the overall lucency of both hemithoraces should be the same. If they are discrepant, the differential diagnosis includes added soft tissue density as in pleural effusion or chest wall hematoma as well as decreased soft tissue density, frequently a mastectomy, decreased vascularity, or air trapping.
ABNORMAL CHEST
Abnormalities of the Lung
Radiographic images result from the differential absorption or attenuation of the x-ray by various body tissues. Bone, soft tissue, fat, and air absorb different amounts of energy from the x-ray beam and thus can be distinguished radiographically. The chest is admirably suited for detection of pathology for one major reason: The lung contains air in the bronchi and alveoli, producing excellent contrast between the lung and the adjacent structures or soft tissue densities. The lungs are involved frequently with local or systemic diseases that may appear on radiography as abnormally increased density and increased grayness, but occasionally as increased lucency or blackness to the lungs. It is important for the radiologist and the surgeon to recognize certain primary patterns of abnormal density occurring in the lungs because these patterns often indicate the nature of the patient's illness.
Atelectasis
Atelectasis, or collapse, is loss of volume of the lung, lobe, or segment from any cause. Fraser and Par' (1989) list five mechanisms of atelectasis. Resorption atelectasis occurs secondary to
P.129
obstruction of a major bronchus or multiple small bronchi. For the surgeon, this type of atelectasis is the most important because it is often secondary to obstruction of a major bronchus either by tumor, foreign body, or bronchial mucus plug. Passive atelectasis occurs secondary to a space-occupying process in the thorax, particularly pneumothorax or hydrothorax. Compression atelectasis is a localized parenchymal collapse contiguous to a space-occupying pulmonary mass or bulla. Adhesive atelectasis denotes collapse occurring in the presence of patent bronchi, presumably secondary to abnormalities of surfactant. The most frequent presentation of this is subsegmental or platelike atelectasis, as described by Westcott and Cole (1985). This form of atelectasis occurs in association with pneumonia. Cicatrization atelectasis results from pulmonary fibrosis or scarring.
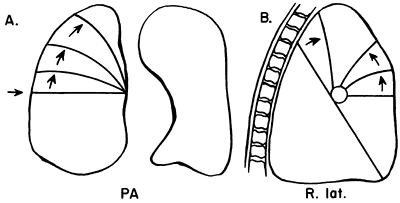 |
Fig. 9-25. Lobar collapse of the right upper lobe. PA, posteroanterior; R. lat., right lateral. From Lubert M, Krause GR. Patterns of lobar collapse as observed radiographically. Radiology 56:165, 1951. With permission. |
Several radiographic signs suggest atelectasis. The most reliable sign of collapse is displacement of interlobar fissures. Localized increase in density of the collapsed lobe is another reliable sign of atelectasis. Indirect signs of atelectasis include elevation of the hemidiaphragm of the ipsilateral side; deviation of the trachea and other mediastinal structures toward the involved side; compensatory hyperaeration of the rest of the ipsilateral lung and sometimes of the contralateral lung, with herniation of the contralateral upper lobe across the mediastinum; displacement of the hilus toward the collapsed lobe or segment; and decrease in size of the bony hemithorax of the involved side. These indirect signs are ordinarily seen only with atelectasis of major segments of the lung. They are less reliable than the direct signs and can occasionally be simulated by normal anatomic variations.
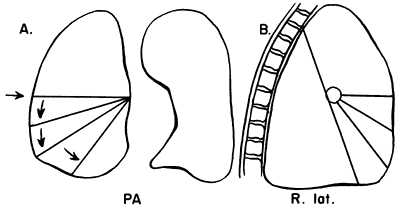 |
Fig. 9-26. Lobar collapse of the right middle lobe. PA, posteroanterior; R. lat., right lateral. From Lubert M, Krause GR. Patterns of lobar collapse as observed radiographically. Radiology 56:165, 1951. With permission. |
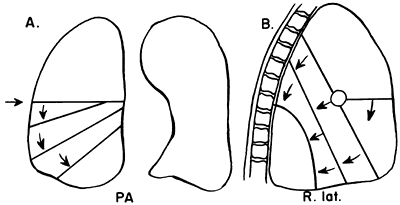 |
Fig. 9-27. Lobar collapse of the right lower lobe. PA, posteroanterior; R. lat., right lateral. From Lubert M, Krause GR. Patterns of lobar collapse as observed radiographically. Radiology 56:165, 1951. With permission. |
Certain fundamental observations can be made about lobar collapse. The proximal portion of the lobe is tethered to the hilus; consequently, the radiographic shadow of the collapsed lobe always points toward the hilus. Lobar collapse always occurs toward the mediastinum on the PA view. On the lateral radiograph, the upper lobe collapses anteriorly, the lower lobe collapses posteriorly, and the middle lobe symmetrically decreases in volume.
Lubert and Krause (1951) described the radiographic patterns of lobar collapse, and Woodring and Reed (1996) correlated this with CT scans. The patterns of lower lobe collapse are similar on the right and left sides, whereas the patterns of upper lobe collapse are slightly different. Figures 9-25, 9-26, 9-27, 9-28 and 9-29 show schematic representations of lobar collapse, as described by Lubert and Krause (1951).
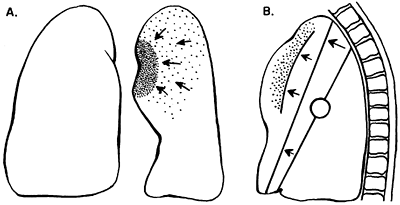 |
Fig. 9-28. Lobar collapse of the left upper lobe. A. Posteroanterior view. B. Lateral view. From Lubert M, Krause GR. Patterns of lobar collapse as observed radiographically. Radiology 56:165, 1951. With permission. |
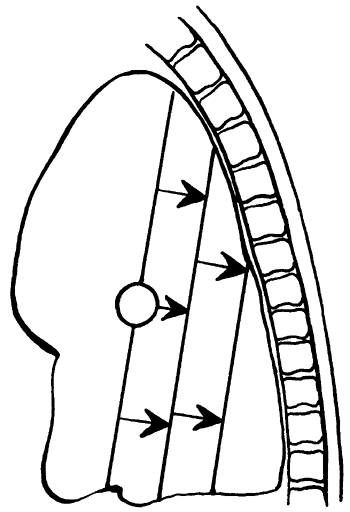 |
Fig. 9-29. Lobar collapse of the left lower lobe lateral view. From Lubert M, Krause GR. Patterns of lobar collapse as observed radiographically. Radiology 56:165, 1951. With permission. |
P.130
Recognition of the presence of a collapsed lobe is frequently difficult, particularly if the collapse is almost complete (Figs. 9-30, 9-31, 9-32, 9-33, 9-34, 9-35, 9-36 and 9-37). Of great help in identifying the presence of atelectasis is the silhouette sign, popularized by Felson (1973). The sign is based on the premise that consolidation of a segment or lobe of a lung contiguous with the border of the heart, aorta, diaphragm, or mediastinum eliminates the difference in contrast between aerated lung and adjacent soft tissue. The border between the two structures is no longer visible. Frequently, this obliteration of a heart border or fuzziness of the diaphragm is the first clue to the presence of atelectasis. The observation of atelectasis is important because it may indicate an endobronchial tumor or may be the explanation for a sudden decrease in oxygenation, particularly in the intensive care unit (see Fig. 9-36). Occasionally, the whole lung collapses. In the acute setting, the cause is usually mucus plugging (see Fig. 9-37A). It is important to distinguish this from pleural effusion or surgical absence of the lung (see Fig. 9-37B). Decrease in the volume of the opaque hemithorax and shift of the mediastinum to the opaque side are reliable indicators that the lung is absent or collapsed, and thoracentesis or chest tube placement is contraindicated. On the other hand, shift of the mediastinum away from the opaque hemithorax indicates space-occupying tissue, either fluid or tumor (see Fig. 9-37C).
Diffuse Pulmonary Disease
The air spaces and vessels are enveloped and supported by the connective tissue skeleton of the lung. The basic unit of lung function is the secondary pulmonary lobule, which is composed of three to five terminal bronchioles. The terminal bronchiole is the smallest purely air-conducting
P.131
bronchus in which no gas exchange takes place (Fig. 9-38). Each of these secondary lobules is separated from its neighboring secondary lobules by connective tissue envelopes or septa that are continuous with the pleural surface of the lung. The structure is much like trees coated with ice after an ice storm. The pulmonary veins and lymphatics run in these connective tissue septa. The peripheral connective tissue is contiguous with the axial connective tissue that acts as a sheath around the bronchovascular bundles, as stated by Weibel and Gil (1977), and provides structural support for the lung. Passages for gas exchange exist between secondary lobules, the pores of Kohn, and between peribronchial alveoli, the canals of Lambert. The intralobular septa are also incomplete. This arrangement, according to Groskin (1993), accounts in part for the radiographic appearance of peribronchial disease and nonuniform air space disease. The distribution of the interstitial connective tissues accounts for the appearance of interstitial processes. Recognition of these resulting patterns, air space, interstitial, and nodular, enables the physician to limit the differential diagnosis in an individual patient to one that is appropriate to that particular clinical setting (Table 9-2).
 |
Fig. 9-30. Right upper lobe atelectasis A. PA view demostrates the collapsed right upper lobe causing haziness and widening of the right upper mediastinal border(arrows)B. Lateral view ashow restrosternal soft tissu density arrows that is the collapsed right upper lobe.C. CT scan shows wedge-shaped collapsed right upper lobe to the right of the mediastinum (arrows). |
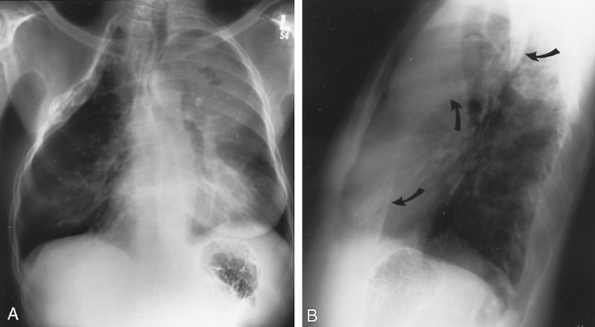 |
Fig. 9-31. Left upper lobe atelectasis related to tumor. A. PA radiograph shows an old thoracoplasty on the right. On the left, note hazy density over the left upper lung field with loss of definition of the left cardiac border, characteristic of left upper lobe atelectasis. A small collection of air can be seen over the left second anterior rib, representing a cavity within necrotic tumor. B. Lateral view shows the left major fissure (arrows) to be pulled forward in its lower portion but bulging in its upper portion. This characteristic s sign is seen when a lobe collapses around a tumor. The tumor is a large cavitary mass in the upper lobe but not involving the lingula, which collapses anteriorly. |
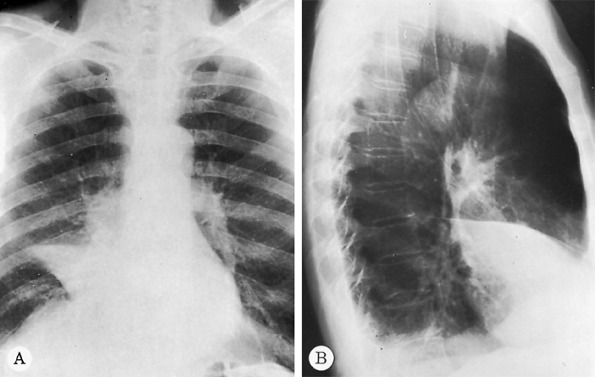 |
Fig. 9-32. Carcinoma with right middle lobe collapse. A. PA radiograph shows obliteration of the right cardiac border by the collapsed right middle lobe (silhouette sign) with an associated mass in the right hilus. B. The approximation of major and minor fissures can be noted on the lateral view. |
P.132
Recognition of a pattern as alveolar, interstitial, or reticulonodular is helpful in directing further clinical evaluation of the patient.
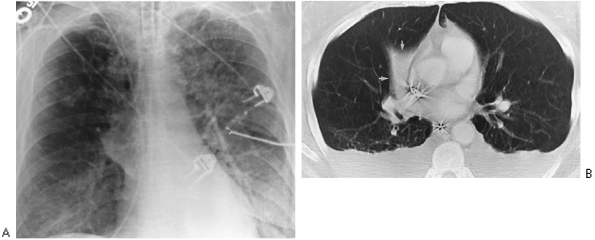 |
Fig. 9-33. Right middle lobe collapse simulating mass at the right hilum. A. Anteroposterior view of chest demonstrates mass opacity at right hilum that appeared on 1 day. B. CT scan demonstrates mass to be result of collapsed middle lobe. |
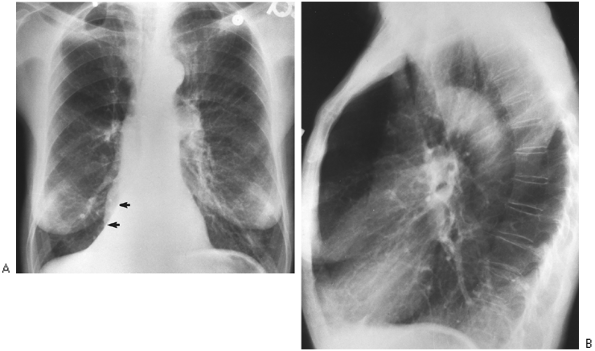 |
Fig. 9-34. Right lower lobe atelectasis. A. PA film demonstrates triangular opacity superimposed over right-sided heart border that obliterates the medial right hemidiaphragm (arrows); this is the collapsed right lower lobe. B. Lateral film shows only one diaphragm, left; the right is obscured by nonaerated right lower lobe (silhouette sign). |
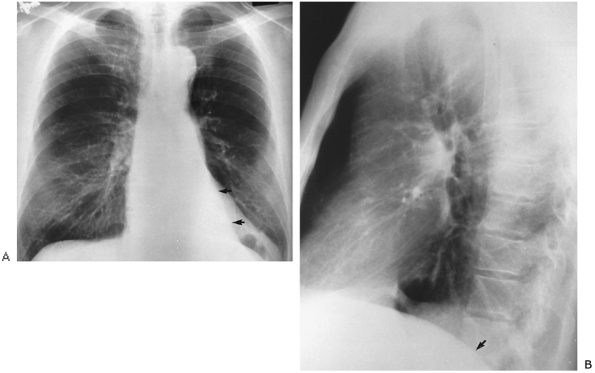 |
Fig. 9-35. Left lower lobe atelectasis. A. PA film demonstrates triangular opacity seen over left-sided heart (arrows), obliterating left hemidiaphragm medially. Note also small left hilus as interlobar artery is shifted down with the collapsed left lower lobe. B. Lateral view shows obliteration of posterior left hemidiaphragm secondary to collapsed left lower lobe (arrow). Note similarity to findings of right lower lobe atelectasis (see Fig. 9-34). |
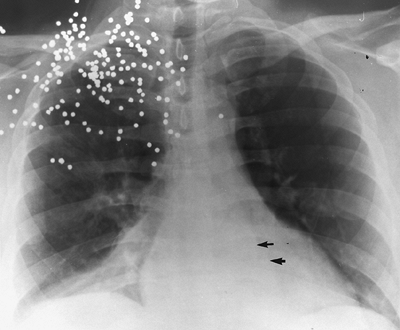 |
Fig. 9-36. Bilateral lower lobe collapse. Anteroposterior supine portable chest view shows bilateral triangular opacities at bases from collapse of both right and left lower lobes (arrows). This occurred postoperatively, and the patient's resulting shortness of breath was thought to be from pulmonary embolism because the atelectasis was not appreciated. No evidence of pulmonary embolus existed on ventilation-perfusion scan. |
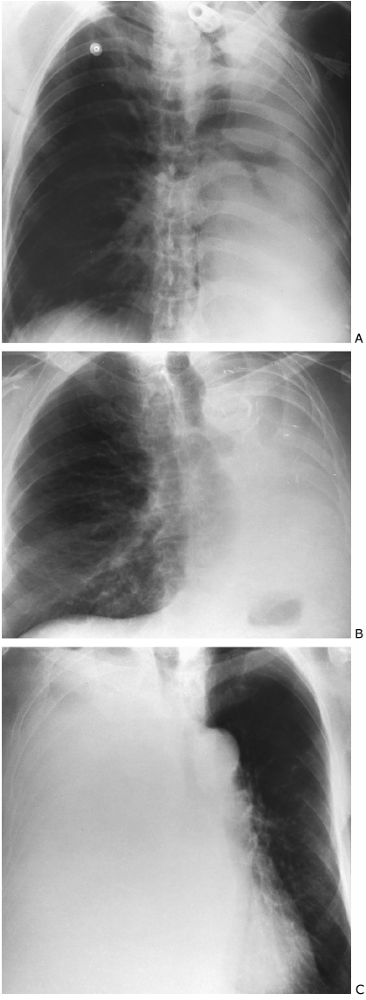 |
Fig. 9-37. Complete opacification of a hemithorax. A. An opaque left hemithorax with shift of the mediastinum to the left is shown. This occurred over 1 day in the intensive care unit. Note the patent bronchi on the left to the left upper and lower lobes. This is the result of collapse from mucus plugging as found at bronchoscopy. B. Opaque left hemithorax with mediastinum shifted to the left ipsilateral side is demonstrated. Surgical clips on the left and cutoff of left main-stem bronchus indicate that patient has had a pneumonectomy. C. An opaque right hemithorax with shift away from the opaque thorax to the left, the contralateral side, is seen. This indicates mass effect of fluid, tumor, or both. An endobronchial lesion cannot be inferred in this situation. |
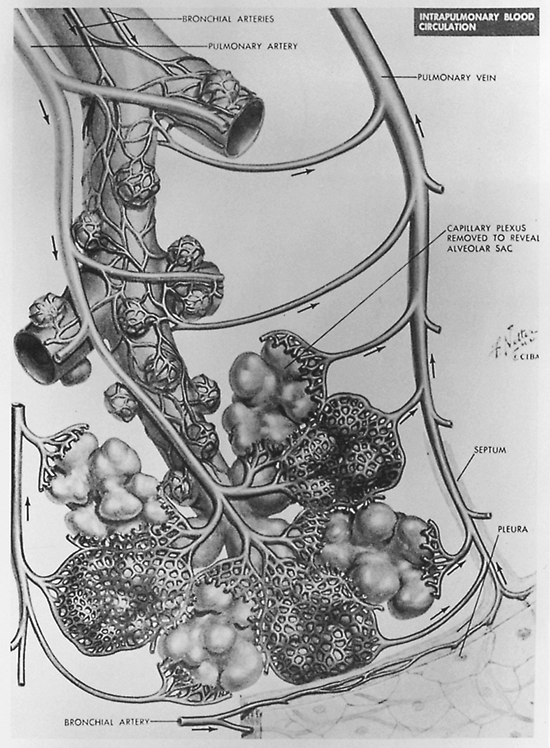 |
Fig. 9-38. Structure of terminal pulmonary air spaces. Note origin of two respiratory bronchioles from terminal bronchiole. Alveoli are seen to bud directly from respiratory bronchiole. Also demonstrated is primary pulmonary lobule composed of alveolar duct and lung subtended by it. Modified from Groskin SA. Heitzman's The Lung, Radiographic-Pathologic Correlations. St. Louis: Mosby Year Book, 1993. With permission. |
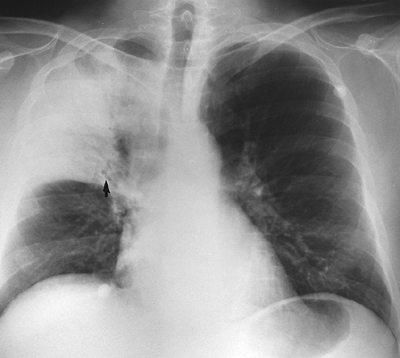 |
Fig. 9-39. Right upper lobe pneumonia. Note air bronchograms (arrow), branching radiolucencies, and lobar distribution indicative of air space disease. |
Table 9-2. Radiographic Patterns Produced by Pulmonary Disease | ||
|---|---|---|
|
P.133
P.134
P.135
The radiographic findings suggesting alveolar disease, as enumerated by Groskin (1993), are (a) a lobar or segmental distribution, (b) poor margination of the opacity, (c) a tendency to coalesce, (d) presence of air bronchograms (Fig. 9-39), and (e) butterfly or batwing distribution (Fig. 9-40). The air bronchogram was described originally by Fleischner (1948) and has been popularized by Felson (1973). The air bronchogram is a result of replacement of air in the distal alveolar spaces by fluid of any kind (e.g., blood, pus, or edema). In the normal lung, air in the bronchi both centrally and peripherally is not visible because the surrounding alveoli are filled with air and the bronchial walls are too thin to be visualized on plain radiography. When the alveolar air is replaced with fluid, the intrabronchial air becomes visible. Finally, rapidly changing pulmonary lesions favor alveolar disease over interstitial disease, which tends to change more slowly. Occasionally, pneumonia may present as a mass lesion (round pneumonia). This is more common in children than adults. Clinical history should suggest the diagnosis (Fig. 9-41).
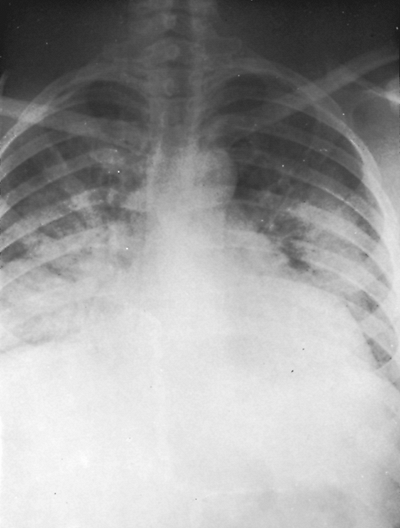 |
Fig. 9-40. Pulmonary edema. Note the patchy confluence of the diffuse alveolar pattern with a butterfly-wing distribution. |
P.136
Common causes of a diffuse alveolar pattern are pneumonia, pulmonary edema, bleeding into the alveoli, and aspiration of blood or gastric contents into the alveoli. Less common causes of diffuse alveolar consolidation include parenchymal sarcoidosis, pulmonary alveolar proteinosis, metastatic carcinoma from many causes but especially breast carcinoma, and occasionally bronchioloalveolar cell carcinoma (see Table 9-2).
Interstitial disease is suggested when the lungs have a reticulate appearance. This results from thickening of the connective tissues of the lungs. Involvement of the peripheral connective tissue and intralobular septa results in Kerley lines as described in Shanks and Kerley's A Textbook of X-ray Diagnosis (1951). All the Kerley lines (A, B, and C) represent thickening of the intralobular septa from any cause: fluid, blood, cells, or fibrosis. The most frequent and easy to recognize are the Kerley B lines. Kerley B lines are linear up to 1 cm in length, extending perpendicularly to the pleural surfaces of the costophrenic angles (Fig. 9-42). Kerley A lines radiate superiorly from the hila, and Kerley C lines result in a reticulate appearance of the parenchyma,
P.137
particularly at the lung bases. Involvement of the central connective tissue results in increased bronchovascular markings, hilar haze, and peribronchial cuffing, as noted by Groskin (1993). Although these may be difficult to identify initially, recognition of Kerley lines greatly aids in the differential diagnosis (see Table 9-2).
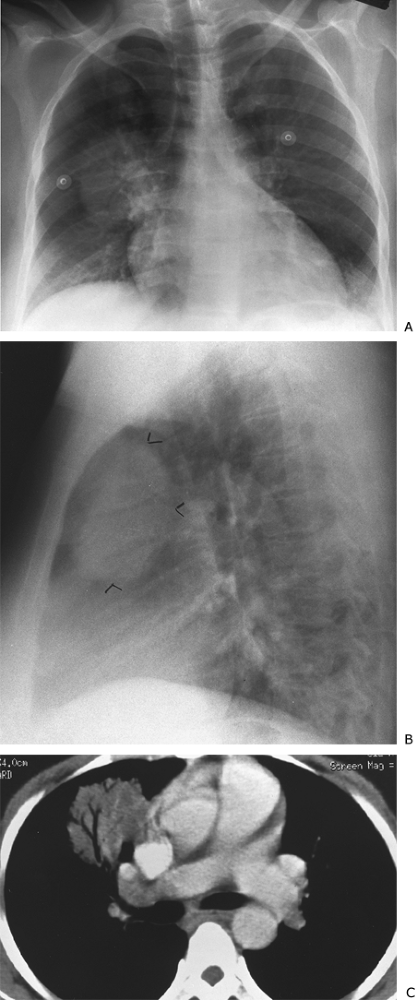 |
Fig. 9-41. Round pneumonia. A. PA view demonstrates a mass at the right hilum. B. This is anterior to the hilum on the lateral view (arrowheads). C. CT shows the presence of air bronchograms. Organism identified on culture was Haemophilus influenzae. |
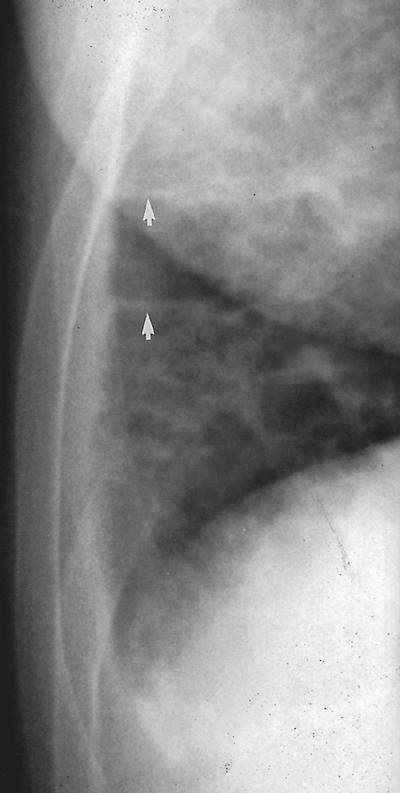 |
Fig. 9-42. Lymphangitic metastases from renal cell carcinoma. PA view of the right costophrenic angle demonstrates perpendicular linear opacities extending from the pleura of the right costophrenic angle (Kerley's B lines) (arrows). |
Common diseases causing a diffuse interstitial pattern include interstitial pulmonary edema, pneumoconiosis, sarcoidosis, metastatic tumor (both nodular and lymphangitic forms), diffuse interstitial pneumonia, collagen disease (e.g., scleroderma and rheumatoid lung), idiopathic pulmonary fibrosis, and occasionally viral pneumonia.
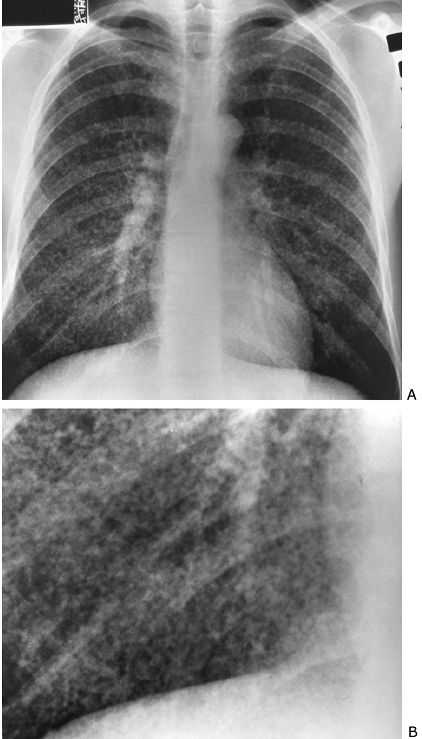 |
Fig. 9-43. Miliary histoplasmosis. PA (A) and cone-down (B) views. Fine nodular or miliary pattern compatible with interstitial process. |
Discrete nodules of 1 to 3 mm, miliary nodules, are also indicative of interstitial disease (Fig. 9-43). A reticulonodular pattern also may be present in interstitial disease. A slow rate of change of a diffuse process favors interstitial over alveolar disease.
High-resolution or thin-slice CT scanning provides additional information about anatomic distribution and extent of interstitial lung disease, well described by Webb and coeditors (2001)
P.138
as well as by Colby and Swensen (1996). This technique is discussed in detail in Chapter 10.
Localized Pulmonary Densities
Localized pulmonary densities may have poorly circumscribed or discrete margins. If the margins are poorly circumscribed, a solitary density most likely denotes pneumonia or pulmonary infarction. Primary lung tumors may present in this fashion' thus, it is important to follow a poorly circumscribed density to complete clearing to be certain that it does not represent a tumor with postobstructive pneumonic changes. Pulmonary tuberculosis and other chronic inflammatory diseases also manifest as poorly localized pulmonary densities. A chronic opacity in the apical or posterior segment of the upper lobe or in the superior segment of the lower lobe should make one suspect tuberculosis. Cavitation is also suggestive of tuberculosis. Without old films, tuberculosis must always be considered active, regardless of radiographic appearance, as demonstrated by one of us (WTM) and MacGregor (1978).
The sharply circumscribed pulmonary density most likely is a tumor or a granuloma. Primary or metastatic carcinoma also presents as single or multiple nodules or masses. Tuberculous granulomata, histoplasmosis and other fungal diseases, benign pulmonary tumors, and occasionally pneumoconiosis may present as a sharply circumscribed pulmonary density. Also to be considered are pulmonary infarct, pneumonia, arteriovenous malformation (Fig. 9-44), bronchial cyst, and carcinoid tumor. The likelihood of malignancy in a newly discovered pulmonary nodule is variable and depends on age, geography, and individual patient history, among other things. Morphology of the nodule is occasionally predictive of malignancy, but unfortunately, this is not sufficiently reliable. Old films, from 2 years or earlier, are the best predictors of benign disease. However, slowly growing tumors may be without apparent change in a 2-year period. Volumetric analysis of nodule size offers increased sensitivity to change in size. Visual inspection is less sensitive for change in size for smaller lesions. Calcifications within a nodule, popcorn, solid, laminated and central, are indicators of benign disease. Eccentric calcifications may indicate a malignant process (Fig. 9-45). Analysis with high-resolution CT, 1.25-mm images, affords optimal pattern analysis. Unfortunately, as discussed by Swensen and colleagues (1996), patterns of nodule enhancement following intravenous administration of contrast are not accurate enough to make this distinction.
Positron emission tomography (PET) scanning is unique as an imaging modality because it provides images of metabolic activity. Most malignant tumors display increased accumulation of the fluorodeoxyglucose (FDG) isotope in comparison with normal tissues. In a meta-analysis, the sensitivity and specificity of FDG PET for non small cell carcinoma were noted to be 96% and 77%, respectively, for lesions 1 cm and greater. Sensitivity decreases with nodules less than 1 cm, and caution should be used in nodules less than 7 mm, as noted by Turkington and Coleman (2002) and Hagge and Coleman (2002) (see Chapters 10 and 12).
Multiple sharply circumscribed densities almost invariably indicate metastatic malignant disease. Occasionally, however, rheumatoid nodules, fungal disease, Wegener's granulomatosis, or alveolar sarcoidosis may produce a similar pattern. Septic emboli may appear as multiple pulmonary nodules, but they frequently progress to cavitation (Fig. 9-46).
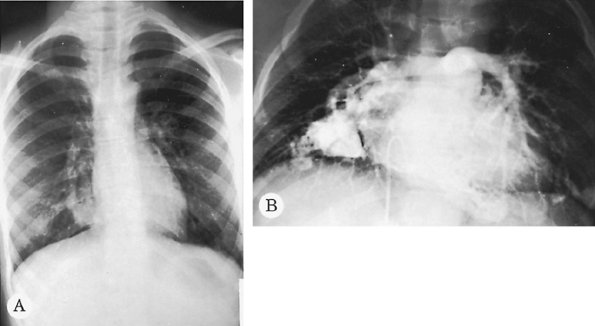 |
Fig. 9-44. Pulmonary arteriovenous malformation. A. Serpiginous lobulated density next to the right heart border. B. A pulmonary angiogram demonstrates multiple malformations. These malformations are now easily identified on CT. |
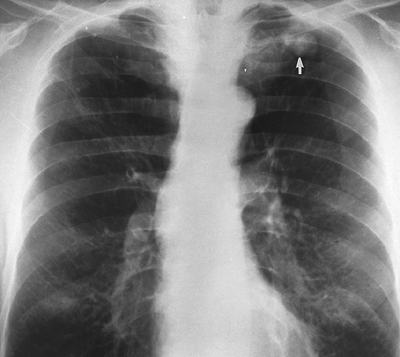 |
Fig. 9-45. Carcinoma. Single eccentric calcification at inferior aspect of mass (arrow). This pattern does not indicate benign disease in this instance. |
P.139
Cavitation of a solitary pulmonary density usually indicates a lung abscess, primary bronchial carcinoma, tuberculosis (Fig. 9-47), or fungal disease. Tumors and lung abscesses ordinarily have thick, shaggy walls, whereas fungal disease and tuberculosis often have thin, smooth walls. If a lung abscess is chronic, the wall that initially was thick and shaggy generally becomes thin and smooth. Multiple cavitary lesions in the chest suggest septic emboli, metastatic tumor, tuberculosis, fungal disease, or Wegener's granulomatosis.
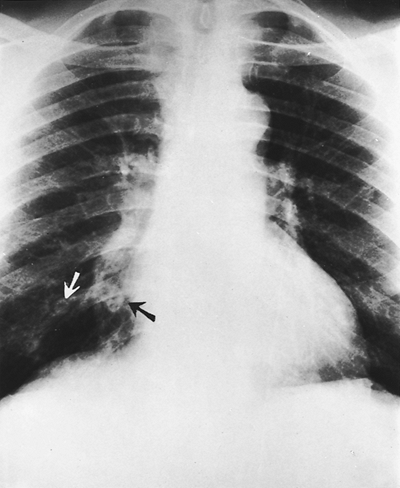 |
Fig. 9-46. Septic emboli. Several pulmonary nodules are present in both lungs with cavitation of two right lower lobe nodules (arrows). |
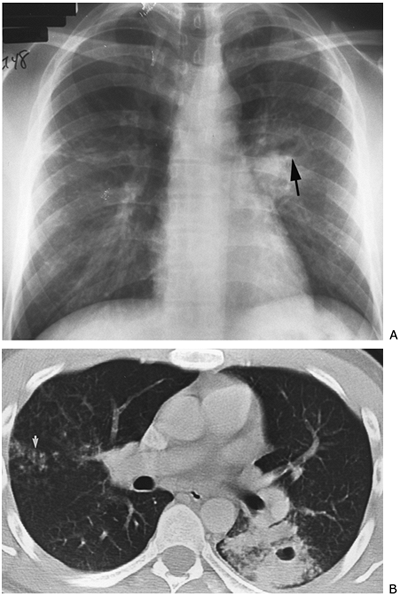 |
Fig. 9-47. Mycobacterium tuberculosis. A. PA view demonstrates opacity at left hilus with an air fluid level (arrow) indicating cavitation; possible nodular changes in the right mid-lung zone indicating endobronchial spread. B. CT of cavity on the left and nodular endobronchial spread on the right (arrow). |
Abnormalities of the Pleura
Pleural Effusion
A collection of fluid within the pleural space is the most common pleural abnormality. Fluid in the pleural cavity appears radiographically as a homogeneous opacity that is ordinarily in a dependent position in the pleural cavity. The fluid may be exudate, transudate, blood, pus, or chyle. Small amounts of free pleural fluid may be difficult to detect radiographically. Careful observation of the posterior
P.140
costophrenic sulcus on the lateral radiograph often shows minor blunting of the sulcus with as little as 50 to 100 mL of fluid. A lateral decubitus view may confirm the presence of free pleural fluid (see Fig. 9-6).
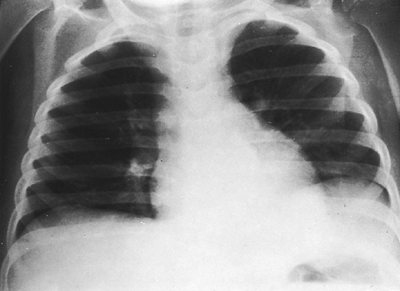 |
Fig. 9-48. Left pleural effusion. The separation of the stomach bubble from the lung is caused by a large left pleural effusion in this child with nephrosis. Another sign of a subpulmonic effusion is displacement of the apex of the left hemidiaphragm. Note that the costophrenic angle is not blunted. A decubitus view would confirm the diagnosis with layering of fluid. |
With larger pleural effusions, the lateral costophrenic sulcus is blunted also. On occasion, the fluid may remain infrapulmonary and displace the lung upward so that the lateral costophrenic angle remains sharp (Fig. 9-48). This infrapulmonary location of fluid can be suspected if the apparent hemidiaphragm is elevated; if the costophrenic sulcus is blunted posteriorly; or if the gas bubble in the gastric fundus lies at an increased distance below the dome of the apparent hemidiaphragm, if the apparent apex of the involved hemidiaphragm is displaced laterally, or both. Decubitus views demonstrate that fluid is free and not loculated. CT scanning commonly identifies pleural effusions not seen on routine radiography.
As the amount of pleural effusion increases, passive atelectasis occurs in the underlying lung, and eventually the mediastinum may be displaced to the contralateral side (see Fig. 9-37C).
Fluid may become loculated in the pleural space, in which instance it may be difficult to differentiate from localized pleural thickening. Loculated pleural fluid generally has a convex border toward the hilus (Fig. 9-49). Pleural thickening is more likely to have a concave border toward the hilus. Loculated pleural effusion may appear in the interlobar fissure, where it assumes a lentiform shape. This is referred to as a pseudotumor. Localized pleural tumor may masquerade as localized pleural thickening or pleural fluid. On occasion, loculated fluid may assume a lobar shape (Fig. 9-50) or simulate a mass (Fig. 9-51).
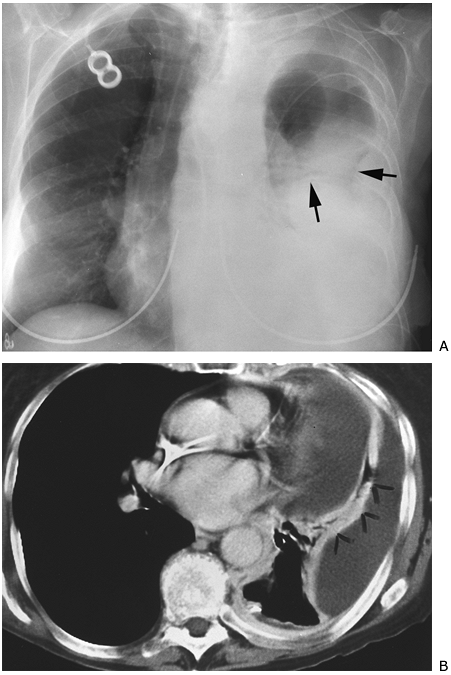 |
Fig. 9-49. Empyema and loculated pleural effusion. A. Lobulated contour (arrows) of peripheral opacity on PA chest view suggests loculation. B. CT scan demonstrates two locules of fluid separated by contrast-enhanced lung (arrowheads). |
Common causes of pleural effusion are tuberculosis, pneumonia, viral pleural infection, metastatic tumor, primary lung or primary pleural tumor, lymphoma or leukemia, pulmonary infarction, chest trauma, collagen vascular disease, congestive heart failure, and intraabdominal problems such as subphrenic abscess or pancreatitis.
Pleural Thickening
Pleural thickening represents a localized fibrosis of the pleura that may be secondary to several causes. It is commonly seen at both apices, at the costophrenic angles, and occasionally along the lateral chest wall. It can be distinguished from free pleural fluid in a radiograph made with the subject in the decubitus position. Distinguishing pleural
P.141
thickening from loculated pleural fluid may be more difficult. Houndsfield units of less than 20 indicate pleural fluid. Ultrasound or CT scan with intravenous contrast, if necessary, distinguishes fluid from soft tissue. The lack of change over a long period of time suggests pleural thickening rather than loculated fluid.
Causes of localized pleural thickening are usually old infection, particularly tuberculosis, or remote pulmonary infarction. Generalized pleural thickening occurs following the healing of hemothorax or pyothorax and commonly is associated with tuberculosis. Asbestosis or talc pneumoconiosis also may cause either focal or diffuse pleural thickening.
P.142
Diffuse pleural mesothelioma (Fig. 9-52) may be difficult to distinguish from benign pleural thickening, although pleural effusion and pleural nodulation are often present with mesothelioma as well as contraction of the involved hemithorax. CT demonstrates the pleural changes, particularly the nodularity and contraction of the pleural space. Video-assisted thoracoscopy (VATS) or open biopsy is frequently needed to make the diagnosis of mesothelioma.
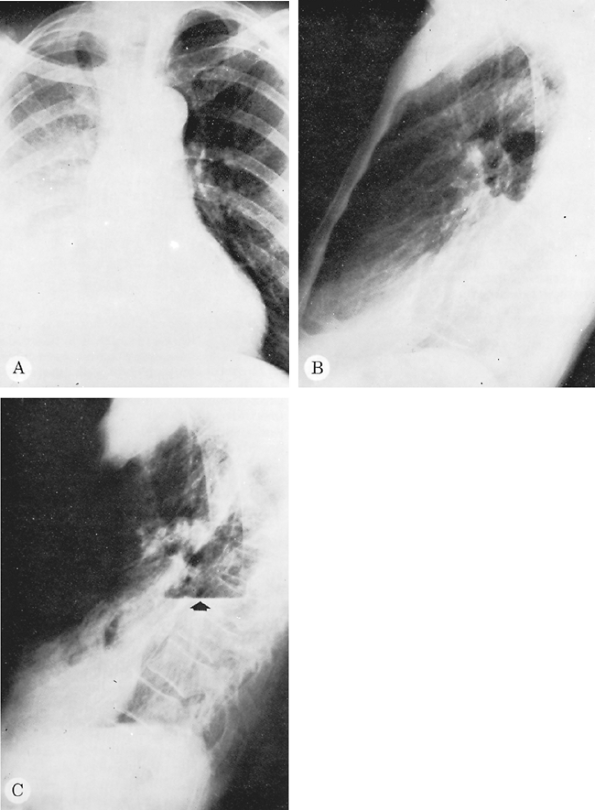 |
Fig. 9-50. Tuberculosis with loculated pleural effusion. The loculated effusion seen on the PA (A) and lateral (B) radiographs simulated collapse of the right lower lobe. A right lateral decubitus radiograph showed no evidence of free effusion. After thoracentesis, however, a large collection of loculated fluid with an air fluid level (arrow) was apparent (C). |
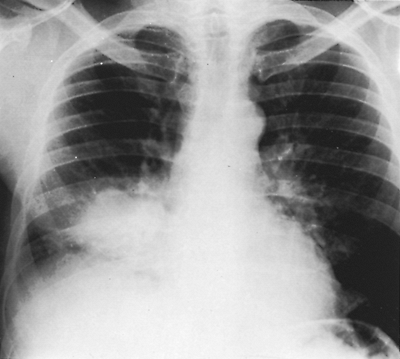 |
Fig. 9-51. Loculated empyema. This loculated collection of fluid near the border of the right side of the heart simulates a lung mass. |
Apical pleural thickening may be difficult to distinguish from superior sulcus tumor. O'Connell and colleagues (1983) have demonstrated that asymmetry of the apices should suggest a superior sulcus tumor. Rib destruction adjacent to the apical thickening or significant change over a short period of time suggests a malignant process. Symmetric apical thickening may be a normal variant, as demonstrated by Vix (1977). MR imaging is particularly useful in identifying or excluding a superior sulcus tumor.
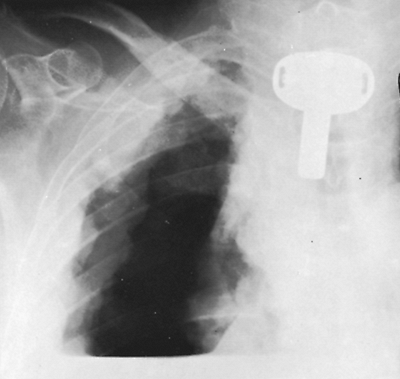 |
Fig. 9-52. Pleural mesothelioma. Diagnostic pneumothorax demonstrates diffuse pleural involvement by mesothelioma. |
Calcification of the pleura is usually secondary to old hemothorax, pyothorax, or tuberculosis. Calcified plaques are seen with asbestos exposure. These occur on the hemidiaphragms, parietal pleura of the chest walls, mediastinum, and pericardium.
Pneumothorax
The presence of air within the pleural cavity is easily detected radiographically by identifying a thin line of visceral pleura surrounding the partially collapsed lung. This feature is best seen at the apex of the lung when the patient is upright but sometimes is seen only laterally or at the lung base, particularly if the patient is supine. It may be necessary to obtain a radiograph in expiration to be absolutely certain that a small pneumothorax is present. The expiratory image accentuates the pneumothorax, as noted earlier, because the volume of air in the lung decreases while the air in the pleural space remains the same, thus increasing the apparent size of the pneumothorax. In addition, the density of the lung in expiration increases, which accentuates the difference in contrast between the intrapleural air and less aerated lung. Fluid in the pleural space, in association with pneumothorax, demonstrates the straight line of an air fluid level rather than the curved line (meniscus) seen when no pneumothorax is present. A straight air fluid level may on occasion be the finding that makes the radiologist aware that a pneumothorax is present (see Fig. 9-7). Again, a horizontal projection of the x-ray beam is required to appreciate an air fluid level.
Abnormalities of the Mediastinum
Early lymph node enlargement may be difficult to detect in the mediastinum. The importance of previous radiographs for comparison must be emphasized once again. A slightly widened mediastinum that has not changed for several years is not significant, whereas a minor alteration of mediastinal outline can be important if not present on radiographs made at an earlier date. CT is invaluable in demonstrating mediastinal adenopathy if any reason exists to suspect it. Intravenous contrast is helpful in questionable cases.
The radiographic features of mediastinal tumors are discussed in detail in Chapter 158. Several aspects of mediastinal disease might be emphasized, however. In all mediastinal lesions, it is important to determine the location of the mass because the differential diagnosis varies considerably for each of the three mediastinal compartments. The one mass that commonly occurs in all three compartments is lymph node enlargement. It is often possible to determine the probable etiologic basis for the enlargement of lymph nodes by using certain helpful radiographic criteria.
P.143
Sarcoidosis has a characteristic pattern when it causes enlarged nodes. This pattern has been called the 1 2-3 sign because three prominent areas of enlarged nodes are identified, in both hila and in the right paratracheal area. In sarcoidosis, the hilar nodes also tend to be more peripherally situated or peribronchial, with discrete nodes identifiable, rather than one large amorphous mass tight against the mediastinum, as is more commonly seen in association with metastatic tumor or lymphoma. CT demonstrates more extensive lymphatic involvement in all these processes than is seen on chest radiography.
Lymphoma usually presents in only one node-bearing area rather than in several, and this area is commonly the anterior mediastinum. Lymph node enlargement in one nodal area alone or in one hilus and the mediastinum in a younger individual should make the clinician suspect lymphoma. In an older person, this same pattern should make one suspect a small cell carcinoma of the lung.
Middle mediastinal adenopathy may be difficult to detect on plain film but is readlily detectable on CT, particularly with contast enhancement. Enlargement of nodes in the middle mediastinum is usually indicative of metastatic tumor, most commonly from lung cancer.
Primary tuberculosis commonly manifests as node enlargement in one hilus or in the mediastinum in children and in patients with human immunodeficiency virus (HIV) infection. The presentation of tuberculosis in patients with HIV varies with the CD4 count. Early lymph node enlargement may be difficult to detect. The importance of previous radiographs for comparison must be emphasized once again. A slightly widened mediastinum that has not changed for several years is not significant, whereas a minor alteration of mediastinal outline can be important if not present on radiographs made at an earlier date. CT is invaluable in demonstrating mediastinal adenopathy if any reason exists to suspect it.
Masses occurring in the anterior cardiophrenic angle are almost invariably benign, except in a patient with known lymphoma or abdominal malignancy, and so probably do not merit further investigation. These masses include pericardial cysts, foramen of Morgagni hernia, prominent pericardial fat pad, and pericardial fat necrosis.
Abnormalities of the Diaphragm and Chest Wall
The radiographic features of abnormalities of the diaphragm are covered in Chapters 48, 49, and 51 to 53 and are not discussed here.
The most common chest wall abnormalities identifiable radiographically involve the ribs. Abnormalities of the chest wall that protrude into the thorax create a characteristic radiographic appearance that has been labeled the extrapleural sign by Felson (1973). These extrapleural lesions are smooth; are seen well in only one projection, in which they are tangential to the x-ray beam; and usually have an oblique angle at their borders, where the parietal pleura is being stripped from the thoracic cage. Whenever an extrapleural lesion is observed, the underlying rib should be examined carefully. Metastatic malignant disease of the rib is the most common cause of the extrapleural sign. Myeloma, primary rib tumor, fractures, or osteomyelitis may be responsible for this finding. Primary tumor of the chest wall or extrapleural hematoma also may present in this fashion.
Abnormalities of the soft tissues of the chest also may be discernible on the radiograph of the chest but are better visualized by CT scanning. The nipple of the breast frequently creates a shadow simulating a pulmonary nodule and must be considered when the nodule overlies the breast area. Extraparenchymal nodules or shadows, such as a nipple shadow, tend to have incomplete margins; the edges are not seen all the way around the nodule.
INTRAVENOUS CONTRAST
The primary indication for pulmonary intravascular contrast in the thorax is for the detection of pulmonary emboli. With the development of multidetector CT scanning and nonionic contrast to diminish motion artifacts, the CT pulmonary angiogram is the standard for the detection of pulmonary emboli. Sensitivities of 53% to 89% and specificities of 78% to 100% have been reported. Visualization of large central clots on CT is at times superior to that of pulmonary angiography. Peripherally, most studies include fourth-order vessels, branches to the pulmonary segments. The reported demonstration of subsegmental clots, those beyond fourth-order branches, is extremely variable, but detection will certainly improve with multidetector imaging. The significance of subsegmental clots is not yet known. The incidence of pulmonary emboli after a negative CT pulmonary angiogram approaches that following a negative pulmonary angiogram or normal ventilation-perfusion ([V with dot above]/[Q with dot above]) scan. CT has the additional advantage of identifying other abnormalities in the chest that may be causing the patient's symptoms. CT venography of the lower extremities may be done at the same sitting without additional contrast, obviating Doppler examination of the legs.
REFERENCES
Boyden EA: Segmental Anatomy of the Lungs. A Study of the Patterns of the Segmental Bronchi and Related Pulmonary Vessels. New York: McGraw-Hill, 1955.
Brailsford JF: The radiographic posteromedial border of the lung or the linear thoracic paraspinal shadow. Radiology 41:34, 1943.
Colby TV, Swensen SJ: Anatomic distribution and histopathologic patterns in diffuse lung disease: correlation with HRCT. J Thorac Imaging 11:1, 1996.
Ely EW, et al: Radiologic determination of intravascular volume status using portable, digital chest radiography: a prospective investigation in 100 patients. Crit Care Med 29:1502, 2001.
P.144
Felson B: Chest Roentgenology. Philadelphia: WB Saunders, 1973.
Fleischner FG: The visible bronchial tree: a roentgen sign in pneumonic and other pulmonary consolidations. Radiology 5:184, 1948.
Fraser RG, Par' JAP: Diagnosis of Diseases of the Chest. 3rd Ed. Philadelphia: WB Saunders, 1989.
Freedman MT, Artz DS: Digital radiography of the chest. Semin Roentgenol 32:38, 1997.
Groskin SA: Heitzman's The Lung: Radiographic-Pathologic Correlations. St. Louis: Mosby Year Book, 1993.
Hagge RJ, Coleman RE: Positron emission tomography: lung cancer. Semin Roentgenol 37:110, 2002.
Hartman TE: Dual-energy radiography. Semin Roentgenol 32:45, 1997.
Jackson CL, Huber JF: Correlated applied anatomy of the bronchial tree and lungs with a system of nomenclature. Dis Chest 9:319, 1943.
Leung AN: Spiral CT of the thorax in daily practice: optimization of technique. J Thorac Imaging 12:2. 1997.
Lubert M, Krause GR: Patterns of lobar collapse as observed radiographically. Radiology 56:165, 1951.
McCloud TC, et al: Bronchogenic carcinoma: analysis of staging in the mediastinum with CT by correlative lymph node mapping and sampling. Radiology 182:319, 1992.
Miller WT: The radiologist in the intensive care unit. Semin Roentgenol 32:86,1997.
Miller WT, Freedman M, eds: Digital radiology using storage phosphor technology. Semin Roentgenol 32, 1997.
Miller WT, MacGregor RR: Tuberculosis: frequency of unusual radiographic findings. AJR Am J Roentgenol 130:867, 1978.
Milne EN: A physiological approach to reading critical care unit films. J Thorac Imaging 1:60, 1986.
O'Connell RS, McLoud TC, Wilkins EW: Superior sulcus tumor: radiographic diagnosis and workup. AJR Am J Roentgenol 140:25, 1983.
Ravenel JG, McAdams HP: Multiplanar and three-dimensional imaging of the thorax. Radiol Clin North Am 41:475, 2003.
Ravin CE, Chotas HG: Chest radiography. Radiology 204:593, 1997.
Rydberg J, Liang Y, Teague SD: Fundamentals of multichannel CT. Radiol Clin North Am 41:465, 2003.
Sagel SS, et al: Efficacy of routine screening and lateral chest radiographs in a hospital-based population. N Engl J Med 291:1001, 1974.
Schaefer CM, et al: Improved control of image optical density with low dose digital and conventional radiography in bedside imaging. Radiology 173:713, 1989.
Shanks SC, Kerley P: A Textbook of X-ray Diagnosis. Vol 2. Philadelphia: WB Saunders, 1951.
Swensen SJ, et al: Lung nodule enhancement at CT: prospective findings. Radiology 201:447, 1996.
Tocino I: Chest imaging in the intensive care unit. Eur J Radiol 23:46, 1996.
Tocino I, Westcott JL: Barotrauma. Radiol Clin North Am 34:59, 1996.
Turkington T, Coleman RE: Clinical oncologic positron emission tomography: an introduction. Semin Roentgenol 37:110, 2002.
Vix VA: Roentgenographic manifestations of pleural disease. Semin Roentgenol 12:277,1977.
Webb WR, Muller NL, Naidich DP: High Resolution CT of the Lung. 3rd Ed. Philadelphia: Lippincott Williams & Wilkins, 2001.
Weibel ER, Gil J: Structure function relationship at the alveolar level. In West JG (ed): Bioengineering Aspects of the Lung. New York: Marcel Dekker, 1977.
Westcott JL, Cole S: Plate atelectasis. Radiology 155:1,1985.
Woodring JH, Reed JC: Radiographic manifestations of lobar atelectasis. J Thorac Imaging 11:109, 1996.
Zeman RK, et al: Helical body CT: evolution of scanning protocols. AJR Am J Roentgenol 170:1427, 1998.
Reading References
Boiselle P: Multislice helical CT of the central airways. Radiol Clin North Am 41:561, 2003.
Collins, J. Costello P: Multidetector row CT of the chest. Semin Roentgenol 38(2), 2003.
Genereaux GP: Radiologic assessment of diffuse lung disease. In Tavaras JM, Ferrucci JT (eds): Radiology: Diagnosis Imaging, Intervention. Philadelphia: JB Lippincott, 1986.
Heitzman ER: The Mediastinum: Radiologic Correlations with Anatomy and Pathology. St. Louis: CV Mosby, 1977.
Niklason LT, et al: Portable chest imaging: comparison of storage phosphor digital, asymmetric screen-film, and conventional screen-film systems. Radiology 186:387, 1993.
Parkes WR: Occupational Lung Disorders. London: Butterworths, 1982.
Renner RR, Pernice NJ: The apical cap. Semin Roentgenol 12:299, 1977.
Weiser JC: Digital radiography using storage phosphor technology: how computed radiography acquires data. Semin Roentgenol 32:7, 1997.
EAN: 2147483647
Pages: 203