Analysis Tools
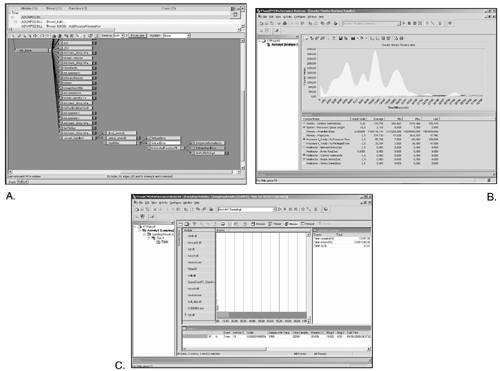
| So far we have seen how to profile our code manually, which gives us a great deal of information and control at the cost of long working hours. On top of that, some tools can help us monitor our code efficiently, detect critical zones, and keep an eye on memory use automatically. These tools are usually called code profilers, and they should help us visualize as much information about our code as possible. Many programming environments such as Borland's, Microsoft's Visual C++, and most others come with built-in profilers. Traditionally, these packages provide you with lots of different data: percentage of CPU use for each routine, call stacks, and so on. Microsoft's Visual C++ environment, for example, gives you complete information on the percentage of CPU time taken by each function in your code. It can also help you track down memory issues, such as leaks, and should be really helpful in your personal battle with bugs. Beyond commercial profilers, some higher complexity tools can help us out in ensuring top performance for our game. A good example would be VTune by Intel (see Figure A.1), a code analyzer, optimizer, and memory checker. VTune is very helpful if you need to track your code closely. It has a built-in hotspot detector that can help us find and graphically represent where the CPU time is being spent. Then, there's the Code Coach, which analyzes your code and provides tuning advice oriented to increase its performance. Also, VTune comes with a host of assembly-language optimizers and analyzers. The dynamic assembly analyzer, for example, provides a thorough analysis of the dynamic behavior of your application, that is, cache use, branch prediction, branch target buffer, and so on. Remember, many clock cycles are lost at the micro-level because of bad dynamic policies. Nonsequential memory accesses stall the cache and so on. Figure A.1. Intel's VTune profiling and analysis tool. A) Using the call graph when debugging an error inside an XML parser. VTune shows us the offending call. B) The counter monitor showing CPU load on an application. Notice it is very high when we are loading data and diminishes afterward. C) The module sampler showing an application making heavy use of the DirectX Hardware Abstraction Layer (HAL).
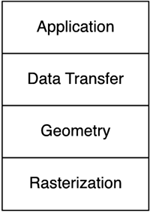
Detecting BottlenecksArmed with our toolbox of analyzers and tools, it is now time to actually optimize that piece of game code. Generally speaking, slow code is usually caused by a slower than expected subsystem that drags the whole performance down. The same way a herd of sheep advances as slowly as the slowest one, code is frequently dragged down by a slow component that requires further optimization. That component is called the bottleneck, and part of the solution begins by locating the offending code so we can improve its performance and make a huge impact on the overall results. It makes no sense to spend time optimizing code that's actually performing well. Bottlenecks are usually located in one of four major areas: application, data transfer, geometry, and rasterization (see Figure A.2). The application stage runs the game logic, AI, collision detection, and so on. It is performed fully by the CPU, although some examples of hardware-accelerated collision detection are beginning to arise. Then, a data transfer phase is used to deliver data to the hardware using buses: geometry, textures, lights, and so on. Data transfer depends on many components. The CPU speed will determine the rate at which data is sent, the bus architecture and speed will tell us how much bandwidth we have to perform the transfer, and the graphics subsystem can provide a host of features that will significantly enhance or degrade performance. Once data is in the graphics subsystem, two stages are performed sequentially: First, the geometry stage illuminates and transforms data to screen coordinates. Second, rasterization actually paints pixels to the screen. These are the four mission-critical components for any game engine. However, there are other secondary sources of bottlenecks, such as audio, disk I/O, or input processing. But application, data transfer, geometry, and rasterization are the four main components, and thus most problems arise from them. These four account for most of the processing time, so we will end up optimizing those components that make a bigger impact. Input processing rarely takes a significant piece of the pie, so the potential for improvement is limited. Figure A.2. The four stages suitable for optimization.
Now, let's see how to determine which component is the bottleneck. This is a trial-and-error process, albeit a very scientific one. You must vary the workload of the section you are analyzing while trying not to impact the rest of the code. Then, study how performance varies as the workload is modified. Alternatively, try to shut down all phases but the one you are analyzing and vary the workload of that phase to measure performance variations. Recall that we learned how to build performance monitors that graphically show us how much time is being spent in each portion of the code. Now, it is a matter of using them to detect slower than expected zones. Application, for example, can be the bottleneck if your AI is too slow or collision detection is taking too long to execute. To detect these situations, all you have to do is attach the game logic to a null driver, so the geometry and rasterization stage are basically idle. For example, take all the calls that actually render geometry and deactivate them. Make sure any scene traversal operations (quadtrees, BSPs, and so on) are also inactive. Using a performance monitor such as the one explained in the "Timing" section, you should see all the geometry and the rendering calls consuming zero or very little resources. Does the performance increase, or does it basically stay unchanged? If no improvement is visible, your game logic is the bottleneck: Even with no graphics, in this case, performance stands still. In the next section, I will propose several ways of improving game logic performance. Detecting a data transfer problem is a twofold process because we can be suffering a bottleneck transferring either textures or geometry (or both). To test for a texture bottleneck, simply replace your texture set with a different one where all textures are scaled down. Dividing texture size by a factor of two or even four is a good idea. Dividing by four means that you are transferring one sixteenth (or approximately 6%) of the initial volume of data. If performance increases, the application was texture bound, and we will need to work on ways to spend less time transferring textures. Do not forget that one image is not only worth a thousand words, but also costs a thousand words. Textures take lots of memory, and thus take a long time to transfer. Detecting if the problem lies in the geometry transfer is a bit trickier. We could try to send fewer triangles down the pipeline because this would vary the workload at this stage. But as a side effect, we would be influencing the geometry stage as well (less vertices would be transformed and lit), so our analysis would not be very accurate. The best way to detect a geometry transfer problem is to vary not the number of primitives but the format. We can change colors from floats to unsigned bytes, simplify normal encoding, and so on. This way the geometry stage is actually processing the same amount of data, and all performance variation can surely be attributed to the change in the geometry transfer stage. If performance varies significantly, we need to work on optimizing this stage. Detecting a geometry bottleneck is the hardest of all. It is difficult to isolate the geometry pipeline and profile it without causing undesired side effects to the neighboring phases. We might attempt one technique to stress test the geometry stage and end up affecting the rasterizer stage as well. Thus, indirect methods must be used frequently because a frontal assault to the problem is often not possible. Generally speaking, the geometry stage includes scene traversal, transforms, and lighting. Testing for lighting issues is relatively straightforward. All we have to do is remove some or all light sources from the scene and see how performance evolves. If it varies greatly, lots of time was spent in the lighting portion of the geometry stage, and that means we were lighting bound. This occurs frequently in older graphics cards or if we are using many light sources. Traversal and transforms are the hardest to test for. Altering this code will definitely affect the rasterizer stage because objects will change their state from visible to invisible. Thus, it is not easy to detect when our transform engine is simply taking up too many resources. As a first approach, we could profile the rasterizer and application separately and, if neither of them seems to be causing a bottleneck, we can be sure the geometry stage is responsible. A second alternative is to use carefully located timers, so we can take samples without affecting the rest of the code. Additionally, testing for a bottleneck in the rasterizer stage is really straightforward. These bottlenecks appear whenever the graphics hardware has problems painting the amount of pixels we are feeding it with. Thus, the easiest way to test for such a scenario is to reduce the size of the window or graphics mode resolution. This causes the hardware to render fewer pixels. A significant performance gain is a clear signal that our rasterizer was dragging performance down, and thus needs optimization. An alternative method is to use a depth-complexity image, which will help us visualize the amount of overdraw we are suffering. Overdraw kills performance at the rasterizer stage because the same pixel gets painted many times. We will discuss how to build depth-complexity images in the section "Tuning the Rasterizer Stage." |
EAN: N/A
Pages: 261

