Using and Managing Reports
|
|
Options for reporting in Project are seemingly endless. Built-in reports exist for each of the situations mentioned above and dozens more. For those rare occasions when Project doesn’t have a report to meet the needs of your audience, you can build one from scratch using fields and formatting of your own choice.
In most cases, you’ll follow this simple four-step strategy:
-
Navigate to the view or report that is closest to the information you need.
-
Customize the view or report by applying filters, grouping, adding or deleting fields, and so on.
-
Format the report so the information you want to emphasize stands out—change the color of bars in charts, highlight filtered data, add logos, and add pictures and drawn objects where appropriate.
-
Print the view or report you want.
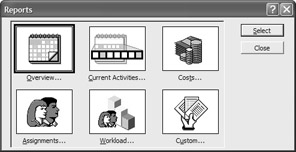
To make it easier to find the report for which you are looking, Project categorizes the built-in reports for you. Click View Ø Reports to open the Reports dialog box. All report categories appear there.
| Note | The view displayed onscreen at the time the report is generated determines the level and type of detail displayed in the report. For example, if a summary task is collapsed in the outline, the subtasks won’t show up in report task lists. Similarly, if you’ve filtered a view, only the filtered data shows up in the report. |
Overview Reports
An overview report provides just that: an overview of an aspect of the project at a fixed point in time. These reports work well with managers, team members, and stakeholders alike. Click the Overview button in the Reports dialog box and then click Select to see the Overview Reports.
| Tip | You can also display any reports list by double-clicking on the button in the Reports dialog box. |
Choose the report that best meets the needs of your audience—you can always customize it later. Click the Select button to display a preview of the report. Table 17.1 offers a brief description of the Overview Reports.
| Report Name | Description |
|---|---|
| Project Summary | Compares actual dates, durations, work, total costs, and task status with the project baseline. |
| Top Level Tasks | ID, name, duration, start and finish dates for the highest level tasks and summary tasks, based on the outline. |
| Critical Tasks | Start and end dates for all critical tasks, including predecessors and successors for each task. |
| Milestones | Milestone tasks sorted ascending by start date. (Of course, you can change the sort order, and other settings if you customize.) |
| Working Days | Shows the base calendar in table format, with days of the week in one column and working hours for each day in another column. Exceptions to the base calendar are also shown. |
Current Activities Reports
The Current Activities reports are primarily task-focused, but you can add resource information by customizing. (See “Customizing Reports” later in the chapter.) Click the Current Activities button in the Reports dialog box and then click Select. You’ll see the six reports summarized in Table 17.2.
| Report Name | Description |
|---|---|
| Unstarted Tasks | Tasks that haven’t begun, listed with their immediate predecessors and related fields. |
| Tasks Starting Soon | Tasks that are scheduled to start within or finish after a date you choose. |
| Tasks in Progress | Tasks that have started, together with the resource information associated with the task. |
| Completed Tasks | Just like it saysshows tasks that have finished with their start and completion dates. The report is sorted by month and then by Task ID. |
| Should Have Started Tasks | You choose data, and Project lists the tasks that should have started but haven’t. |
| Slipping Tasks | Displays tasks that have been rescheduled past the baseline start date. |
Figure 17.5 shows a preview of the Tasks Starting Soon report for the XYZ-BOT project. We adjusted the font size of the report header (previously covered); all other settings are defaults.
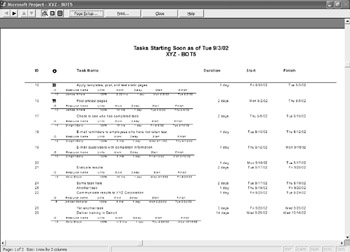
Figure 17.5: The Tasks Starting Soon report
To produce the Tasks Starting Soon report, Project requires you to supply two date parameters. In other words, Project needs to know your definition of “soon.” Many reports require parameters. You have to define a date range, choose a resource, choose a cost range, and so on. When you select a report that requires one or more parameters, a dialog box displays.
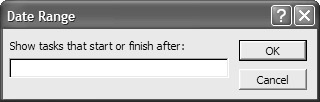
Enter the parameter requested—dates are entered in the mm/dd/yy format—and then click OK. If an additional parameter is needed, such as the report ending date, another dialog box appears.
Costs Reports
In the real world, success or failure of the project is often measured in dollars. You might finish on time with a stellar product, but if you’re at double the budget, stakeholders are likely to be displeased.
Costs reports allow you to catch discrepancies early on while there’s still a chance of pulling your project back on budget. Project’s built-in costs reports are described in Table 17.3.
| Report Name | Description |
|---|---|
| Cash Flow | Shows weekly cost by task. Can be customized to show different time units. |
| Budget | Displays actual vs. budged costs per task. Includes a calculated variance field. |
| Overbudget Tasks | Tasks with actual costs exceeding baseline costs. |
| Overbudget Resources | Resources with actual costs exceeding baseline costs. |
| Earned Value | BCWP (Budget Cost of Work Performed). This report shows how much of the budget should have been spent as of the current date, based on total work and resource costs. |
Figure 17.6 previews a Cash Flow report that allows you to see our monthly spending well into the future.
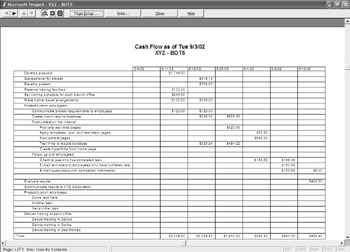
Figure 17.6: The Cash Flow report
Assignment Reports
Resource reporting is the focus of the Assignments reports. You can print task lists for the entire team and then review them all at once; or you can select a resource and then print a list of that person’s tasks with completed tasks checked off. When you click the Assignments button in the Reports dialog box, you’ll see four choices, which are summarized in Table 17.4.
| Report Name | Description |
|---|---|
| Who Does What | Lists each resource and the assigned tasks for that resource. Includes work units, start and finish dates, and a delay field to let resources know whether their work will start on schedule. |
| Who Does What When | Resources and their assigned tasks, with a calendar showing daily work assigned for each task. This is a large report because you get a column for every working day in the project. |
| To-Do List | You choose a resource, and Project gives you a list of tasks for that resource, along with start and finish dates, duration, predecessor task ID, and other assigned resources. If a task is complete, it’s checked off. |
| Overallocated Resources | Lists overallocated resources with their assigned tasks, including start and finish dates, duration, and delay. |
Figure 17.7 shows the Who Does What When report, which is a good way to keep track of your resource assignments.
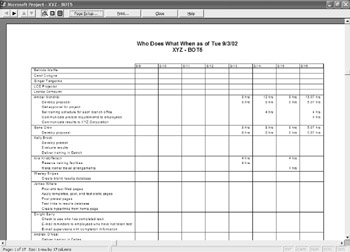
Figure 17.7: The Who Does What When report
Workload Reports
There are two Workload reports, both providing information on tasks and the resources assigned to them.
The Task Usage report lists tasks and their assigned in the first column. The rest of the columns are dates (representing one-week increments), with the scheduled work displayed for each task and each resource. Figure 17.8 shows a small portion of one Task Usage report.
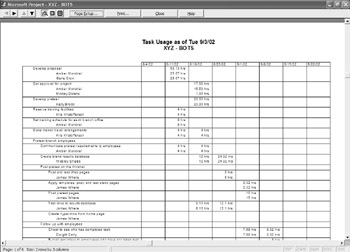
Figure 17.8: The Task Usage Report
The Resource Usage report is similar to the Who Does What When report (an Assignments report). Resource Usage shows assigned work by week, rather than by day.
Other Reports
If you choose Custom from the Reports dialog box, the Custom Reports dialog box opens. Here, you’ll find a list of reports available for customization. Several of these reports are different from the ones we’ve seen in the categories described above. Table 17.5 briefly describes some additional reports you may find useful.
| Report Name | Description |
|---|---|
| Base Calendar Report | Same as the Working Days report in the Overview section. |
| Task | A list of tasks, durations, start and finish dates, predecessors, and assigned resources. Similar to the To Do list report, but doesn’t prompt for a specific resource. |
| Crosstab | Similar to the Task Usage report, except costs are shown in daily increments. (In Task Usage, work is shown in weekly increments.) |
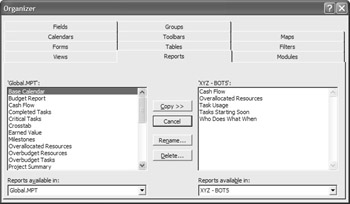
Any custom reports you create in one project can be easily copied to other projects, using Project’s Organizer feature. To use the Organizer to copy a report, follow these steps:
-
Select ToolsØOrganizer to open the Organizer dialog box.
-
Select the Reports tab.
-
Select the file that contains the custom report using the Views Available In drop-down list on the left side of the window.
-
Make sure the active project is selected in the right side Views Available In drop-down list.
-
Click the report you want to import.
-
Click the Copy button.
The report you imported now appears in the Custom Reports dialog box.
|
|
EAN: 2147483647
Pages: 241