Customizing Reports
|
|
There are really only two types of customization for reports (and views): You can change the appearance (formatting), and you can change the content. Certain reports such as the Project Summary will let you change only appearance. Others offer dozens of options for changing both appearance and content.
When you print a view, the content and appearance settings need to be in place before you print. A report can be customized while you’re in the process of generating it.
| Note | Although you can’t customize column widths in Project reports, there is an indirect relationship between the width of the column in the table the report is using and what appears in the report. For example, if the report uses the Entry table and the Name column is set to 80, the column will be much wider in the report than if the column width were set to 20. |
Changing the Appearance of a Report
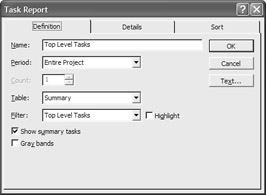
After you’ve chosen the report you want to produce in the second Reports dialog box (but before you actually open the report), click the Edit button. This displays the customization options for that report. If you’re working from a resource report, the Resource Report dialog box opens. If you’re working from a task report, you’ll see the Task Report dialog box.
When you’re concerned with appearance rather than content, check the following settings:
-
On the Definition tab, change the Name field if you want the report’s title to be something other than the default.
-
Check the Gray Bands option on the Definition tab if you want to see divisions between major units in the report.
-
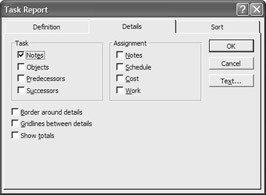
On the Details tab, choose whether you want a border around and gridlines between details. Gridlines are the horizontal lines and borders are mostly vertical. This may be opposite from how you normally think of gridlines and borders.
-
Click the Text button to choose a font, font style, font size, and color for fields of a certain type.
After you change a report’s appearance (or content, for that matter), it is considered “customized” and shows up on the list of reports in the Custom Reports dialog box. If you want to make further changes, select the report from there and then click the Edit button.
Changing the Content of a Report
Begin content customization the same way you did with appearance: choose the report you want to produce, and click the Edit button. Content customization settings include the following:
Period Change this setting if you want a different time interval for the selected report.
Count Determines how many periods to display in one interval. Example: You’ve selected Month for the Period and 2 for the Count. The report will show two-month time intervals.
Table Determines the fields used in the report. To see different report fields, choose a different table, including any custom tables you’ve created for which the Show in Menu option is enabled. (See Chapter 16 for more on creating and customizing tables.)
Filter Determines the type of task or resource information that gets displayed. For example, the Overallocated Resources report applies the overallocated resource filter so that resources that aren’t overallocated do not appear on the report. Enable the Highlight check box if you want to see all information while highlighting the information that meet the filter criteria. (See Chapter 16 for more on creating and applying filters.)
Resource Details (or Task Details) You use the Details tab to select which fields to display in your report. For each field that you enable, except Objects, the information prints once per resource or once per task. Objects work a little differently. (See the Drawing Tools section, later in this chapter.) Example (resource): Enable the Calendar field on the Who Does What report, and each resource’s calendar prints at the end of the task section for that resource. Example (task): Enable the Predecessor check box and each task shows predecessor information.
Assignment Details The choices you make here determine the fields that print for each resource (in Resource reports) or each task (in Task reports). Examples: Choose Schedule to see start and finish dates, and delay information; choose Cost to see Baseline Cost, Actual Cost, and Remaining Cost data.
Show Totals Enable the Show Totals check box (on the Details tab) if you want numeric fields totaled.
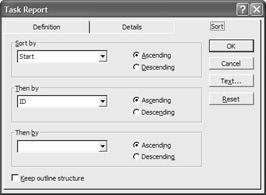
Sort Order Choose a Sort order using the controls on the Sort tab of this dialog box. Chapter 16 covers sorting in views and tables; it works the same when you sort data in reports.
Using Graphic Objects in Views and Reports
Chapter 18 describes in detail how you can link or embed objects (such as Word documents, Excel spreadsheets, pictures, and other graphics) to tasks and resources. For example, you can do the following:
-
Link a task such as “Create jingle for new ad campaign” to a Word document that describes in more detail what the task is about. The jingle document might describe the client’s feelings about length, type of music, use of lyrics, and so on.
-
Embed a picture of each resource with its other resource information.
-
Insert a text box on the Calendar to remind team members that the network will be down for half a day of reconfiguring.
-
Include your company’s logo or the client’s logo in a view.
-
Insert a hyperlink to the client’s website.
-
Attach a brief sound or video clip from each resource, stating its commitment to and goals for the project. (Seems like a lot of extra work for nothing? Think how useful this could be six months from now when that one resource—yes, you know the one” keeps falling behind on scheduled work and seems disillusioned about her role in the project.)
Note Before adding objects to your project, it’s a good idea to establish a central location for all project-related files. It could be a shared folder on the network, or a web address on your intranet. Either way, you’ll want links to all the files in one place. That way, the files are easy to locate when you need to link, embed, browse, back up, or edit them.
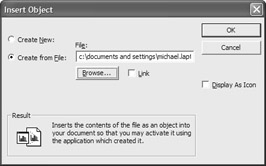
The Insert Object button is found on the Notes tab of both the Task Information and Resource Information dialog boxes. When you click the Insert Object button, the Insert Object dialog box, shown in Figure 17.9, opens.
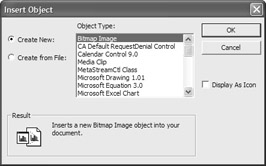
Figure 17.9: The Insert Object dialog box
After you open the Insert Object dialog box, you have two choices: You can create a new object from scratch, or you can insert an object that already exists.
| Note | You don’t have to attach an object to a task or resource. You can choose Insert Ø Object from the menu to create the object in the Gantt chart, for example, as part of the view. |
Inserting a New Object
Let’s assume that you’re attaching this new object to a resource. In the Resource Information dialog box, click the Notes tab; then click the Insert Object button to open the Insert Object dialog box. Make sure that the Create New option is selected at the left. Scroll the list to choose the type of object you want to create, and click OK.
Project assumes that you know what you’re doing with the program you’ve selected because after you click OK, the selected program launches. Create the object as you normally would, using the tools of the application you selected. When you’re done, close the application and you’ll see the new object. Figure 17.10 shows the Resource Information dialog box with a newly created PowerPoint slide object.
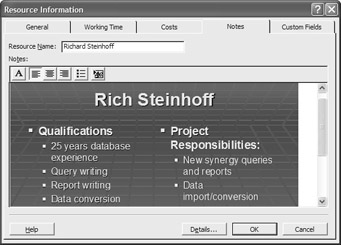
Figure 17.10: A PowerPoint slide inserted into your project
Inserting an Existing Object
Click Insert Ø Object (or click the Insert Object button on the Notes tab of the Task Information or Resource Information dialog boxes) to open the Insert Object dialog box, shown previously in Figure 17.9. Choose the Create From File option. The dialog box changes to give you browsing options instead of the scroll list of programs.
Click Browse to navigate to the folder that contains the object you want to insert. Select the object file and then click OK. The path is inserted in the File field of the Insert Object dialog box. From there, you can choose to link to the file (see Chapter 18 for more on linking), and/or display the file as an icon that users double-click to view. Click OK when you’re through, and you’ll see the object you inserted or the icon representing that object.
| Note | You can also attach an object directly to a task or resource, rather than to the Notes for that task or resource. Choose the Task Form or Resource Form view. Right-click the viewer portion, and choose Objects. Click InsertØObject and then proceed as usual. |
Viewing and Printing the Inserted Object
Resource table views display an Indicator column with icons denoting the condition of the resource. When you see the Notes icon in the Indicator column, it indicates that there is something on the Notes tab of the Resource Information dialog box for that resource. Double-click the resource name to open the Resource Information dialog box, right-click the Notes icon and then choose Resource Notes from the shortcut menu. You’ll see the object or an icon representing the object. If it’s an icon, you have to double-click one final time and you’re there!
If you want an object you’ve attached to Notes to appear in a printed report, you have to edit the report to include Notes in the details. From the top, do the following:
-
Click View Ø Reports to open the Reports dialog box.
-
Choose the type of report you want to print. Let’s say you’re printing a Who Does What report, and you want to see the pictures you’ve attached to each resource. Choose Assignments and then click Select.
-
Choose Who Does What, and click Edit.
-
Click the Details tab, and enable Notes. Click OK and then click Select. You should see the inserted objects at the end of each resource’s list of tasks.
Choosing which details to print in a report can be tricky. Your first instinct might be to enable Objects rather than Notes. But the Objects choice prints only objects you’ve inserted directly into the view, or attached directly to a resource or task, not those you inserted on the Notes tab.
When you insert objects into sheet views, you can’t see them to delete them. That’s because they’re being attached directly to the task (or resource). To see the object, split the window, click in the bottom pane to activate the task form, and click Format Ø Details Ø Object. The inserted object(s) will print when you enable the Objects option under report details. Unless you spend a good deal of time using the Resource or Task Form, finding an object you previously inserted can be somewhat of a nightmare. It’s probably a good idea to attach objects to tasks or resources using the Notes tab, rather than inserting them directly into a sheet view.
Objects cannot be inserted into Network Diagram view, even though that menu choice is available. When you insert an object into the Network Diagram, you’re really attaching it directly to a task. Just view the task form (as mentioned previously) to see the inserted object.
Using the Drawing Tools
There’s always supplementary information about tasks and resources that you can include in the Notes for that task or resource; however, to highlight this type of information on the Gantt chart, you might choose to use drawing tools. For example, you could insert a text box with a comment about a task or group of tasks. You can draw lines or arrows to visually relate the text box to a particular task, or you can use the Assign To Task feature to link it for real. Objects created on the Gantt chart can add information or draw attention to a particular task, as shown in Figure 17.11.
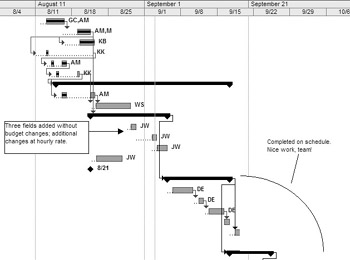
Figure 17.11: A Gantt chart with various objects inserted
You’ll need the Drawing toolbar to create the types of objects shown in Figure 17.11. Click View Ø Toolbars Ø Drawing to turn it on. Project’s Drawing toolbar (shown in Figure 17.12) uses slightly different Drawing tools than the other Microsoft Office applications. Similar to the other drawing tools, there are buttons to create objects as well as buttons to format existing objects.
| Tip | Another way to display the Drawing toolbar is to right-click any existing toolbar and then choose Drawing. |
![]()
Figure 17.12: Project’s Drawing toolbar
Drawing an Object
To create a drawing object, follow these steps:
-
Click once on the button to select the type of object you want to draw. The mouse pointer changes to cross-hairs.
-
Click and drag on the Gantt chart. Release the mouse when the object is the approximate size you want.
Note If you’re creating a polygon, you have to drag a line for each side of the shape. When you draw the final line that completely encloses the shape, the polygon tool turns itself off.
-
Move and/or resize the object as needed. To resize, simply point to one of the object handles. When the pointer changes to a two-headed arrow, drag the object smaller or larger. (If you’re trying to resize a polygon and dragging the handles only changes its shape, click Draw Ø Edit Points). To move the object, point at it (but not on a handle); then click and drag to the new location.
-
Format the object as desired (see the following section).
Formatting an Object
By default, all Project drawing objects have a black line and white fill. If all you want to do is change the fill color from white to another solid color, you can select the object and then click the Cycle Fill Color button on the Drawing toolbar. Continue clicking until you see the fill color you want.
To change the fill pattern, the border width and color, or to remove the border completely you’ll have to adjust the object’s properties. Select the object and then choose Format Ø Drawing Ø Properties, or right-click the object and then choose Properties from the shortcut menu. The Format Drawing dialog box opens.
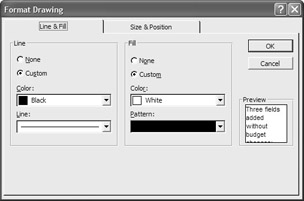
Select the Line & Fill tab, and adjust the line and fill settings until the Preview window displays the look you’re aiming for; then click the Size and Position tab to see additional settings.
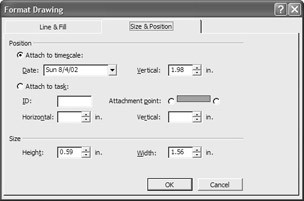
Use the Attach To Timescale option to anchor the drawn object vertically and horizontally, relative to the timescale. The Date control determines where the object is anchored horizontally. The Vertical control reflects the amount of space between the top of the object and the timescale area of the Gantt chart.
| Note | The Vertical measurement assumes that the Gantt chart is scrolled to the top. |
Use the Attach To Task option to keep the object with the selected task, even if the task gets delayed or scheduled for a different start date. Enter the ID number of the task you’re attaching to and then choose whether you want to attach at the beginning or end of the task bar. Adjust the Vertical and Horizontal spin settings to determine the position of the object relative to the task bar to which it’s attached.
Here’s where it can be a bit tricky. If you’re attaching the object to the left end of the task bar, the horizontal spin setting must be a negative number, or the object will still appear to the right of the task bar. If you’re attaching to the right end of the task, make sure the horizontal spin setting is a positive number. If both horizontal and vertical settings are set to zero, the object will appear on top of the task bar to which it’s attached.
| Note | You can still drag an object to move it, even if it’s anchored to the timescale or attached to a task. The vertical and horizontal settings adjust automatically when you drag to reposition. |
You can quickly access the Attach To settings of a selected object by clicking the Attach To Task button on the Drawing toolbar.
Using the Draw Menu
The Draw menu on the Drawing toolbar includes other options for manipulating objects. Drawing objects are placed in separate layers on top of the Gantt chart. Sometimes, you have to adjust the order of objects so they don’t cover up Gantt bars you want to display. For example, the arc we created had to be “sent back” so it didn’t cover the Gantt bars. Select the object that’s in the way, and click Draw Ø Send To Back; or, if it’s the Gantt chart that’s in the way, click the object and then choose Draw Ø Bring To Front. Bring to Front and Send to Back move the selected object(s) in relation to text and bars of the Gantt chart itself.
Use the Bring Forward and Send Backward commands when you have more than two object layers on the Gantt chart. These commands move the selected object one layer at a time.
| Tip | Unlike other Office applications, Project does not support object grouping. Instead, use the Attach To Task and Attach To Timeline settings to make sure that your graphics stay put. |
The Edit Points command on the Draw menu allows you to change the shape of a polygon. When the feature is active, dragging a handle on a polygon changes its shape. When the Edit Points feature is inactive, dragging a handle on a polygon resizes it.
Copying a Picture of Your Project
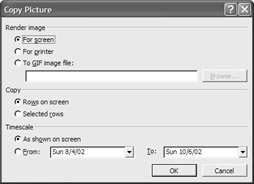
One of the easiest ways to include Project information in a report is to take a picture of it. The “report” might be a Word document, an Excel spreadsheet, or even a web page. In Project, navigate to a view that contains the information you need, and select Edit Ø Copy Picture; or click the Copy Picture button on the Standard toolbar. This opens the Copy Picture dialog box.
| Warning | Copy Picture is not supported in the Relationship Diagram, Resource Form, and Task Form views. |
Begin by selecting a Render Image option. Choose For Screen if you want the picture to display exactly as it looks on your monitor. Choose For Printer if you want the picture to display as it would when printed in Project. Choose To GIF Image File if you’re planning to use the picture on a web page. If you choose this third option, you must specify a filename and location.
Next, choose a Copy option. It’s helpful to note that you don’t have to print the entire picture. You can select certain portions of your view, click Copy Picture, and choose the Selected Rows option. If you want to use a timescale other than the one shown onscreen, enter the beginning and end dates and then click OK.
If you chose For Screen or For Printer from the rendering options, switch to the program you want to use to display your Project picture and then paste using the appropriate command from that program.
| Tip | Ctrl+V works to paste into most Windows-based programs. |
Using Hyperlinks
If you want to include links in your project to information on the Internet, you’re in luck. Project 2002, similar to other Office programs, supports hyperlinks to document files and to websites. When you click the hyperlink, your default browser opens and displays the hyperlinked information.
| Note | It’s helpful to note that hyperlinks do not increase the size of your project file and the linked information is always up to date; however, you may not have access to linked information when you are working offline. |
There are several ways you can use hyperlinks in your Project files:
-
Place the hyperlink(s) in a task or resource note.
-
Insert a hyperlink into the Hyperlink column in a sheet view.
-
Insert the hyperlink into an additional text-based column.
To insert a hyperlink on the Notes tab of a task or resource, simply type the URL in the open Notes field. It’s just too easy!
To insert a hyperlink into the Indicator column of a sheet view, do the following:
-
Switch to a sheet view, and select the task or resource for which you want to include the hyperlink.
-
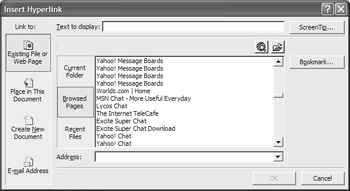
Click Insert Ø Hyperlink on the menu, or click the Insert Hyperlink button on the Standard toolbar to open the Insert Hyperlink dialog box.
Warning Don’t confuse the Insert Hyperlink button with the Link Tasks button. They both include a chain link graphic, but the Insert Hyperlink button also has a big globe behind the chain.
-
Select one of the four Link To options displayed on the Places bar at the left side of the dialog box. The choice you make here determines the next few steps in the hyperlink process.
-
To link to an existing file or web page, click the appropriate Browse button to find and then select the file (or Page) you’re linking to. In the Text To Display field at the top of the dialog box, type the text you want to use to indicate the presence of the hyperlink. Click the ScreenTip button and then type the text you want to see when you hover the mouse over the Hyperlink icon. Click the Bookmark button to select a specific location within the web page you’re linking to.
-
To link to a place in this document, type some text to display and a screen tip; then enter a task or resource ID, and click the view you want displayed when the hyperlink is clicked.
-
To link to a new document you’re about to create, choose that option and then type the text to display and screen tip. Click the Change button and then browse to the folder location where you want to store this new file. Type a filename for the new file, and choose a file type from the drop-down list in the Create New Document dialog box; then click OK. Back in the Insert Hyperlink dialog box, choose whether you want to edit the document now (in which case, when you click OK, you’re transported to the application for the file type you chose), or choose to edit the document later (to have Project launch the application when you click the hyperlink.)
-
To link to an e-mail address, type the text to display and screen tip; then enter the e-mail address of the person whom you want to contact, or select it from the list of recently used addresses if it appears there. Enter a subject for the e-mail to have that information in place when you click the hyperlink.
-
Click OK to close the Insert Hyperlink dialog box, and create the hyperlink.
The hyperlink icon appears in the Indicators column of the sheet view. When you mouse over the icon, the pointer changes to a hand, and you’ll see the text you typed in the Screen Tip dialog box. Click the hyperlink to go to the file, web page, alternative location in the project file, new document, or e-mail address you indicated when you created the hyperlink. To return to the project file, simply close the window that opened when you activated the hyperlink.
You can remove or edit an existing hyperlink by right-clicking the hyperlink icon, and choosing Hyperlink Ø Edit Hyperlink (or Remove Hyperlink).
| Tip | To insert a document link on the Notes tab of the Task or Resource Information dialog box, click the Insert Object button and then follow the steps you would normally follow to create a new object. (See specific steps under “Inserting A New Object,” earlier in this chapter.) Make sure that you enable the Display As Icon check box before you click OK. You won’t see a hyperlink icon in the Indicators column when you link this way. Instead, you’ll see a Note icon. To add a Tool Tip for this Note icon, type a short amount of descriptive text anywhere in the blank space around the icon you just inserted. |
|
|
EAN: 2147483647
Pages: 241